

Abstract
Phosphorylation of tau at sites associated with Alzheimer’s disease (AD) likely plays a role in the disease progression. Mitochondrial impairment, correlating with increased presence of phosphorylated tau, has been identified as a contributing factor to neurodegenerative processes in AD. However, how tau phosphorylated at specific sites impacts mitochondrial function has not been fully defined. We examined how AD-relevant phosphomimetics of tau impact selected aspects of mitochondrial biology. To mimic phosphorylation at AD-associated sites, the Serine/Threonine (Ser/Thr) sites in wild-type green fluorescent protein (GFP) tagged-tau (T4) were converted to glutamic acid (E) to make pseudophosphorylated GFP tagged-Ser-396/404 (2EC) and GFP tagged-Thr-231/Ser-235 (2EM) constructs. These constructs were expressed in immortalized mouse hippocampal neuronal cell line and their impact on specific mitochondrial functions and responses to stressors were measured. Phosphomimetic tau altered mitochondrial distribution. Specifically, mitochondria accumulated in the soma of cells expressing either 2EC or 2EM, and neurite-like extensions in 2EC cells were shorter. Additionally, adenosine triphosphate levels were reduced in both 2EC and 2EM expressing cells, and reactive oxygen species (ROS) production increased in 2EC cells during oxidation of succinate when compared to T4 expressing cells. Thapsigargin reduced mitochondrial membrane potential and increased ROS production in both 2EC and 2EM cells relative to T4 cells, with no significant difference in the effects of rotenone. These results show that tau phosphorylation at specific AD-relevant epitopes negatively affects mitochondria, with the extent of dysfunction and stress response varying according to the sites of phosphorylation. Altogether, these findings show that phosphorylated tau increases mitochondrial susceptibility to stressors and extend our understanding of potential mechanisms whereby phosphorylated tau promotes mitochondria dysfunction in tauopathies, including AD.
Keywords: Alzheimer’s disease, phosphomimetic tau, mitochondria, stressors, neuronal cells
Graphical Abstract

Tau phosphorylation at specific Alzheimer’s disease (AD)-relevant epitopes negatively affects mitochondria, with the extent of dysfunction and stress response varying according to the sites of phosphorylation. Thapsigargin reduced mitochondrial membrane potential (Ψm) and increased ROS production in both 2EC and 2EM cells. The effect was more pronounced in 2EC compared to T4 cells. ATP levels were reduced in cells expressing either tau pseudophosphorylated at S396/404 (2EC) or T231/S235 (2EM), and ROS production increased in 2EC cells during oxidation of succinate compared to wild type (T4)-expressing cells. Altogether, these findings extend our understanding of potential mechanisms whereby phosphorylated tau promotes mitochondria dysfunction in tauopathies, including AD. The thickness of the arrows corresponds with the magnitude of effect.
Introduction
Tau is a unique phosphoprotein predominantly expressed in the neurons (Weingarten et al., 1975; Paterno et al., 2022). Functionally, it was originally associated with microtubule stabilization and assembly, however it is now evident that tau is involved in numerous cellular processes including mitochondria-trafficking and signaling, synaptic activity and gene expression (Ittner et al., 2008; Tracy et al., 2022). Tau functions are regulated by extensive posttranslational modifications, especially phosphorylation. Its longest isoform with two N-terminal and four repeat domains (2N4R) comprises 441 amino acids and 85 potential serine (Ser), threonine (Thr) and tyrosine (Tyr) sites where phosphorylation can occur (Xia et al., 2021). While modification at some sites is not implicated in disease, aberrant phosphorylation at specific sites can convert tau to a pathological protein (Alonso et al., 2010). Indeed, specific soluble and oligomeric species of tau that are abnormally phosphorylated at AD associated sites have been identified as pathogenic forms (Zheng et al., 2020; Xia et al., 2021). Accumulation of pathogenic tau is highly associated with neuronal damage and cognitive defects observed in AD (Xia et al., 2021; Trease et al., 2022).
Immunostaining with tau antibodies and mass spectrometry have aided the identification of specific sites in tau that are predominantly phosphorylated in AD brain (Kimura et al., 2018; Wesseling et al., 2020). Phosphorylation at Thr-181 and Thr-231 occur early in AD and likely play a key role in facilitating subsequent phosphorylation events (Wesseling et al., 2020; Stefanoska et al., 2022). Tau phosphorylated at Thr-205, Ser-396 and Ser-404 has been shown to be associated with neuronal impairment in AD (Mondragón-Rodríguez et al., 2014; Xia et al., 2021). In addition, the abundance of tau phosphorylated at Ser-202/Thr-205 has been extensively studied in AD and specific antibodies targeting these sites have been developed to monitor AD progression (Neddens et al., 2018). Despite our understanding of the contribution of aberrantly phosphorylated tau in AD pathogenesis, its mechanisms of toxicity remain to be fully elucidated. This results, in part, from our partial understanding of the impacts of abnormally phosphorylated tau on other proteins and organelles.
In addition to accumulation of phosphorylated tau, impaired mitochondrial function is an early event in the evolution of AD (Reddy, 2011; Eckert et al., 2014; Grimm et al., 2017). This indicates that there may be an interplay between abnormal tau phosphorylation and mitochondria dysfunction. Reports of tau localization in different mitochondrial compartments and its interaction with mitochondrial proteins further underscore the relationship between tau and mitochondria (Drummond et al., 2020; Tracy et al., 2022). Tau is also involved in mediating neuronal mitochondria transport (Pérez et al., 2018). Thus, it is not unexpected that tau phosphorylated at AD-relevant sites can directly impact mitochondrial functions. However, information on the impact of AD-relevant tau phosphorylation on mitochondria biology in basal and stressed conditions is not extensive. Previous investigations have revealed that tau phosphorylated at Ser-396/404 accumulates in the mitochondria of presynaptic neurons in aged mice, thereby increasing ROS generation (Torres et al., 2021, 2022). Phosphomimetic at Thr-231 impairs stress-induced mitophagy in C. elegans (Guha et al., 2020), whereas mitochondrial distribution is disrupted in immortalized rat adrenal phaeochromocytoma cell line (PC12 cells) and mouse neurons expressing tau phosphorylated at Ser-202 and Thr-205 (Shahpasand et al., 2012). Although these findings suggest that mitochondrial functions can be directly impacted by pathogenic tau, further investigations into how different AD-relevant tau phosphorylation influence mitochondrial functions are needed. Such studies will enhance our understanding of the mechanisms whereby different tau modifications induce toxicity in AD pathology.
In this study, immortalized mouse hippocampal neuronal (HT22) cells transiently expressing wild type GFP-tagged tau (T4) as well as phosphomimetic GFP-tagged tau at Ser-396/404 (2EC) or Thr-231/Ser235 (2EM) were used to examine the effects of site-specific tau phosphorylation on mitochondria functional parameters. Our results revealed that phosphomimetic tau impairs mitochondria distribution, reduces adenosine triphosphate (ATP) production, and increases ROS generation. We demonstrate that tau phosphorylated at AD-relevant sites increases the susceptibility of mitochondria to stressors, particularly endoplasmic reticulum-derived calcium stress.
Methods and Materials
Reagents
Dulbecco’s modified Eagle medium (DMEM, #2418283), gentamicin (#2328211) and GlutaMax (#2380959) were from GIBCO, Thermo Fisher Scientific (MA, USA). Glucose (#50997) was from Alfa Aesar, Thermo Fisher Scientific (MA, USA). Thapsigargin (#10522) and carbonyl cyanide 4- (trifluoromethoxy) phenylhydrazone (FCCP, #15218) were purchased from Cayman chemical company (MI, USA). Rotenone (#150154) was from MP Biomedicals (OH, USA). Tetramethylrhodamine methyl ester (TMRM, #2321830), horseradish peroxidase (HRP, #9003990) and AmplexUltra-Red (#2365697) were from Invitrogen Thermo Fisher Scientific (OR, USA). Fetal clone II (FCII, #AF29578030) was from Cytiva Hyclone (UT, USA) while paraformaldehyde (#15710) was from Electron Microscopy Sciences (PA, USA). Ethylenediamine tetraacetic acid (EDTA), L-malic acid (#97676), L-glutamic acid (#56860) and L-succinic acid (#110156) were from MilliporeSigma (MA, USA).
Cell culture and constructs
HT22 cells were provided by Dr. P.H Reddy, Texas Tech University. This cell line is not listed among the commonly misidentified cell lines by ICLAC (https://iclac.org/) and has not been recently authenticated. The cells, at a maximum passage number of 25, were cultured in DMEM supplemented with 10% fetal clone II (FCII), 2.2 mM GlutaMax, 25 µg/ml gentamicin and maintained at 37 °C in a 5% carbon dioxide (CO2) incubator. GFP-tagged human wild type tau (0N4R: GFP-T4) and its pseudophosphorylated (serine and/or threonine changed to glutamic acid) forms (GFP-T42EM: T231E/S235E (2EM) and GFP-T42EC: S396E/S404E (2EC)) were used. GFP-T4 and GFP-T42EC have been described previously (Quintanilla et al., 2014). GFP-T42EM was created by cloning T42EM (Ding et al., 2006) into the HindIII and BamHI sites of the pEGFP-C1 plasmid (6084-1, Clontech). To verify tau protein expression, cells grown until 50–60% confluent on 60 mm dishes were transfected with 0.375 µg empty vector (EV), wild type or phosphomimetic tau plasmids using PolyJet (SL100688, SignaGen Laboratories) according to manufacturer’s instructions. Protein expression was confirmed using western blot analysis. The timeline of experiments is shown in Fig. 1.
Fig. 1. Timeline of experimental design.

Mitochondrial distribution and morphology assessment (n = 4 independent cell culture preparation), Ψm assays (ΔΨm upon exposure to FCCP, n = 7 independent cell culture preparation; ΔΨm following treatment with rotenone or thapsigargin, n = 5 independent cell culture preparation, respectively), ROS production and ATP levels (n = 3 independent cell culture preparation, respectively).
Immunoblotting
Cells were gently washed with phosphate buffer saline (PBS) on ice and lysed with radioimmunoprecipitation assay (RIPA) buffer containing protease inhibitors. Thereafter, the lysates were sonicated (Misonix Inc, S-3000) for 10 s, then centrifuged at 4 °C for 10 min at 16 000g. The resulting supernatants were collected, and protein concentration was measured using bicinchoninic acid (BCA) assay. Protein was then denatured in 5x sodium dodecyl sulfate (SDS) buffer for 10 min at 100 °C. Equal protein amounts (20 µg) were loaded and separated on a 12% SDS-polyacrylamide gel (SDS-PAGE gel) and transferred onto a nitrocellulose membrane. The membrane was blocked for 60 min at room temperature with 5% non-fat milk prepared in Tris-buffered saline containing 0.05% Tween 20 (TBS-T). Then, appropriate primary antibody, rabbit anti-tau (1:40000, A0024, Dako), was added and incubated overnight at 4 °C. After washing three times with TBS-T at 15 min intervals, the nitrocellulose membranes were incubated with appropriate HRP-conjugated secondary antibody, anti-rabbit HRP (1:5000, R1006, KwikQuant, Kindle Biosciences) in 5% non-fat milk for 60 min at room temperature. Protein bands were revealed with enhanced chemiluminescence reagent (211595, Millipore, Immobilon Crescendo) and images captured with a KwikQuant Imager (Kindle Biosciences). The nitrocellulose membranes were subsequently stripped and re-probed with rabbit anti-glyceraldehyde-3-phosphate dehydrogenase (GAPDH) (1:5000, sc-25778, Santa Cruz Biotechnology, Inc.) for protein loading control.
Effect of phosphomimetic tau on mitochondrial distribution
To assess the impacts of phosphomimetic tau on mitochondrial distribution, cells were grown on glass coverslips coated with poly-d-lysine (PDL; Sigma Aldrich, A003E). The cells were allowed to grow until 50–60% confluent prior transfection with 0.75 µg total cDNA [0.375 µg mitochondrial targeted-mCherry (mCherry; Addgene, #55102) and 0.375 µg of GFP-tagged EV, T4, 2EM or 2EC]. The transfection media was replaced with freshly warmed media 16 h post-transfection then incubated for 48 h. Thereafter, the media was aspirated and cells were gently washed three times with pre-warmed PBS while slightly rocking on a shaker for 5 min. The cells were then fixed with a freshly prepared 4% paraformaldehyde-sucrose solution for 5 min and washed three times at 5 min interval with PBS. The coverslips were mounted on glass-microscope slides using Fluoro-Gel Mounting Medium (Electron Microscopy Sciences, 17985-30). Representative pictures were taken with Zeiss microscope equipped with Colibri 7 LED and Axiocam 705 camera, using 40x oil immersion objective. Excitation for GFP and mCherry were 488 nm and 590 nm, respectively, with emission at 509 nm and 610 nm. Mitochondrial distribution and abundance were assessed using Fiji Image J software.
Determination of mitochondrial membrane potential and ATP levels
Changes in mitochondrial membrane potential (ΔΨm) were determined using TMRM, a cell-permeable cationic dye that accumulates in the mitochondria. We used an optimized non-quench concentration (20 nM) of TMRM that generates fluorescence as a direct function of Ψm. Cells grown on 25 mm PDL-coated glass coverslips were gently washed twice with PBS-glucose buffer and incubated with TMRM prepared in PBS-glucose buffer for 20 min. Thereafter, the coverslips were encased in an Attofluor™ Cell Chamber (ThermoFisher, Cat# A7816) and mounted on the microscope stage. Baseline TMRM fluorescence was recorded for 5 min prior addition of 10 µM FCCP to uncouple the mitochondria depolarize Ψm. To assess the impact of stressors on ΔΨm, the cells were treated with 1 µM thapsigargin (a non-competitive inhibitor of sarcoendoplasmic reticulum Ca2+-ATPase) or 1 µM rotenone (a mitochondrial complex I ubiquinone binding site inhibitor) after baseline TMRM fluorescence was established. Notably, the cells were maintained in TMRM in PBS-glucose buffer during imaging to prevent re-equilibration of the dye across the mitochondria membrane (Debattisti et al., 2017; Connolly et al., 2018). Imaging was performed with Zeiss microscope equipped with Colibri 7 LED and Axiocam 705 camera under constant acquisition conditions across all experiment, including, resolution, time-interval and -cycle. In addition, the laser power and intensity were reduced to 5% to avoid photobleaching. Changes in TMRM fluorescence intensity were determined using 40x oil immersion objective following excitation and emission at 548 nm and 573 nm, respectively. About five to ten transfected cells per image were analyzed using Fiji Image J software to determine the ΔΨm. Background fluorescence was subtracted and ΔΨm was expressed as the ratio between the baseline fluorescence intensity and change in fluorescence intensity after stimuli (Fo/Fo-F1). Fo is the mean baseline fluorescence intensity while F1 is the mean fluorescence intensity upon exposure to stressor (Santos et al., 2005; Quintanilla et al., 2013). Data were normalized with the total number of mitochondria per cell.
ATP levels were measured using an ATP determination Kit (Invitrogen, #A22066) and read on a Glomax Luminometer (Promega). Briefly, cells were grown in 24-well plates at a seeding density of 2 × 10⁴ cells/ml. Cells were collected 48 h post-transfection in lysis buffer containing 100 mM Tris-HCl, 4 mM EDTA, 0.1% Triton X-100, and protease inhibitor. Thereafter, the cells were sonicated and centrifuged to remove cell debris. Standards curve of known ATP concentration (0.031 – 2 µM) was generated and used to calibrate ATP concentration in samples. Data obtained were normalized to protein concentration measured using BCA assay.
Effect of phosphomimetic tau on ROS production
ROS generation was monitored using AmplexUltra-Red-HRP-hydrogen peroxide (H2O2) detection system. Briefly, cells were plated at 5 × 10⁴ cells per well in 48-well plates and were transfected accordingly at 50–60% confluent. Forty-eight hours post-transfection, the cells were gently washed with PBS-glucose buffer and permeabilized for 2 min with 5 µg/ml saponin in PBS-glucose buffer. Thereafter, the cells were incubated with 5 U/ml HRP and substrate (5 mM succinate or 5 mM malate plus 2 mM glutamate) for 5 min followed by addition of Amplex-UltraRed (50 μM final well concentration) for a 200 μl final assay volume. In this reaction, HRP catalyzes H2O2-oxidation of AmplexUltra-Red to resorufin-like AmplexUltrox-Red that emits fluorescence at 590 nm upon excitation at 530 nm. We measured kinetic data for 30 min at 90 s intervals with Multi-mode microplate reader (Biotech Synergy LX, 22011326). For each experiment, standard curve generated with freshly prepared H2O2 (0 – 5 μM) was used to calibrate fluorescence intensity to pmoles units of H2O2. We subtracted background fluorescence measured in wells containing PBS-glucose only. To assess the effect of stressors on ROS production, the cells were incubated with rotenone (1 μM) or thapsigargin (1 μM) for 10 min prior energization with substrates.
Statistics
Statistics were performed with GraphPad Prism 9 (GraphPad Software, Inc.) and analysis were carried out using one-way analysis of variance (ANOVA) followed by Tukey’s post hoc test. No test for outliers was conducted and no data was excluded. Normal distribution was tested using Kolmogorov-Smirnov tests. Data are expressed as means ± SEM and statistical differences were expressed as p < 0.05 *, p < 0.005 **, p < 0.001 ***, p < 0.0001 ****.
Results
Expression of phosphomimetic tau altered mitochondrial distribution and abundance
Prior to initiating our studies, we first confirmed that all the tau constructs were expressed at equivalent levels. The immunoblot in Fig. 2A shows that all the GFP-tagged tau constructs expressed at similar levels in HT22 cells. The slight differences in electrophoretic mobility of 2EC and 2EM protein compared with T4 correlate with the modifications at the respective Ser/Thr sites (Ding et al., 2006).
Fig. 2. Tau expression and effect of phosphomimetic tau on mitochondrial distribution and abundance.


(A) Representative immunoblot for total tau in cell lysates (20 µg protein). GFP-tagged wild-type tau (T4) and phosphomimetic tau (2EC and 2EM) are equivalently expressed in HT22 cells. The empty vector (EV) lane indicates the absence or very low levels of endogenous tau in HT22 cells. The cell lysates were probed with rabbit anti-tau antibody and GAPDH was used as loading control. HT22 cells were co-transfected with mitochondrial targeted mCherry and EV or the indicated GFP-tau constructs prior to fixation and imaging. Representative images of merged, mito-mCherry mitochondria-puncta and GFP showing shorter cell projections in cells expressing 2EC and 2EM. Scale bar is 20 µm (B). The total number of mitochondria per cell (C), % of total mitochondria in the projections (D) and soma (E) were normalized to fluorescence intensity. Quantification was performed on twenty cells from four independent cell culture preparations. Data analysis was by one-way ANOVA followed by Tukey’s multiple-comparisons test and presented as mean ± SEM. p < 0.05 *. (C) F(3,76) = 1.340, p = 0.2676. (D) F(3,76) = 9.726, p = 0.0314. (E) F(3,76) = 10.05, p = 0.0242.
Neuronal cells depend on appropriate mitochondrial distribution to maintain function and neural connections. Aberrant distribution alters synaptic activities while inadequate neuronal-mitochondrial populations contribute to neuronal damage observed in AD (Harerimana et al., 2022). To determine if the presence of abnormally phosphorylated tau could impact mitochondrial distribution and population, cells were transfected with mito-mCherry and GFP tagged-T4 or the different phosphomimetic forms of tau. Fig. 2B shows that cells expressing phosphomimetic tau appear to have shorter projections compared to T4 and EV, with a significant accumulation of mitochondria in the soma. Although the total number of mitochondria was not significantly different (Fig. 2C), there was a significant reduction in percent of total mitochondria in the projections in cells expressing 2EC compared to T4 (Fig. 2D,E).
Impact of phosphomimetic tau on mitochondrial membrane potential (Ψm)
Ψm is a common measure of mitochondrial function and reflects the charge or electrical component of the proton motive force that drives oxidative phosphorylation. Hence, we asked if phosphorylated tau impacts Ψm in the presence and absence of stressors. Notably, we aimed to determine mitochondrial responses to stressors at a point when cell death between the groups was not a confounding factor. Our preliminary findings showed no significant cell death among the groups when exposed to rotenone (1μm) or thapsigargin (1μm) for 15 or 30 min (Fig. S1A–B), thus measurements were carried out after 30 min or less of stressor exposure. Prolonged exposure (60 min) to stressors altered cell morphology and induced-cell death in a similar manner across all groups (Fig. S1C).
Treatment with the mitochondrial membrane uncoupler FCCP significantly decreased the TMRM fluorescence intensity, verifying that the fluorescence was indeed originating from the mitochondria. Quantitative representation of changes in Ψm indicates no significant difference in all tau constructs (Fig. 3A,B). Next, we examined the impact of specific stressors on ΔΨm. Rotenone suppressed Ψm, but the observed changes were not significantly different across of groups (Fig. 4A,B). However, compared to T4, inhibition of sarco/endoplasmic reticulum Ca2+ -ATPase (SERCA) with thapsigargin significantly decreased Ψm in cells expressing both 2EC and 2EM (Fig. 4C,D), suggesting that cells expressing phosphomimetic tau were more susceptible to calcium stress. Further, ATP levels in cells expressing 2EC and 2EM phosphomimetic tau were significantly reduced compared to T4 expressing cells (Fig. 5) suggesting decreased oxidative phosphorylation.
Fig. 3. Assessment of mitochondrial membrane potential in cells expressing wild type and phosphomimetic tau.

Tracings showing ΔΨm in cells expressing GFP-empty vector (EV), or T4, 2EC and 2EM, respectively. After taking the baseline TMRM fluorescence for 5 min, the cells were treated with FCCP, and the fluorescence changes were recorded for another 10 min at 1 min interval (A). The decreased TMRM fluorescence intensity upon addition of FCCP indicates reduced Ψm and that the dye signal was from the mitochondria. Quantitative representation of the baseline TMRM fluorescence intensity after 5 min normalized with mitochondrial abundance (B). Each data point represents the mean TMRM fluorescence intensity of 5 to 10 transfected cells in seven independent cell culture preparations. Data analysis was by one-way ANOVA followed by Tukey’s multiple-comparisons test. (B) F(3,24) = 6.294, p = 0.0509.
Fig. 4. Stressors reduced mitochondrial membrane potential cells expressing phosphomimetic tau.
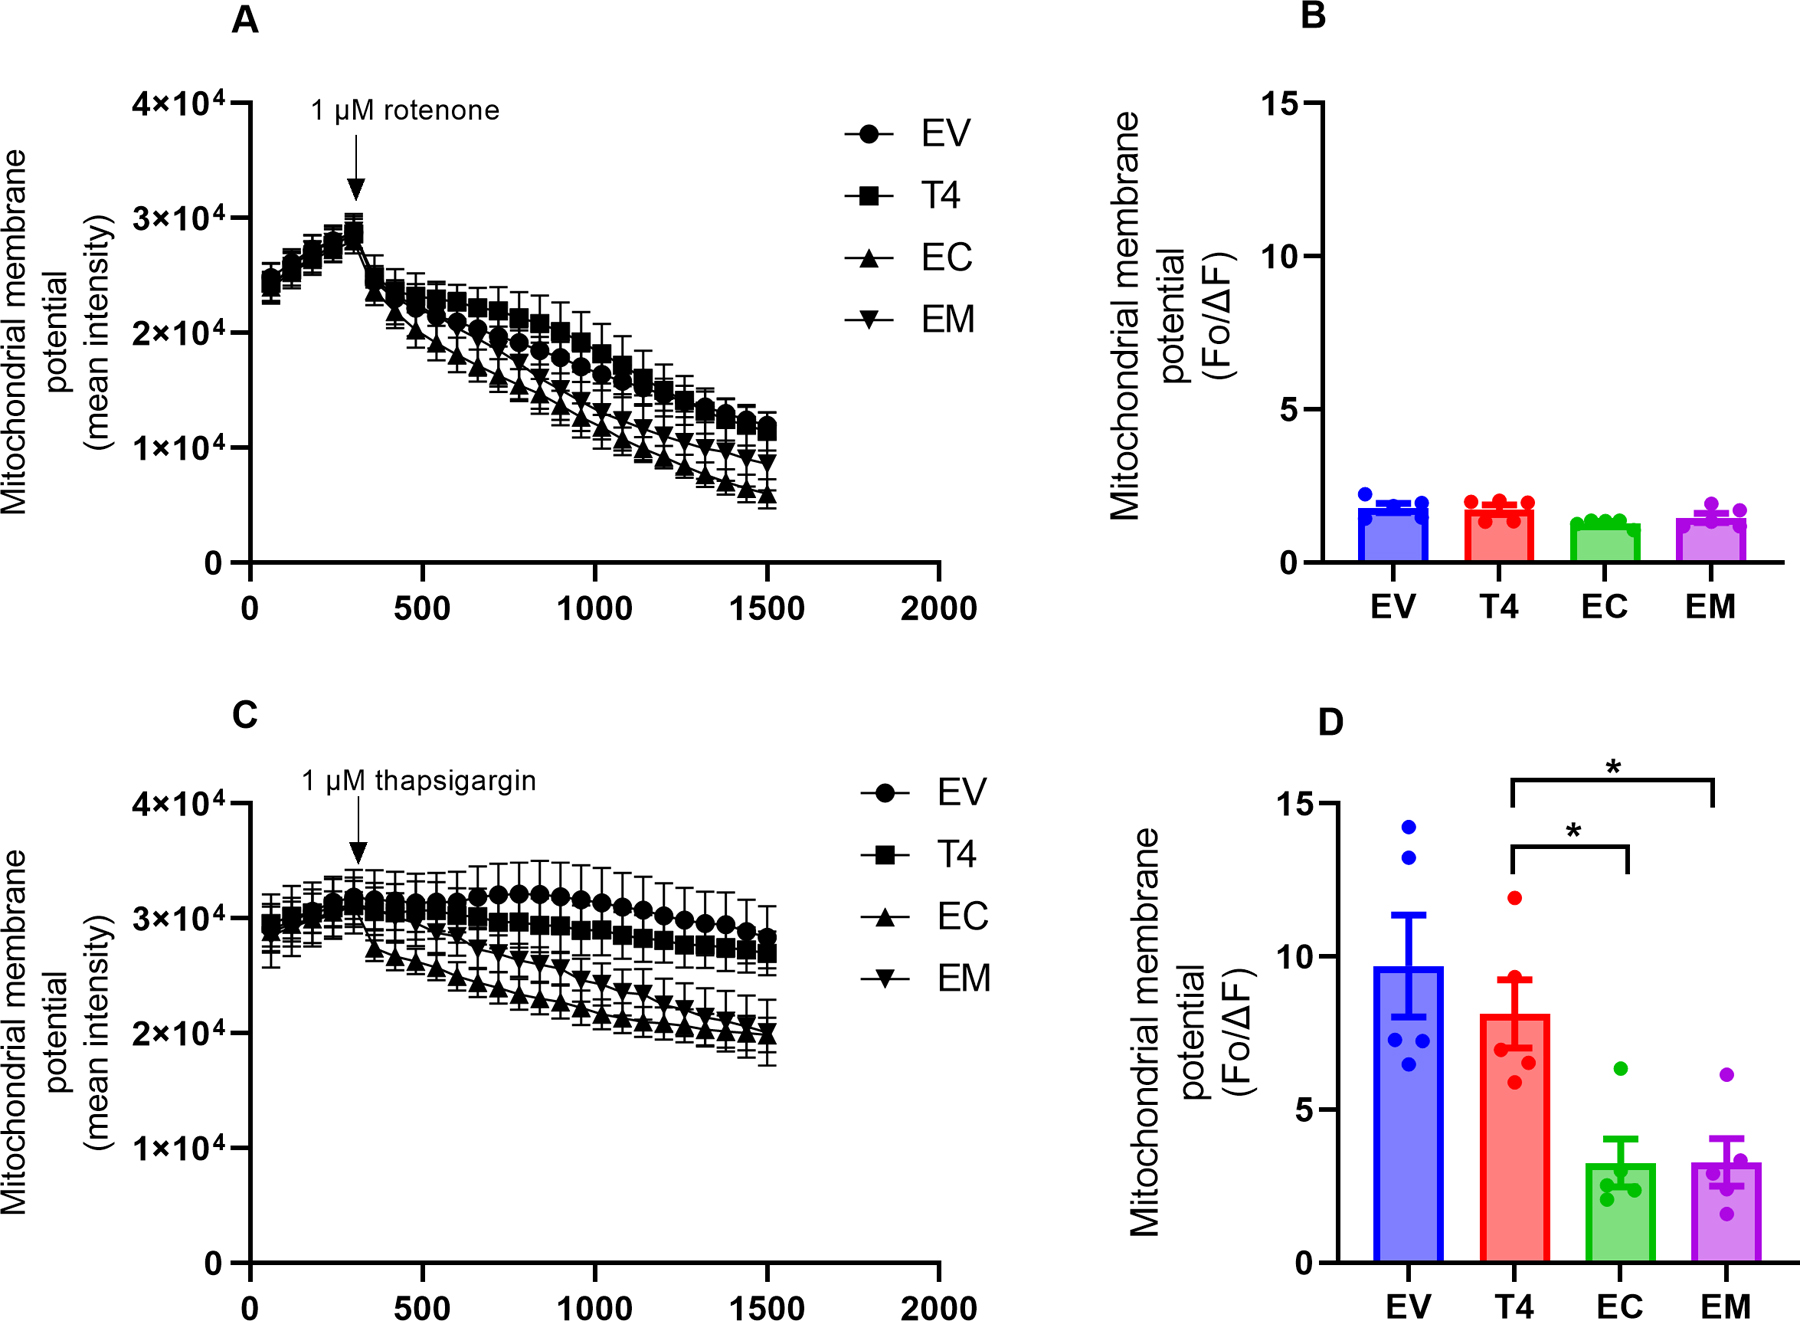
Transfected cells were treated with 1 µM rotenone or 1 µM thapsigargin, respectively, after establishing the baseline TMRM fluorescence for 5 min. Representative tracings and quantitative representation of ΔΨm, respectively, following exposure to rotenone (A,B) or thapsigargin (C,D). Changes in TMRM fluorescence intensity were recorded for 20 min at 1 min interval upon treatment with stressors. After subtracting background fluorescence, fluorescence intensities were estimated using the formula Fo/ΔF where ΔF represents changes in TMRM fluorescence intensity before treatment, while Fo is the difference after exposure to stressor. Fluorescence intensity was normalized with mitochondria abundance. Each data point represents the mean fluorescence intensity of 5 to 10 transfected cells in five independent cell culture preparations. Data analysis was by one-way ANOVA followed by Tukey’s multiple-comparisons test and presented as mean ± SEM. p < 0.05 *. (B) F(3,16) = 2, p = 0.0618. (D) F(3,16) = 8.443, p = 0.0014.
Fig. 5. Phosphomimetic tau altered ATP production.

ATP level was assessed using an ATP determination kit according to the manufacturer’s instructions. Expression of phosphomimetic tau significantly reduced ATP levels. Data analysis was by one-way ANOVA followed by Tukey’s multiple-comparisons test and presented as mean ± SEM. p < 0.005 **, p < 0.001 ****. Three independent cell culture preparations. F(3,44) = 16.10, p = 0.0001.
Phosphomimetic tau altered ROS production
Mitochondria are the primary site of ROS formation which in pathological conditions can result in oxidative stress. Because aberrantly phosphorylated tau has been suggested to increase oxidative stress and thus contribute to AD progression (Torres et al., 2021), we tested whether tau pseudophosphorylated at AD-associated sites altered ROS formation. We measured ROS production in unenergized cells, during oxidation of different metabolic substrates and upon exposure to stressors. ROS generated by unenergized mitochondria and during oxidation of malate-glutamate was not significantly different across all groups (Fig. 6A,B). However, compared to T4, ROS production increased significantly in 2EC expressing cells during oxidation of succinate (Fig. 6C). Irrespective of the tau construct, ROS production was the highest during oxidation of succinate. Therefore, we assessed the impact of rotenone or thapsigargin on ROS production during oxidation of succinate. Our data indicated that rotenone did not alter ROS generation across all groups (Fig. 6D). In contrast, thapsigargin significantly increased ROS generation in all groups (Fig. 6E). Calculating the difference between stressed and unstressed states (Fig. 6F,G) showed that ROS generation in the presence of thapsigargin was significantly greater in 2EC and 2EM-expressing cells compared to T4 (Fig. 6G).
Fig. 6. Effect of phosphomimetic tau on ROS generation.

ROS production by unenergized mitochondria (A) and during oxidation of 5 µM malate-2 µM glutamate (B), or 5 µM succinate (C). Changes in ROS generation by mitochondria oxidizing succinate following exposure to rotenone (D,F) or thapsigargin (E,G). Data in F and G represent the difference in ROS generation between the unstressed state (C), and after treatment with rotenone (F) or thapsigargin (G). Data analysis was by unpaired Student’s t-test and one-way ANOVA followed by Tukey’s multiple-comparisons test and presented as mean ± SEM. p < 0.05 *, p < 0.001 **, p < 0.001 ****. Three independent cell culture preparations. (A) F(3,12) = 0.2871, p = 0.8338. (B) F(3,40) = 0.9321, p = 0.4341. (C) F(3,36) = , p = 0.0031. (D) t[10] = 1.437, p = 0.1814; t[10] = 2.083, p = 0.0639; t[10] = 1.435, p = 0.1819; t[10] = 0.9861, p = 0.3474. (E) t[10] = 5.174, p = 0.0001; t[10] = 5.739, p = 0.002; t[10] = 8.688, p < 0.0001; t[10] = 12.16, p < 0.0001. (F) F(3,20) = 3, p = 0.0416. (G) F(3,20) = 13.58, p < 0.0001.
Discussion
Previous reports have demonstrated that phosphorylated tau induces neuronal damage by disrupting microtubule assembly and stabilization (Johnson and Stoothoff, 2004; Iqbal et al., 2008; Di et al., 2015). However, emerging evidence suggests that the damage caused by phosphorylated tau may transcend microtubule-associated effects, due to its interaction with other cellular components, including the mitochondria (Szabo et al., 2020; Tracy et al., 2022). Since healthy mitochondria are essential for neuronal survival, understanding the impact of pathogenic forms of tau on mitochondrial functions has become a key area of focus in AD pathology. Our data demonstrate that tau pseudophosphorylated at AD-associated sites alters mitochondrial functional parameters, with the magnitude of the impact depending on the sites where tau is phosphorylated. Our findings extend understanding of how phosphorylated tau causes mitochondrial dysfunction and support the possible mechanistic rationale for mitochondrial-oriented therapies in AD.
We have demonstrated that phosphorylated tau impairs mitochondrial distribution. Our finding is consistent with previous reports in PC12 cells expressing phosphomimetics tau at Ser-202 and Thr-205 (Shahpasand et al., 2012) and in P301L tau knock-in mouse neurons (Rodríguez-Martín et al., 2016). Specifically, a higher percentage of mitochondria puncta accumulated in the soma, in a manner similar to findings in cellular and mouse models of AD (Biernat and Mandelkow, 1999; Kopeikina et al., 2011; Shahpasand et al., 2012). Mitochondrial accumulation in the soma and corresponding decrease in neurite-like extensions may be attributed to the defective neurite outgrowth we observed in cells expressing phosphomimetic tau. We observed identical results when the cells were stained for tubulin (Fig. S2). Indeed, 2EC and 2EM mutations impair microtubule assembly and stabilization that is essential for neurite growth (Johnson and Stoothoff, 2004; Ding et al., 2006) thereby disrupting mitochondria transport and resulting in accumulation in the soma. Impaired mitochondria transport and accumulation in neuronal soma are important arbiters of synaptic dysfunction in AD (Wang et al., 2015; Cheng and Bai, 2018). Of note, a significantly greater percentage of total mitochondria puncta binned at 5 – 10 µm2 were found in cells expressing 2EC compared with T4 (Fig. S3C), suggesting an impairment in mitochondria dynamics (Szabo et al., 2020). Further investigation is needed to probe the mechanism by which tau phosphorylation affects mitochondrial dynamics and evaluate the potential implications for neurodegenerative diseases such as AD.
Our immunoblot analysis indicates that GFP-tau expression in the mitochondrial fraction from cells expressing T4 was more prominent relative to the phosphomimetic tau, suggesting that the 2EC and 2EM mutations reduce the presence of tau in mitochondria (Fig. S4). Our finding is consistent with reports in human neurons where wild-type tau interacts more strongly with mitochondrial proteins than mutated tau (Tracy et al., 2022), and the reduced interaction consequently correlated with impaired mitochondria bioenergetics. This evidence indicates that the 2EC and 2EM mutations may significantly impact on the interaction between tau and specific mitochondrial proteins, potentially disrupting the yet undefined physiological roles of tau in the mitochondria. In physiological state, neuronal energy supply is achieved largely by effective mitochondrial bioenergetics, which include metabolic substrate catabolism, electron transfer along the mitochondrial electron transport system (mETS), and generation of Ψm. Ψm is crucial for ATP synthesis via oxidative phosphorylation, and its assessment can be used as a proxy to reflect mitochondrial energetic state in AD (Eckert et al., 2014; Pérez et al., 2018; Szabo et al., 2020). Basal Ψm was not different across all tau constructs when normalized with mitochondria abundance, suggesting that phosphorylated tau does not significantly influence mechanisms involved in regulating Ψm in the absence of stressors. However, ATP levels were reduced in cells expressing 2EC and 2EM, indicating that phosphomimetic tau might impair oxidative phosphorylation. Our findings underscore studies in human neuroblastoma (SH-SY5Y) cells and transgenic mice expressing P301L tau (David et al., 2005; Schulz et al., 2012) and a report (Torres et al., 2022) that phosphorylated tau accumulates in synaptic mitochondria resulting in decreased ATP production. Interestingly, Drummond et al. (2020) and Torres et al. (2021, 2022) provided data indicating that tau phosphorylated at Ser-396/404 (2EC) interacts with the β and O subunit (ATP5B and ATP5O) of complex V, which has been associated with impaired mitochondrial bioenergetics, including decreased ATP synthesis (Rhein et al., 2009; Torres et al., 2022). While state 2 and state 3 respiration did not vary significantly across all groups (Fig. S5A), phosphomimetic-tau tended to decrease respiratory control ratio (RCR, Fig. S5B). This suggests a potential disruption in the integrity of the mETS, leading to a reduced ability of the cells expressing phosphomimetic tau to generate ATP (Fig. 5).
High oxygen consumption rate predisposes the brain to elevated ROS production (Cobley et al., 2018), and ROS generation in AD brain can be intensified by the presence of hyperphosphorylated tau (Rhein et al., 2009; Eckert et al., 2014). ROS emission during oxidation of succinate increased in cells expressing phosphomimetic tau compared to T4. Succinate oxidation stimulates ROS generation from complex III through forward electron transfer and/or by reverse electron transport (RET) to complex I which is sensitive to inhibition by rotenone (Brand, 2016). We found that ROS generation was insensitive to rotenone suggesting the absence of RET in HT22 cells and that phosphomimetic tau plausibly stimulates ROS production at sites downstream of complex I. Increased ROS production likely results from accumulation of defective mitochondria, which could be due in part to phosphorylated tau-induced defective mitophagy (Reddy and Oliver, 2019; Guha et al., 2020).
Intracellular calcium plays fundamental regulatory and signaling roles in neuronal functions and its concentration is tightly regulated by the endoplasmic reticulum (ER) and mitochondria (Bagur and Hajnóczky, 2017). Disturbances in calcium homeostasis have been linked to tau-mediated toxicity in AD (Berridge, 2013; Palikaras et al., 2021). Thapsigargin, a classical ER-calcium stressor, precipitates intracellular calcium overload by blocking SERCA-mediated calcium transport from the cytoplasm into the ER (Sehgal et al., 2017). Thapsigargin-induced ER-calcium stress decreased Ψm and increased ROS generation substantially in cells expressing 2EC and 2EM consistent with our previous findings in immortalized cortical neurons expressing Asp-421-truncated tau (Quintanilla et al., 2009) and immortalized striatal progenitor cells expressing mutant huntingtin (STHdhQ111/Q111) (Quintanilla et al., 2013). Coupled with calcium overload, exposure to thapsigargin plausibly stimulated ROS production by decreasing mETS activity. Indeed, exogenous ADP suppressed thapsigargin-induced ROS generation marginally (Fig. S6). This trend is not surprising because the addition of ADP facilitates electron transfer along the mETS, thereby decreasing electron leakage for ROS formation (Chen and Zweier, 2014). Altogether, our findings provide evidence that tau phosphorylated at specific AD-relevant sites impairs cellular response to calcium stress and that ER stress-induced calcium dysregulation may be a key mechanism of phosphorylated tau-mediated neurodegeneration in AD.
Even with extensive research effort, there is no detailed understanding of the specific cellular changes that link abnormally phosphorylated tau with the progression of AD. In this study, we demonstrated that tau phosphorylated at AD-relevant sites precipitate several indicators of mitochondrial dysfunction reported in human AD patients, including impaired stress response, decreased ATP levels, and increased oxidative stress. Our results support the association between aberrantly phosphorylated tau and defective mitochondria in the pathogenesis of AD (Szabo et al., 2020; Torres et al., 2022). Our findings suggest that changes in mitochondria function can be used to integrate the mechanism of toxicity of different AD-relevant tau phosphorylation species. Additionally, our observations are based on a tau overexpression model, leaving open the possibility that in physiological or low expression levels, tau may impose a different, yet undetermined mitochondria effect. Further research is needed to determine the likelihood of a synergistic adverse effect of abnormal tau phosphorylation and mitochondria dysfunction in the progression of AD.
Supplementary Material
Acknowledgements:
We would like to thank Jacen Emerson for his assistance, and Dr. P.H Reddy for his generous gift of HT22 cells. This work was supported by the National Institutes of Health (NIH) R01 AG067617.
Abbreviations
- 2EC
GFP tagged-Ser-396/404
- 2EM
GFP tagged-Thr-231/Ser-235
- 2N4R
two N-terminal and four repeat domains
- AD
Alzheimer’s disease
- ANOVA
analysis of variance
- ATP
adenosine triphosphate
- BCA
bicinchoninic acid
- CO2
carbon dioxide
- EDTA
ethylenediamine tetraacetic acid
- ER
endoplasmic reticulum
- EV
empty vector
- FCII
fetal clone II
- FCCP
carbonyl cyanide 4- (trifluoromethoxy) phenylhydrazone
- GAPDH
glyceraldehyde-3-phosphate dehydrogenase
- GFP
green fluorescent protein
- HRP
horseradish peroxidase
- HT22 cells
Immortalized mouse hippocampal neuronal cell line
- mETS
mitochondrial electron transport system
- PBS
phosphate buffer saline
- PC12 cells
Immortalized rat adrenal phaeochromocytoma cell line
- PDL
poly-d-lysine
- RET
reverse electron transport
- RIPA
radioimmunoprecipitation assay
- ROS
reactive oxygen species
- SDS
sodium dodecyl sulfate
- SDS-PAGE
gel sodium dodecyl sulfate–polyacrylamide gel
- Ser
Serine
- SERCA
sarco/endoplasmic reticulum Ca2+-ATPase
- SH-SY5Y cells
human neuroblastoma cell line
- T4
GFP tagged-tau
- Thr
threonine
- TMRM
Tetramethylrhodamine methyl ester
- Tyr
tyrosine
- Ψm
mitochondrial membrane potential
Footnotes
Disclosure statement: The authors have no potential conflict of interest.
References
- Abraha A, Ghoshal N, Gamblin TC, Cryns V, Berry RW, Kuret J, & Binder LI (2000). C-terminal inhibition of tau assembly in vitro and in Alzheimer’s disease. Journal of cell science, 113 Pt 21, 3737–3745. [DOI] [PubMed] [Google Scholar]
- Alonso AD, Di Clerico J, Li B, Corbo CP, Alaniz ME, Grundke-Iqbal I, & Iqbal K (2010). Phosphorylation of tau at Thr212, Thr231, and Ser262 combined causes neurodegeneration. The Journal of biological chemistry, 285(40), 30851–30860. [DOI] [PMC free article] [PubMed] [Google Scholar]
- Bagur R, & Hajnóczky G (2017). Intracellular Ca2+ Sensing: Its Role in Calcium Homeostasis and Signaling. Molecular cell, 66(6), 780–788. [DOI] [PMC free article] [PubMed] [Google Scholar]
- Berridge MJ (2013). Dysregulation of neural calcium signaling in Alzheimer disease, bipolar disorder and schizophrenia. Prion, 7(1), 2–13. [DOI] [PMC free article] [PubMed] [Google Scholar]
- Biernat J, & Mandelkow EM (1999). The development of cell processes induced by tau protein requires phosphorylation of serine 262 and 356 in the repeat domain and is inhibited by phosphorylation in the proline-rich domains. Molecular biology of the cell, 10(3), 727–740. [DOI] [PMC free article] [PubMed] [Google Scholar]
- Brand MD (2016). Mitochondrial generation of superoxide and hydrogen peroxide as the source of mitochondrial redox signaling. Free radical biology & medicine, 100, 14–31. [DOI] [PubMed] [Google Scholar]
- Cheng Y, Bai F (2018). The association of tau with mitochondrial dysfunction in Alzheimer’s disease. Frontiers in neuroscience, 12, 163. [DOI] [PMC free article] [PubMed] [Google Scholar]
- Chen YR, & Zweier JL (2014). Cardiac mitochondria and reactive oxygen species generation. Circulation research, 114, 524–537. [DOI] [PMC free article] [PubMed] [Google Scholar]
- Cobley JN, Fiorello ML, & Bailey DM (2018). 13 reasons why the brain is susceptible to oxidative stress. Redox biology, 15, 490–503. [DOI] [PMC free article] [PubMed] [Google Scholar]
- Connolly N, Theurey P, Adam-Vizi V, Bazan NG, Bernardi P, Bolaños JP, Culmsee C, Dawson VL, Deshmukh M, Duchen MR, Düssmann H, Fiskum G, Galindo MF, Hardingham GE, Hardwick JM, Jekabsons MB, Jonas EA, Jordán J, Lipton SA, Manfredi G, …Prehn J (2018). Guidelines on experimental methods to assess mitochondrial dysfunction in cellular models of neurodegenerative diseases. Cell death and differentiation, 25(3), 542–572. [DOI] [PMC free article] [PubMed] [Google Scholar]
- David DC, Hauptmann S, Scherping I, Schuessel K, Keil U, Rizzu P, Ravid R, Dröse S, Brandt U, Müller WE, Eckert A, & Götz J (2005). Proteomic and functional analyses reveal a mitochondrial dysfunction in P301L tau transgenic mice. The Journal of biological chemistry, 280(25), 23802–23814. [DOI] [PubMed] [Google Scholar]
- Debattisti V, Gerencser AA, Saotome M, Das S, & Hajnóczky G (2017). ROS Control Mitochondrial Motility through p38 and the Motor Adaptor Miro/Trak. Cell reports, 21(6), 1667–1680. [DOI] [PMC free article] [PubMed] [Google Scholar]
- Di Xia. Li C; Götz J (2015). Pseudophosphorylation of Tau at distinct epitopes or the presence of the P301L mutation targets the microtubule-associated protein Tau to dendritic spines. BBA Mol of Dis, 2015, 1852(5), 913–924. [DOI] [PubMed] [Google Scholar]
- Ding H, Matthews TA, & Johnson GV (2006). Site-specific phosphorylation and caspase cleavage differentially impact tau-microtubule interactions and tau aggregation. The Journal of Biological Chemistry, 281(28), 19107–19114. [DOI] [PubMed] [Google Scholar]
- Drummond E, Pires G, MacMurray C, Askenazi M, Nayak S, Bourdon M, Safar J, Ueberheide B, & Wisniewski T (2020). Phosphorylated tau interactome in the human Alzheimer’s disease brain. Brain: a journal of neurology, 143(9), 2803–2817. [DOI] [PMC free article] [PubMed] [Google Scholar]
- Eckert A, Nisbet R, Grimm A, & Götz J (2014). March separate, strike together--role of phosphorylated TAU in mitochondrial dysfunction in Alzheimer’s disease. Biochimica et biophysica acta, 1842(8), 1258–1266. [DOI] [PubMed] [Google Scholar]
- Grimm A, & Eckert A (2017). Brain aging and neurodegeneration: from a mitochondrial point of view. Journal of neurochemistry, 143(4), 418–431. [DOI] [PMC free article] [PubMed] [Google Scholar]
- Guha S, Fischer S, Johnson GVW and Nehrke K (2020). Tauopathy-associated tau modifications selectively impact neurodegeneration and mitophagy in a novel C. elegans single-copy transgenic model. Mol. Neurodegener 15, 65. 7. [DOI] [PMC free article] [PubMed] [Google Scholar]
- Harerimana NV, Paliwali D, Romero-Molina C, Bennett DA, Pa J, Goate A, Swerdlow RH, & Andrews SJ (2022). The role of mitochondrial genome abundance in Alzheimer’s disease. Alzheimer’s & dementia: the journal of the Alzheimer’s Association, 10.1002/alz.12812. Advance online publication. [DOI] [PubMed] [Google Scholar]
- Iqbal K, Alonso ADC, & Grundke-Iqbal I (2008). Cytosolic abnormally hyperphosphorylated tau but not paired helical filaments sequester normal MAPs and inhibit microtubule assembly. Journal of Alzheimer’s disease, 14(4), 365–370. [DOI] [PMC free article] [PubMed] [Google Scholar]
- Ittner LM, Fath T, Ke YD, Bi M, van Eersel J, Li KM, Gunning P, & Götz J (2008). Parkinsonism and impaired axonal transport in a mouse model of frontotemporal dementia. Proceedings of the National Academy of Sciences of the United States of America, 105(41), 15997–16002. [DOI] [PMC free article] [PubMed] [Google Scholar]
- Johnson GV, & Stoothoff WH (2004). Tau phosphorylation in neuronal cell function and dysfunction. Journal of cell science, 117(Pt 24), 5721–5729. [DOI] [PubMed] [Google Scholar]
- Kimura T, Sharma G, Ishiguro K, & Hisanaga SI (2018). Phospho-Tau Bar Code: Analysis of Phosphoisotypes of Tau and Its Application to Tauopathy. Frontiers in neuroscience, 12, 44. [DOI] [PMC free article] [PubMed] [Google Scholar]
- Kopeikina KJ, Carlson GA, Pitstick R, Ludvigson AE, Peters A, Luebke JI, Koffie RM, Frosch MP, Hyman BT, & Spires-Jones TL (2011). Tau accumulation causes mitochondrial distribution deficits in neurons in a mouse model of tauopathy and in human Alzheimer’s disease brain. The American journal of pathology, 179(4), 2071–2082. [DOI] [PMC free article] [PubMed] [Google Scholar]
- Mondragón-Rodríguez S, Perry G, Luna-Muñoz J, Acevedo-Aquino MC, & Williams S (2014). Phosphorylation of tau protein at sites Ser (396–404) is one of the earliest events in Alzheimer’s disease and Down syndrome. Neuropathology and applied neurobiology, 40(2), 121–135. [DOI] [PubMed] [Google Scholar]
- Neddens J, Temmel M, Flunkert S, Kerschbaumer B, Hoeller C, Loeffler T, & Hutter-Paier B (2018). Phosphorylation of different tau sites during progression of Alzheimer’s disease. Acta neuropathologica communications, 6(1), 1–15. [DOI] [PMC free article] [PubMed] [Google Scholar]
- Palikaras K, Achanta K, Choi S, Akbari M, & Bohr VA (2021). Alteration of mitochondrial homeostasis is an early event in a C. elegans model of human tauopathy. Aging, 13(21), 23876–23894. [DOI] [PMC free article] [PubMed] [Google Scholar]
- Paterno G, Bell BM, Gorion KM, Prokop S, & Giasson BI (2022). Reassessment of Neuronal Tau Distribution in Adult Human Brain and Implications for Tau Pathobiology. Acta neuropathologica communications, 10(1), 94. [DOI] [PMC free article] [PubMed] [Google Scholar]
- Pérez MJ, Jara C, & Quintanilla RA (2018). Contribution of Tau Pathology to Mitochondrial Impairment in Neurodegeneration. Frontiers in neuroscience, 12, 441. [DOI] [PMC free article] [PubMed] [Google Scholar]
- Quintanilla RA, Matthews-Roberson TA, Dolan PJ, & Johnson GV (2009). Caspase-cleaved tau expression induces mitochondrial dysfunction in immortalized cortical neurons: implications for the pathogenesis of Alzheimer disease. The Journal of biological chemistry, 284(28), 18754–18766. [DOI] [PMC free article] [PubMed] [Google Scholar]
- Quintanilla RA, Jin YN, von Bernhardi R, & Johnson GV (2013). Mitochondrial permeability transition pore induces mitochondria injury in Huntington disease. Molecular neurodegeneration, 8, 45. [DOI] [PMC free article] [PubMed] [Google Scholar]
- Quintanilla RA, von Bernhardi R, Godoy JA, Inestrosa NC, & Johnson GV (2014). Phosphorylated tau potentiates Aβ-induced mitochondrial damage in mature neurons. Neurobiology of disease, 71, 260–269. [DOI] [PubMed] [Google Scholar]
- Quintanilla RA, Tapia-Monsalves C, Vergara EH, Pérez MJ, & Aranguiz A (2020). Truncated Tau Induces Mitochondrial Transport Failure Through the Impairment of TRAK2 Protein and Bioenergetics Decline in Neuronal Cells. Frontiers in cellular neuroscience, 14, 175. [DOI] [PMC free article] [PubMed] [Google Scholar]
- Reddy PH (2011). Abnormal tau, mitochondrial dysfunction, impaired axonal transport of mitochondria, and synaptic deprivation in Alzheimer’s disease. Brain research, 1415, 136–148. [DOI] [PMC free article] [PubMed] [Google Scholar]
- Reddy PH, & Oliver DM (2019). Amyloid Beta and Phosphorylated Tau-Induced Defective Autophagy and Mitophagy in Alzheimer’s Disease. Cells, 8(5), 488. [DOI] [PMC free article] [PubMed] [Google Scholar]
- Rhein V, Song X, Wiesner A, Ittner LM, Baysang G, Meier F, Ozmen L, Bluethmann H, Dröse S, Brandt U, Savaskan E, Czech C, Götz J, & Eckert A (2009). Amyloid-beta and tau synergistically impair the oxidative phosphorylation system in triple transgenic Alzheimer’s disease mice. Proceedings of the National Academy of Sciences of the United States of America, 106(47), 20057–20062. [DOI] [PMC free article] [PubMed] [Google Scholar]
- Rodríguez-Martín T, Pooler AM, Lau DHW, Mórotz GM, De Vos KJ, Gilley J, Coleman MP, & Hanger DP (2016). Reduced number of axonal mitochondria and tau hypophosphorylation in mouse P301L tau knockin neurons. Neurobiology of disease, 85, 1–10. [DOI] [PMC free article] [PubMed] [Google Scholar]
- Santos MJ, Quintanilla RA, Toro A, Grandy R, Dinamarca MC, Godoy JA, & Inestrosa NC (2005). Peroxisomal proliferation protects from beta-amyloid neurodegeneration. The Journal of biological chemistry, 280(49), 41057–41068. [DOI] [PubMed] [Google Scholar]
- Schulz KL, Eckert A, Rhein V, Mai S, Haase W, Reichert AS, Jendrach M, Müller WE, & Leuner K (2012). A new link to mitochondrial impairment in tauopathies. Molecular neurobiology, 46(1), 205–216. [DOI] [PubMed] [Google Scholar]
- Sehgal P, Szalai P, Olesen C, Praetorius HA, Nissen P, Christensen SB, Engedal N, & Møller JV (2017). Inhibition of the sarco/endoplasmic reticulum (ER) Ca2+-ATPase by thapsigargin analogs induces cell death via ER Ca2+ depletion and the unfolded protein response. The Journal of biological chemistry, 292(48), 19656–19673. [DOI] [PMC free article] [PubMed] [Google Scholar]
- Shahpasand K, Uemura I, Saito T, Asano T, Hata K, Shibata K, Toyoshima Y, Hasegawa M, & Hisanaga S (2012). Regulation of mitochondrial transport and inter-microtubule spacing b tau phosphorylation at the sites hyperphosphorylated in Alzheimer’s disease. The Journal of neuroscience: the official journal of the Society for Neuroscience, 32(7), 2430–2441. [DOI] [PMC free article] [PubMed] [Google Scholar]
- Stefanoska K, Gajwani M, Tan ARP, Ahel HI, Asih PR, Volkerling A, Poljak A, & Ittner A (2022). Alzheimer’s disease: Ablating single master site abolishes tau hyperphosphorylation. Science advances, 8(27), eabl8809. [DOI] [PMC free article] [PubMed] [Google Scholar]
- Szabo L, Eckert A, & Grimm A (2020). Insights into Disease-Associated Tau Impact on Mitochondria. International journal of molecular sciences, 21(17), 6344. [DOI] [PMC free article] [PubMed] [Google Scholar]
- Torres AK, Jara C, Olesen MA, & Tapia-Rojas C (2021). Pathologically phosphorylated tau at S396/404 (PHF-1) is accumulated inside of hippocampal synaptic mitochondria of aged Wild-type mice. Scientific reports, 11(1), 4448. [DOI] [PMC free article] [PubMed] [Google Scholar]
- Torres AK, Rivera BI, Polanco CM, Jara C, & Tapia-Rojas C (2022). Phosphorylated tau as a toxic agent in synaptic mitochondria: implications in aging and Alzheimer’s disease. Neural regeneration research, 17(8), 1645–1651. [DOI] [PMC free article] [PubMed] [Google Scholar]
- Tracy TE, Madero-Pérez J, Swaney DL, Chang TS, Moritz M, Konrad C, Ward ME, Stevenson E, Hüttenhain R, Kauwe G, Mercedes M, Sweetland-Martin L, Chen X, Mok SA, Wong MY, Telpoukhovskaia M, Min SW, Wang C, Sohn PD, Martin J, … Gan L (2022). Tau interactome maps synaptic and mitochondrial processes associated with neurodegeneration. Cell, 185(4), 712–728.e14. [DOI] [PMC free article] [PubMed] [Google Scholar]
- Tracy TE, Sohn PD, Minami SS, Wang C, Min SW, Li Y, Zhou Y, Le D, Lo I,Ponnusamy R (2016). Acetylated Tau Obstructs KIBRA-Mediated Signaling in SynapticPlasticity and Promotes Tauopathy-Related Memory Loss. Neuron 90, 245–260. [DOI] [PMC free article] [PubMed] [Google Scholar]
- Trease AJ, George JW, Roland NJ, Lichter EZ, Emanuel K, Totusek S, Fox HS, & Stauch KL (2022). Hyperphosphorylated Human Tau Accumulates at the Synapse, Localizing on Synaptic Mitochondrial Outer Membranes and Disrupting Respiration in a Mouse Model of Tauopathy. Frontiers in molecular neuroscience, 15, 852368. [DOI] [PMC free article] [PubMed] [Google Scholar]
- Wang ZX, Tan L, & Yu JT (2015). Axonal transport defects in Alzheimer’s disease. Molecular neurobiology, 51(3), 1309–1321. [DOI] [PubMed] [Google Scholar]
- Wegmann S, Biernat J, & Mandelkow E (2021). A current view on Tau protein phosphorylation in Alzheimer’s disease. Current opinion in neurobiology, 69, 131–138. [DOI] [PubMed] [Google Scholar]
- Weingarten MD, Lockwood AH, Hwo SY, Kirschner MW. (1975). A protein factor essential for microtubule assembly. Proc Natl Acad Sci U S A 72:1858–1862. [DOI] [PMC free article] [PubMed] [Google Scholar]
- Wesseling H, Mair W, Kumar M, Schlaffner CN, Tang S, Beerepoot P, & Steen JA (2020). Tau PTM profiles identify patient heterogeneity and stages of Alzheimer’s disease. Cell, 183(6), 1699–1713. [DOI] [PMC free article] [PubMed] [Google Scholar]
- Xia Y, Prokop S, & Giasson BI (2021). “Don’t Phos Over Tau”: recent developments in clinical biomarkers and therapies targeting tau phosphorylation in Alzheimer’s disease and other tauopathies. Molecular neurodegeneration, 16(1), 37. [DOI] [PMC free article] [PubMed] [Google Scholar]
- Zheng J, Akbari M, Schirmer C, Reynaert ML, Loyens A, Lefebvre B, Buée L, Croteau DL, Galas MC, & Bohr VA (2020). Hippocampal tau oligomerization early in tau pathology coincides with a transient alteration of mitochondrial homeostasis and DNA repair in a mouse model of tauopathy. Acta neuropathologica communications, 8(1), 25. [DOI] [PMC free article] [PubMed] [Google Scholar]
Associated Data
This section collects any data citations, data availability statements, or supplementary materials included in this article.