

Abstract
Glaucoma is a blinding disease characterized by the degeneration of the retinal ganglion cell (RGC) axons at the optic nerve head (ONH). A major risk factor for glaucoma is the intraocular pressure (IOP). However, it is currently impossible to measure the IOP-induced mechanical response of the axons of the ONH. The objective of this study was to develop a computational modeling method to estimate the IOP-induced strains and stresses in the axonal compartments in the mouse astrocytic lamina (AL) of the ONH, and to investigate the effect of the structural features on the mechanical behavior. We developed experimentally-informed finite element (FE) models of six mouse AL to investigate the effect of structure on the strain responses of the astrocyte network and axonal compartments to pressure elevation. The specimen-specific geometries of the FE models were reconstructed from confocal fluorescent images of cryosections of the mouse AL acquired in a previous study that measured the structural features of the astrocytic processes and axonal compartments. The displacement fields obtained from digital volume correlation in prior inflation tests of the mouse AL were used to determine the displacement boundary conditions of the FE models. We then applied Gaussian process regression to analyze the effects of the structural features on the strain outcomes simulated for the axonal compartments. The axonal compartments experienced, on average, 6 times higher maximum principal strain but 1800 times lower maximum principal stress compared to that experienced by the astrocyte processes. The mechanical responses in the axonal compartments were most sensitive to variations in the area of the axonal compartments. Larger axonal compartments that were more vertically aligned, closer to the AL center, and with lower local actin area fraction had higher strains. Understanding the factors affecting the deformation in the axonal compartments will provide insights into mechanisms of glaucomatous axonal damage.
Keywords: Astrocytes, Axons, Glaucoma, Finite Element Modeling, Gaussian Process Regression
1. Introduction
Glaucoma patients experience progressive loss of vision due to the degeneration of retinal ganglion cells (RGC) through initial injury to their axons at the optic nerve head (ONH) (Quigley et al, 1981). The human ONH includes a meshwork of collagen tissues known as the lamina cribrosa (LC). The non-collagen pore spaces of the LC are spanned by astrocytes. Astrocytes are star-like glial cells with long processes extending from the cell body. The processes of neighboring astrocytes intersect to form a sieve-like network in the LC pores (Elkington et al, 1990). The areas not covered by the processes are passageways for bundles of RGC axons to exit the eye wall and funnel into the optic nerve (ON). The collagen and astrocytic networks in the LC serve to withstand the pressure difference between the intraocular space and the optic nerve tissue pressure in the orbit. These networks are also responsible for resisting the hoop stresses generated in the surrounding sclera due to intraocular pressure (IOP) (Burgoyne, 2015). The mesh-like network of the astrocytes can also be found in the mouse ONH and is referred to as the astrocytic lamina (AL). The AL is an order of magnitude smaller in size than the human LC and spans the entire mouse ONH. Despite the absence of a collagen structure, the network of astrocytes still serves to structurally support the RGC axons in mouse eyes. The RGC axons in both the human LC and the rodent AL are unmyelinated (Forrester et al, 2020) and show early signs of axonal transport obstruction in glaucoma (Quigley et al, 1981; Minckler et al, 1976; Quigley et al, 2000). Therefore, the AL presents a unique model to study the mechanobiology of the ONH astrocytes in glaucoma, and may elucidate the mechanical responses of the astrocytic network and RGC axons within the LC pores.
The IOP is an important risk factor for the development and progression of glaucoma (Gordon et al, 2002; Leske et al, 2001; Investigators, 2000). Our previous study revealed that the astrocytic network was altered in the mouse AL after 3 days of IOP elevation. The AL after 3 days of IOP elevation in vivo had a larger areal coverage of actin and glial fibrillary acidic protein (GFAP), but lower GFAP area fraction and thinner GFAP-labeled processes (Ling et al, 2020). The IOP-induced strains after 3-day IOP elevation also increased in the mouse AL when measured by ex vivo inflation tests (Korneva et al, 2020). Strain was larger in the nasal-temporal (NT) direction (x-direction) than in the inferior-superior (IS) direction (y-direction). The experiments described how the astrocytic network deforms in response to a pressure increase in the inflation test using digital volume correlation (DVC). However, we were not able to measure the mechanical responses of the axons cradled within the astrocytic network due to limitations in image resolution. Therefore, the objective of this study was to develop an experimentally-informed finite element (FE) modeling methodology to estimate the strain state and stress state in the axonal compartments in response to IOP and to investigate the effect of the structural features on the local strain states of the axonal compartments.
FE modeling allows the mechanical responses of a structure to mechanical loading to be simulated for a given geometry and appropriate boundary conditions. Finite element models of the human ONH have been developed to investigate the effects of anatomical structure on the IOP-induced strains, including the radius of the eye, the thickness of the scleral shell, the scleral canal diameter, and the size of the choroid (Bellezza et al, 2000; Edwards and Good, 2001; Sigal et al, 2004, 2005; Sander et al, 2006; Hua et al, 2017; Feola et al, 2018). The connective volume fraction (Roberts et al, 2010; Campbell et al, 2015), collagen fiber arrangement (Girard et al, 2009b; Zhang et al, 2015; Wang et al, 2020; Grytz et al, 2011; Coudrillier et al, 2013; Campbell et al, 2015; Schwaner et al, 2021), and stiffness of the LC or of the surrounding scleral tissues (Sigal et al, 2005; Girard et al, 2009a; Sigal et al, 2009b) have also been shown to affect the mechanical response of the LC. Researchers have begun to investigate more detailed components of the LC, including the contribution of blood oxygen delivery within the LC (Hua et al, 2022) and the microstructural effects of the LC beams on the strain responses in the LC pore space, where the astrocytes and the axons were grouped as a homogenized neural tissue (Roberts et al, 2009; Downs et al, 2009; Grytz et al, 2016; Voorhees et al, 2017b,a, 2020; Karimi et al, 2021). However, there have not been models that examined and compared the mechanical responses of the axonal compartments and the astrocytic network as separate materials within the neural tissue. This is in part due to the limited availability of high-resolution images on the cellular network.
In this study, confocal fluorescent images acquired from six mouse ALs by Ling et al. Ling et al (2020) were used to create the specimen-specific FE models. The displacement fields of the AL of mouse eyes measured by Korneva et al (2020) for ex vivo inflation tests were applied as boundary conditions for the FE simulations. Six local structural features of the axonal compartments and five global AL features were measured from the confocal images for analyzing statistical relationships between structural features and strain responses of axonal compartments from the FE simulations using Gaussian process regression (GPR) (Rasmussen, 2003; Williams and Rasmussen, 2006).
The results from FE simulations showed that the IOP-induced strain responses were greater in the axonal compartments than in the astrocyte processes. The structure-strain analyses showed that strain outcomes were most sensitive to changes in the area and the orientation of the axonal compartments. Larger axonal compartments that were closer to the center of the AL, more vertically aligned, and with lower local actin area fraction exhibited the highest strains. Investigating the IOP-induced mechanical responses in axonal compartments will advance understanding of the mechanical insult experienced by RGC axons in glaucoma.
2. Materials and methods
This study used confocal fluorescent images of cryosections of the mouse AL acquired in a previous study (Ling et al, 2020) to construct 6 specimen-specific FE models. Boundary conditions were determined from the displacement field measured for the mouse AL from a previous inflation test study (Korneva et al, 2020). The experimental protocols were approved by the Animal Care and Use Committee of Johns Hopkins University School of Medicine and in compliance with the NIH Guide for Care and Use of Laboratory. The FE mesh was generated using the GIBBON Toolbox (Moerman, 2018). The FE analysis was conducted in the FEBio Studio v1.3 (Maas et al, 2012) software. The image processing, strain transformation, and statistical analyses were performed in Matlab (Matlab R2019a, Mathworks, Natick, MA, US). The following sections describe the methods for developing the FE models, measuring the structural properties, and analyzing the effects of the measured structural features on the strain responses obtained from the FE analysis.
2.1. Specimen-specific FE models of the AL
The geometries of 6 control mouse ALs were obtained from confocal images from a previous study (Ling et al, 2020). The specimen preparation, imaging, and image processing methods were described in detail in Ling et al. (Ling et al, 2020). Briefly, six-month-old genetically modified mice expressing green fluorescent protein (GFP) driven by the glutamate transporter protein 1 (GLT1) promoter were used (Zhuo et al, 1997). An ON stump of 1mm in length was separated from the posterior wall of the control eyes. The stump was cryo-preserved and cryo-sectioned into 8 or 10 μm slices. The slices were incubated with primary rabbit anti-GFAP antibody (1:1000, Abcam AB7260) and secondary Alexa Fluor 488 goat anti-rabbit antibody (1:500, Invitrogen A11008) for labeling of GFAP. The slices were also stained with Alexa Fluor 568 phalloidin (1:60, Invitrogen A1280) for visualization of actin filaments. For this study, an ON slice that was 30 or 32 μm posterior to the Bruch’s membrane opening was selected to represent the in-plane astrocyte network for each AL.
The confocal fluorescent images were acquired by a Zeiss LSM 710 confocal microscope using a Plan-Apochromat 40× oil immersion objective. The excitation wavelength was set to 458 nm for the immunostained GFAP and 561 nm for the phalloidin-labeled actin (Fig. 1a). The images were captured close to the slice surface where both the GFAP and actin signals exhibited the highest intensity. The actin and GFAP images were processed by a median filter to reduce noise and by contrast-limited adaptive histogram equalization (CLAHE) to brighten dim features (Zuiderveld, 1994). The enhanced images were binarized using the Otsu thresholding method (Otsu, 1979). The segmented GFAP and actin structures were combined to create a two-dimensional (2D) image of the AL with distinct areas of GFAP, actin, overlapping GFAP and actin, and axonal compartments. The axonal compartments were defined as the non-GFAP and non-actin areas within the AL boundary. The image was down-sampled 9 times from a resolution of 0.104 μm/pixel to 0.93 μm/pixel to reduce the number of elements for computational efficiency. The effect of this simplification on the strain response was examined in Section 3.5. The 2D image was extruded to a thickness of 5 pixels (4.7 μm) in the z-direction to create a three-dimensional (3D) image. The 3D geometry was discretized into 171,220 trilinear hexahedral elements (HEX8), where each 3D voxel corresponded to an element. The discretization was performed using the GIBBON Toolbox (Moerman, 2018) (Fig. 1b).
Fig. 1:

Development of a specimen-specific model of the mouse AL. The model was developed from (a) a confocal microscope image of a thin section from the unmyelinated region of the mouse ON. The thin section was labeled for GFAP (green) and actin (red). The non-actin and non-GFAP labeled regions were marked as axonal compartments. (b) The image was downsampled and the actin (red), GFAP (green), axonal compartment (yellow), and overlapping actin and GFAP (purple) regions of the downsampled image were segmented into material regions. An FE model of the AL was created by turning each voxel into a trilinear hexahedral element (HEX8). A 26 μm × 26 μm area is enlarged to better visualize the mesh. (c) The ux(θ) and uy(θ) displacement components obtained from ex vivo inflation tests were applied on the side surface (blue surface). The uz(r, θ, z) displacements were applied on the anterior and posterior surfaces to represent the out-of-plane movement (red surfaces). (d) The resulting contour plot of the uz displacement component obtained from FE simulation, the displacement was enlarged by 10 times for visualization.
2.2. Boundary conditions
The displacement response of the mouse AL calculated by DVC in prior ex vivo inflation tests (Korneva et al, 2020) were used to determine the boundary conditions of the FE models. Previous FE modeling studies of the biomechanics of the neural tissues of the human LC have estimated the boundary conditions of LC by embedding a specimen-specific LC into a generic model of the posterior scleral shell. This approach necessarily requires approximations and assumptions regarding the geometry of the scleral-LC junction and the material properties of the sclera and LC, which can introduce errors in the boundary conditions. Using experimentally measured displacement fields from inflation tests allows us to avoid m aking these assumptions. The in-plane components of the DVC displacement field were applied to the side surface of the FE models of the AL to represent the scleral hoop stresses caused by the applied pressure increase in the inflation test. The out-of-plane component of the DVC displacement field was applied to the anterior and posterior surfaces of the FE models to represent the direct effects of the applied pressure increase in the inflation test.
The inflation experiments were described in detail in (Korneva et al, 2020) and summarized here. The inflation experiments included 19 adult mice (5 – 8 months old), hemizygotes expressing the green fluorescent protein in all astrocytes under control of the GFAP promoter (FVB/N-Tg (GFAP-GFP)14Mes, Jackson Laboratories no. 003257, Bar Harbor, ME, USA). The optic nerve of the explanted mouse eye was trimmed flush to the sclera to reveal the AL. The eye was glued at the cornea to a custom plastic holder such that the AL was parallel to the imaging plane. The anterior chamber of the eye was cannulated using a 30-gauge needle and connected to a fluid reservoir to control the IOP. During the inflation experiment, the IOP was raised from a baseline of 10 mmHg to 30 mmHg. At both pressures, the AL was imaged using a laser scanning microscope with a two-photon laser source at an excitation wavelength of 895 nm (Carl Zeiss Microscopy, LLC, Thornwood, NY). The images were processed by a deconvolution algorithm (Huygens Essential, Scientific Volume Imaging, The Netherlands) to reduce blur and noise, followed by CLAHE in FIJI to brighten dim features (Schindelin et al, 2012; Midgett et al, 2017).
2.2.1. Determining in-plane displacement boundary conditions
An open-source DVC algorithm (Bar-Kochba et al, 2015) was used to compute the 3D displacement field for each sample from the images acquired at the 10 mmHg baseline pressure and at 30 mmHg. The strain field was calculated from the DVC displacement field using a series of post-processing steps (Nguyen et al, 2017, 2018; Korneva et al, 2020). The displacement field from eyes with accurate DVC correlation in at least 30% of the area in all 4 anatomical quadrants (inferior, superior, nasal, and temporal) were further used for the determination of boundary displacements. As a result, 14 of 19 eyes from Korneva et al (2020) were used in this study to map the DVC displacement field to the boundary of the FE models. We first fit an ellipse to the maximum intensity projection image of the AL for each of the 14 inflation test specimens. The ellipse was drawn such that the minor axis of the ellipse was the Inferior-superior (IS) axis of the AL and the major axis of the ellipse was the Nasal-Temporal (NT) axis of the AL. The IS axis of the ONH was identified in the inflation test from the location of the inferior blood vessels for all AL (Korneva et al, 2020). The center of the AL was defined as the center of the ellipse and the average diameter of the AL was defined as the average of the major and minor axes of the ellipse. The DVC displacement field was transformed so that the x and y displacement components were aligned with the NT and the IS axes of the AL. For the remainder of this section, the NT direction will be referred to as the x direction and the IS direction will be referred to as the y direction.
The in-plane displacements at the AL boundary were extracted from the DVC displacement field using the following steps. The DVC-correlated area was converted to a binary mask to represent the shape of the AL. The AL mask was smoothed by morphological dilation followed by erosion (Matlab function imclose). An 8-micron thick ring was traced along the outermost pixel of the AL mask to create a border mask. Data points outside the border mask were removed (Fig. 2a & b). This 8-pixel wide border region was divided into 360 sector volumes, each spanning 1° in the circumferential θ direction. The 0° corresponded to the temporal direction of each AL. The volume average of the displacement field was calculated for each sector and normalized by the average diameter of the AL to account for its effect on the displacement response to pressure. The normalized displacement vector of each sector was averaged over 14 eyes, and a fourth-order polynomial was fit to the averaged normalized displacement component in the x-direction, ûx (θ), (R2 = 0.99, Fig. 2c). A fifth-order polynomial was fit to the averaged normalized displacement component in the y-direction, ûy (θ), (R2 = 0.99, Fig. 2d). The selected polynomial orders fit the data with an R2 of 0.99. Lower-order polynomials provided a fit with lower R2. For each FE model of the AL, the normalized displacement components ûx (θ) and ûy (θ) were scaled by the average diameter of the AL to give specimen-specific scaled displacement boundary conditions ux(θ) and uy(θ). The ux(θ) and uy(θ) were applied to the nodes on the side surface of the FE model of the AL to represent the loading exerted by the scleral hoop stresses on the AL, caused by the applied pressure increase in the inflation test (Fig. 1c).
Fig. 2:

Determining the displacement boundary conditions from ex vivo inflation test data. (a) A contour plot of the thickness averaged ux response to a 20 mmHg IOP increase calculated by DVC. The x and y directions are aligned with the NT and IS axes of the AL, respectively. (b) An 8 μm-thick ring was traced along the boundary of the DVC correlation volume. The boundary region is overlaid onto the maximum intensity projection of a two-photon fluorescent image volume of the AL of the inflation-tested specimen. The ring was divided into 360 sector volumes. The volume-averaged displacement components were calculated for each sector and the result was normalized by the average diameter of the AL. (c) A fourth-order polynomial function was fit to the average normalized ûx (θ), while (d) a fifth-order polynomial function was fit to the average normalized ûy (θ).
2.2.2. Determining out-of-plane displacement boundary conditions
The out-of-plane component of the DVC displacement field exhibited greater specimen-to-specimen variability than the in-plane displacement components. Therefore, we did not average the out-of-plane component of the displacement field over the 14 specimens as we did for the in-plane displacement components. Instead, we used the DVC displacement field of a specimen with the lowest absolute z-displacement error to provide the boundary conditions for the anterior and posterior surfaces of the FE models. We compared the effect of applying the DVC displacements to applying a 20 mmHg pressure boundary condition and a traction-free boundary condition to the anterior surface in Sec. 3.5.
The displacement field was registered to align the x and y components with the NT and IS directions as described in Sec. 2.2.1. Henceforth, the NT and IS directions will be referred to as the x and y directions, respectively. The z-displacement at z = 30μm and z = 34μm away from the most anterior position of the DVC data was extracted as the boundary displacements for the anterior and posterior surfaces of the FE models to correspond to the position of the ON slice used to create the FE models (Fig. 3a). The z-displacement at each depth was interpolated in x–y using a least square approach (D’Errico, 2021) to fill in areas that were removed by the DVC calculations because of a low correlation coefficient or large displacement error (Korneva et al, 2020), normalized by the average diameter of the test specimen, then registered to cylindrical coordinates to give ûz (r, θ, z) (Fig. 3b). The ûz (r, θ, z) was scaled by the average diameter of the FE model and the resulting uz (r, θ, z) was applied to the nodes of the anterior and posterior surfaces based on the nodal r, θ and z coordinates (Fig. 3c).
Fig. 3:

Determining the z-displacement boundary conditions from ex vivo inflation test data. (a) A contour plot of the uz displacement of an inflation-tested specimen with the lowest uz error at a distance 30μm from the most anterior point calculated by DVC. (b) The uz at z = 30μm and z = 34μm were interpolated using the least square method to fill in areas removed by the low correlation coefficient, the x and y directions were constrained to align with the NT and IS axes, respectively, of the test specimen. The uz was stored in polar coordinates as uz(r, θ, z). (c) The uz(r, θ, z) map was resized to match the size of an AL model by multiplying the r-coordinates by the ratio between the average diameter of the AL model and that of the inflation test specimen. The resulting scaled ûz(r, θ, z) at z = 30μm was applied to each node on the anterior surface of the AL models according to the r and θ direction. The ûz(,θ, z) at z = 34μm was applied to the posterior surface of the AL models in the same manner.
2.3. Material Properties
A compressible Neo-Hookean model (Bonet and Wood, 1997) was used to describe the stress response of all materials in the FE model of the AL. For a hyperelastic model, the Cauchy stress is defined for a given strain energy density function Ψ as,
| (1) |
where F is the deformation gradient tensor, C is the right Cauchy-Green deformation tensor (C = FTF), J = det(F). The strain-energy density function Ψ for a Neo-Hookean model is
| (2) |
where I1 = tr(C) is the first invariant of C. The material properties μ and λ are the first Lamé parameter (also the shear modulus) and the second Lamé parameter, which can be determined from the Young’s modulus E and Poisson’s ratio ν as and . The shear modulus of the GFAP material was set to μGFAP = 2.4 MPa based on atomic force microscope (AFM) measurements of another intermediate filament, vimentin (Guzman et al, 2006). The shear modulus for actin was set to μactin = 21.2 MPa from AFM measurements which showed that the shear modulus of actin was 8.8 times larger than that of vimentin (Janmey et al, 1991). The Young’s modulus EAC of the axonal compartments was set to 4.6 kPa from AFM measurements on the white matter of brain tissues (Zhang et al, 2017). The combined actin and GFAP regions were regarded as a mixture of the two compressible elastic solids (FEbio option solid mixture), in which the stress tensor for the mixture is the sum of the stresses from both of the materials.
We assumed that all of the materials had the same Poisson’s ratio ν. Previous modeling studies of the LC typically assumed that the LC tissue is nearly incompressible and used a Poisson ratio close to 0.5 (e.g. (Bellezza et al, 2000; Sigal et al, 2004; Girard et al, 2009b; Zhang et al, 2015; Coudrillier et al, 2013; Girard et al, 2009a; Sigal et al, 2009b,a; Roberts et al, 2010; Voorhees et al, 2017a)). However, a previous experimental study using a micromechanical compression test measured a Poisson’s ratio of ν = 0.14 for the porcine ONH (Safa et al, 2021). The authors attributed the compressibility of the ONH to poroviscoelastic behavior. To determine the Poisson’s ratio of the mouse AL, we simulated the inflation response of the AL of mouse 1 using the experimentally determined boundary conditions, the moduli for actin, GFAP, and axonal compartments given in the preceding paragraph, and for different Poisson’s ratio ν from 0.2 to 0.495 and compared the strains in the AL from the simulations and from the inflation experiments. The results in Sec. 3.2 showed that ν = 0.2 provided the best fit to the DVC strains (Korneva et al, 2020), which agreed with the previous ex vivo experimental study of (Safa et al, 2021). However, the compressible behavior of the ONH may be a characteristic of the ex vivo test conditions, and is contrary to assumptions of previous modeling studies. Therefore, we performed two sets of simulations for all 6 FE models using ν = 0.2 and ν = 0.495. In the following, FE models refer to those using ν = 0.2 and incompressible FE models refer to those using ν = 0.495.
2.4. Characterizing structural features of the AL
A custom morphological analysis program adapted from a previous study (Ling et al, 2020) was used to measure 11 structural features from the downsampled images used for constructing the FE model of the AL (https://github.com/trayling/Morph_Analysis). The structural features include 6 local features for each axonal compartment and 5 global features of the AL in which the axonal compartment was located. The features are defined as follows:
Axonal compartment area (μm2): The area of each axonal compartment in micrometers converted from the number of pixels.
Axonal compartment aspect ratio: The ratio of the major to minor axes of an ellipse fit to each axonal compartment.
Axonal compartment orientation (°): The angle between the major axis of the axonal compartment to the x-axis.
Normalized distance to AL center: The normalized distance from the center of the axonal compartment to the center of the AL along a line from the center to the boundary of the AL. A normalized distance of 0% means that the axonal compartment is at the center while 100% means that the axonal compartment is at the boundary.
Local actin and GFAP area fractions: A 15 × 15 μm2 box surrounding the center of each axonal compartment was first identified. The number of pixels covered by actin was divided by the number of pixels of the box. Similarly, the GFAP area fraction within the bounding box was calculated.
AL area (μm2): The total area within the autodetected AL boundary.
AL aspect ratio: The ratio of the major to minor axes of an ellipse fit to the AL.
AL GFAP, actin, and axon area fractions: The GFAP, actin, and axonal compartment areas divided by the total AL area, respectively.
2.5. Statistical analysis
2.5.1. Outcomes of the FE simulations
The components of the Green Lagrange strain tensor were exported from FEBio to Matlab for further statistical analyses. In the following, Exx, Eyy, and Ezz denote the normal strain components in the NT, IS, and out-of-plane directions, respectively. The Exy is the in-plane shear strain and Exz and Eyz are the out-of-plane shear strains. The maximum principal strain Emax and the minimum principal strain Emin were calculated from the maximum and minimum eigenvalues, respectively, of the strain tensor. The maximum shear strain was calculated as γmax = 1/2(Emax − Emin). The maximum principal stress (σmax) and minimum principal stress (σmin) were similarly determined from the maximum and minimum eigenvalues of the stress tensor. The maximum shear stress τmax was calculated as τmax = 1/2(σmax − σmin). In the following sections, all materials except for the axonal compartments (actin, GFAP, and overlapping GFAP and actin) were grouped as astrocyte processes for comparison between the astrocyte processes and the axonal compartments. The stresses and strains were averaged along z to obtain thickness-averaged maps.
2.5.2. Comparing mechanical response of the astrocyte processes and axonal compartments
The results of the FE models were analyzed to compare the stress and strain responses in the axonal compartments and astrocytic processes. The specimen-averaged stress and strain components in the axonal compartments were compared to the specimen averages for the astrocyte processes using the Student’s t-test followed by Bonferroni correction (n = 6, Matlab function ttest). The specimen averages from the axonal compartments were also used to compare between the 8 strain components and the between the 8 stress components using one-way analysis of variance (ANOVA) followed by multiple pairwise comparison test (n = 6, Matlab function ‘multcompare’). Similarly, the specimen averages from the astrocyte processes were used to compare between the 8 strain outcomes and between the 8 stress outcomes. ANOVA was also used to compare the specimen-averaged outcomes between the axonal compartments, GFAP, and actin material (n = 6). For all analyses, a p-value or an adjusted p-value lower than 0.05 was considered a significant observation.
2.5.3. Effects of structural features on the strain response of the axonal compartment
Gaussian process regression (GPR) (Williams and Rasmussen, 2006) was used to analyze the statistical correlations between the 11 structural features of the AL and axonal compartments (Sec. 2.4) and the 8 strain outcomes of the axonal compartments of 6 FE models. In preliminary studies, GPR provided a better fit between the structural features and strain outcomes of the FE simulations (higher R2 values and lower mean squared errors) than other regression methods, including multivariate linear regression, support vector regression, regression tree, and principal component regression. While the GPR analysis considered the effects of 5 AL structural features defined in Sec. 2.4 on the axonal strains, other AL structural features may similarly have a significant effect. Thus, we applied GPR to analyze the statistical correlations between the 6 structural features of the axonal compartments and the axonal strains of the FE model for Mouse 1. Finally, the GPR analysis was repeated for the 6 incompressible FE models to examine the effect of tissue compressibility on the relationship between the structural features and strains in the axonal compartment.
For the GPR structure-strain analysis, the strain responses in each axonal compartment were represented by the maximum value found in the axonal compartment. The axonal compartments with fewer than 3 pixels appeared pixelated and were excluded from further analysis. There were a total of 2841 axonal compartments from the 6 ALs. For analyses involving all 6 AL, the 6 structural measurements from each axonal compartment and the 5 structural measurements for the AL were combined as input variables x for the structure-strain model (Matlab function fitrgp). The output variable was each of the 8 strain outcomes (Exx, Eyy, Ezz, Exy, Eyz, Exz, Emax, γmax). The input and output data were used to train 8 GPR models, one model for each of the strain outcomes. The input and output data points were standardized by subtracting the mean and dividing the result by the standard deviation of the variable so that each variable had a mean of 0 and a standard deviation of 1. The possible functions that map the input variables to the output were regarded as a Gaussian process, and were represented by a mean function m(x) and a covariance kernel function, k(xi,xj), where:
| (3) |
The covariance function represents how the response for a set of structural features xi is affected by responses at another set of structural features xj (Rasmussen, 2003). We used a squared exponential covariance function with automatic relevance determination (ARD) (Matlab option ARDSquaredExponential), which can be expressed as,
| (4) |
The parameter is the overall signal variance, a smaller value indicates less variation from the mean function. The parameter ln is the correlation length scale for each structural feature and represents the sensitivity of the model to a change in that structural feature. A shorter ln indicates that the model is more sensitive to the changes in that structural feature.
The goodness-of-fit between the outputs of the structure-strain model according to the input structural features and the simulations from the FE analysis for each axonal compartment (Fig. 9b, n = 2841) was evaluated by calculating the residue R2 value. The R2 ranged from 0 to 1 with R2 = 1 representing a perfect fit of the structure-strain model to the FE results. In this study, four structure-strain models for Emax, Exx, Eyy, and γmax had an R2 > 0.70. The p-value for each association was also calculated, a p <0.05 signifies that the corresponding R2 is considered significant.
Fig. 9:

Goodness of fit for the structure-strain models. (a) The Emax in the axonal compartments from FE simulation of the AL of mouse 1. (b) Plot of the maximum Emax in each axonal compartment from FE simulations of the 6 ALs and from the structure-strain model to evaluate the goodness of fit for the structure-strain model. The solid line has a slope of 1 to denote a perfect fit.
We applied the GPR structure-strain analyses using results from FE simulation with ν = 0.2 to estimate the effects of variations in the structural features on the Exx, Eyy, Emax, and γmax of the axonal compartments. The structure-strain analyses for these 4 strain outcomes had a good fit, with R2 > 0.7, to the FE simulations. For the sensitivity study, we varied one structural feature at a time from the minimum to the maximum value obtained from all the axonal compartments of the FE models. The remaining 10 structural features were set to the average values from the axonal compartments. The trained GPR structure-strain models output the expected range of strain outcomes for the range of the structural feature (Fig. 4).
Fig. 4:

Input and output variables for the Gaussian process regression model.
3. Results
3.1. Structural features of the axonal compartments
The axonal compartments across the 6 AL specimens had an average area of 8.0 ± 9.1 μm2 (Table 1). The average local area fraction of the GFAP and actin (section 2.4) was 0.60 ± 0.11 and 0.67 ± 0.06, respectively. The axonal compartments were elliptical, with an average aspect ratio of 2.4 ± 1.0. Among the 6 mouse ALs, the average aspect ratio of the AL was 1.3 ± 0.2. The average area fractions of the axonal compartment, GFAP, and actin were 0.15 ± 0.02, 0.62 ± 0.05, and 0.69 ± 0.02, respectively.
Table 1:
Summary of the structural features measured from the 6 mouse ALs, showing the mean, standard deviation, and the minimum and maximum of the range of variations.
| Structural Features | Mean ± std | Range | |
|---|---|---|---|
| Axonal compartment | Area (μm2) | 8.0 ± 9.1 | 2.6 – 54 |
| Aspect ratio | 2.4 ± 1.0 | 1.0 – 10 | |
| Orientation (°) | 0.1 ± 54.8 | −90 – 90 | |
| Normalized distance to AL center | 0.7 ± 0.2 | 0.0 – 0.1 | |
| local GFAP area fraction | 0.6 ± 0.1 | 0.0 – 0.9 | |
| location actin area fraction | 0.7 ± 0.1 | 0.4 – 0.9 | |
| Astrocytic lamina | Area (mm 2 ) | 0.03 ± 0.002 | 0.028 – 0.034 |
| Aspect Ratio | 1.3 ± 0.2 | 1.2 – 1.6 | |
| Axonal fraction | 0.15 ± 0.02 | 0.11 – 0.17 | |
| GFAP fraction | 0.62 ± 0.05 | 0.56 – 0.69 | |
| Actin fraction | 0.69 ± 0.02 | 0.66 – 0.72 |
3.2. Determining the Poisson’s Ratio
FE simulations were performed for the AL model of mouse 1 for different Poisson’s ratios, 0.2, 0.3, 0.4, and 0.495 (Fig. 5). The in-plane strains Exx and Eyy were insensitive to the Poisson’s ratio. However, Ezz became noticeably more compressive for larger Poisson’s ratio. The ν = 0.2 provided the best fit of the specimen-averaged Ezz from DVC for mouse 1.
Fig. 5:

Comparison of the normal strains from the FE simulations for the AL of mouse 1 for Poisson’s ratio ν of (a) 0.2, (b) 0.3, (c) 0.4 and (d) 0.495 to the experimental DVC strain calculations (red). The in-plane strain Exx and Eyy were not sensitive to ν. The Ezz became more compressive with larger ν and was closest to the experimental median when ν = 0.2. The box plots included data points from elements of the astrocyte processes of mice 1 that were within 3 times the interquartile range.
We performed the FE simulations for all 6 ALs using ν = 0.2 and ν = 0.495 to examine further the effect of compressibility on the strain response. As observed for the AL model of mouse 1, the in-plane strains of the astrocytic processes and axonal compartments for all 6 ALs were insensitive to the Poisson’s ratio, while the out-of-plane strain was significantly more compressive for the incompressible models (Supplemental Table S1). The Exx, Eyy and Ezz in the astrocytic processes in the incompressible models were on average 1.3% higher, 11.8% lower, and 336.6% lower (more negative), respectively, than in the compressible models (Fig. 5d). Furthermore, the maximum Emax, Exx, Eyy and γmax in the axonal compartments of the incompressible models were on average 17.1%, 18.1%, 4.1%, and 1.0% lower than in the compressible models (Supplemental Fig. S1a).
3.3. Strain and stress responses of the astrocyte network
The average normal strains in astrocyte processes from the 6 AL models were comparable to the experimental averages from the 14 inflation-tested eyes (Table 2 and Fig. 5a). The average in-plane strain Exx (0.030 ± 0.003) in the processes was 1.9 times higher than strain Eyy 0.016 ± 0.001) and 3.5 times higher in magnitude than the compressive out-of-plane strain Ezz (−0.009 ± 0.001, p < 0.01 for both, Table 3). This gave rise to a σxx (1.54 ± 0.90 MPa) that was 1.5 times higher than the σyy (1.05 ± 0.6 MPa, Table 4) and 58 times higher in magnitude than the σzz (−0.03 ± 0.13 MPa).
Table 2:
The average and standard deviation of the normal strains in the astrocyte processes, comparing the specimen-averaged strains measured for 14 inflation-tested specimens and that from the FE simulations of 6 specimen-specific models of the AL. The normal strains in the astrocyte processes from the incompressible models are shown in Supplemental Table S1 for comparison.
| E xx | E yy | E zz | |
|---|---|---|---|
| Inflation Test | 0.028 ± 0.011 | 0.013 ± 0.007 | −0.008 ± 0.017 |
| FE Simulations | 0.030 ± 0.003 | 0.016 ± 0.001 | −0.009 ± 0.001 |
Table 3:
Comparison of the specimen-averaged strain outcomes between the astrocyte processes and the axonal compartments. The p-values were from the Student’s t-test after Bonferroni correction (n = 6).
| Strain | Astrocyte Process | Axonal Compartment | p-values |
|---|---|---|---|
| E xx | 0.03 ± 0.003 | 0.19 ± 0.02 | <0.001 |
| E yy | 0.02 ± 0.001 | 0.07± 0.01 | <0.001 |
| E zz | −0.0098 ± 0.001 | −0.0104 ± 0.001 | 0.048 |
| E xy | 0.01 ± 0.001 | 0.04 ± 0.004 | <0.001 |
| E yz | −0.0001 ± 0.00004 | −0.00003 ± 0.0001 | 0.200 |
| E xz | 0.0001 ± 0.00002 | 0.00004 ± 0.0002 | 1 |
| E max | 0.05 ± 0.003 | 0.26± 0.02 | <0.001 |
| γ max | 0.03 ± 0.002 | 0.14 ± 0.01 | <0.001 |
Table 4:
Comparison of the specimen-averaged stress outcomes between the astrocyte processes and the axonal compartments. The p-values were from the Student’s t-test after Bonferroni correction (n = 6).
| Stress | Astrocyte Process (kPa) | Axonal Compartment (Pa) | p-values |
|---|---|---|---|
| σ xx | 1300 ± 164 | 717 ± 55 | <0.001 |
| σ yy | 867 ± 50 | 381 ± 17 | <0.001 |
| σ zz | −1.4 ± 0.3 | 140 ± 7.2 | <0.001 |
| σ xy | 246 ± 33 | 137 ± 9.9 | <0.001 |
| σ yz | −6.7 ± 1.4 | −0.7 ± 0.7 | <0.001 |
| σ xz | 8.7 ± 1.7 | 1.2 ± 1.0 | <0.001 |
| σ max | 1700 ± 141 | 925 ± 46 | <0.001 |
| τ max | 870 ± 70 | 412 ± 20 | <0.001 |
Contour plots of the thickness-averaged strain components (Fig. 6) showed that Exx was larger in the horizontally aligned processes, and Eyy was larger in the vertically aligned processes (Fig. 6a & b). The maximum tensile strain Emax and the maximum shear strain γmax were higher in regions directly adjacent to the axonal compartments (Fig. 6g, h). The magnitude of the shear strains Eyz and Exz (Fig. 6e & f) were higher along the AL boundary. However, the average Eyz and Exz were near zero (Fig. 6i). Furthermore, the average normal strains were larger than the average shear strains (p <0.01). We also measured negligible average Eyz and Exz and significantly larger normal strains than shear strains in the AL in the inflation tests (Korneva et al, 2020). The same trends were found for the incompressible FE models.
Fig. 6:
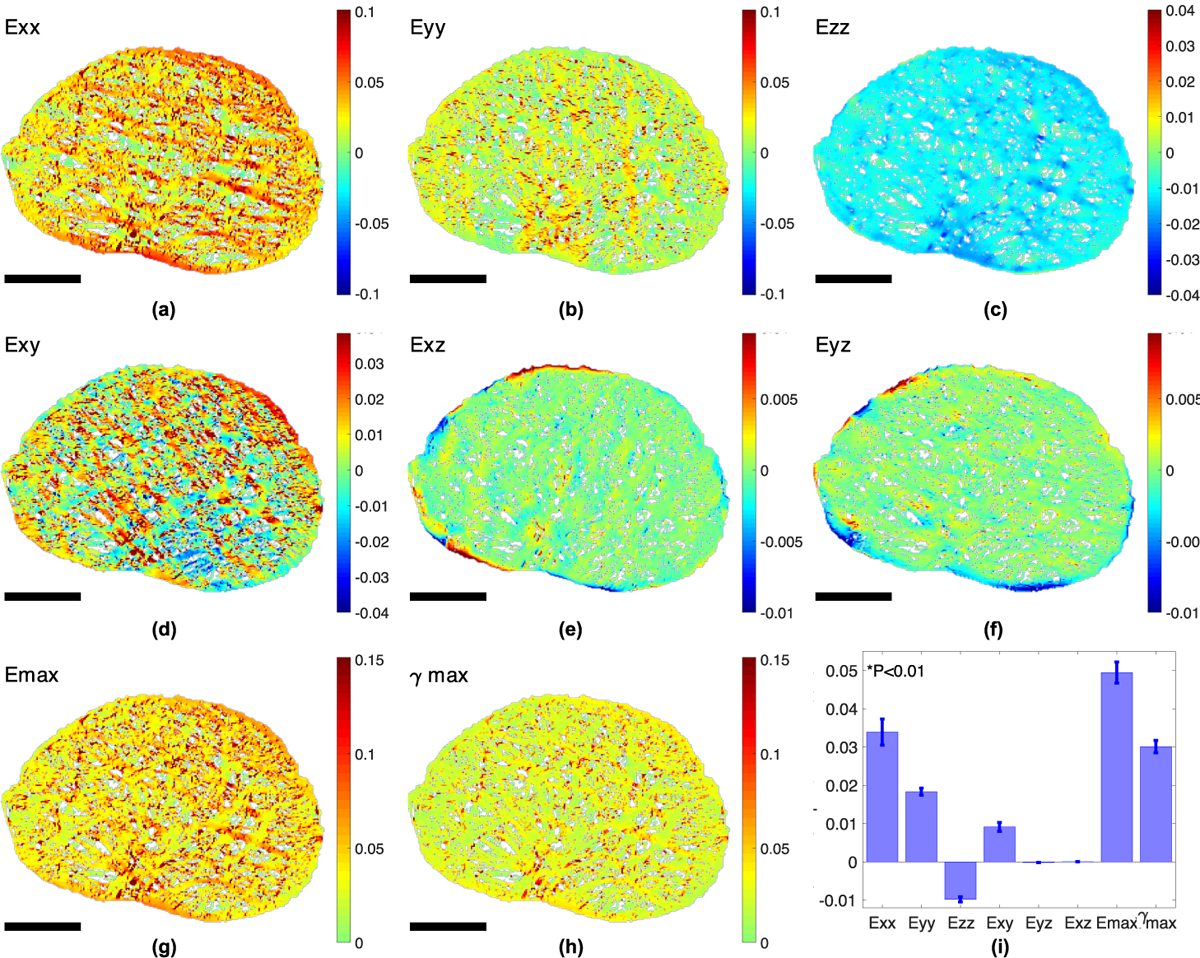
Color contour plots of the strain field in the astrocyte processes from FE simulations for mouse 1, showing (a) Exx, (b) Eyy, (c) Ezz, (d) Exy, (e) Eyz, (f) Exz, (g) Emax, and (h) γmax averaged through the thickness. (i) Bar chart comparing the 8 average strain outcomes (n = 6). All strain outcomes were significantly different from Exx (p < 0.01). Higher Exx occurred in horizontally aligned processes (a), while higher Eyy occurred in long vertically aligned processes (b). Higher Emax and γmax appeared at regions directly adjacent to the axonal compartments. Scale bar = 50 μm.
3.4. Strain and stress responses of the axonal compartments
All strain outcomes in the axonal compartments were significantly higher than that in the astrocyte processes for the compressible FE models (Fig. 7a–b, 8a, p < 0.05) and incompressible FE models (Fig. S1a, p < 0.05), except for Eyz and Exz, which were near zero. For the FE models, the magnitude of the average strains Exx, Eyy and Ezz were 5.5 times, 4.0 times, and 1.1 times higher in the axonal compartments than in the astrocyte processes. The maximum normal strain Emax and maximum shear strain γmax were 5.2 and 4.6 times higher in the axonal compartments than those in the astrocyte processes. Conversely, σmax was lower in the axonal compartments (925 ± 46 Pa) than in the GFAP (1.65 ± 1.01 MPa) and the actin materials (1.99 ± 0.95 MPa, Fig. 8b, and Supplemental Fig. S1b, p < 0.01) because the Young’s modulus of the axons was more than 1000 smaller than the modulus of the constituent materials in the astrocytic processes. The maximum principal stress σmax and the maximum shear stress τmax were 1760 times and 1740 times lower in magnitude in the axonal compartments than in the astrocyte processes (Fig. 7c–d, p < 0.01).
Fig. 7:

Color contour plots of (a) Emax, (b) γmax, (c) σmax, and (d) τmax for a 26 × 26 μm2 region near the center of the AL as indicated in Figure 1b.
Fig. 8:
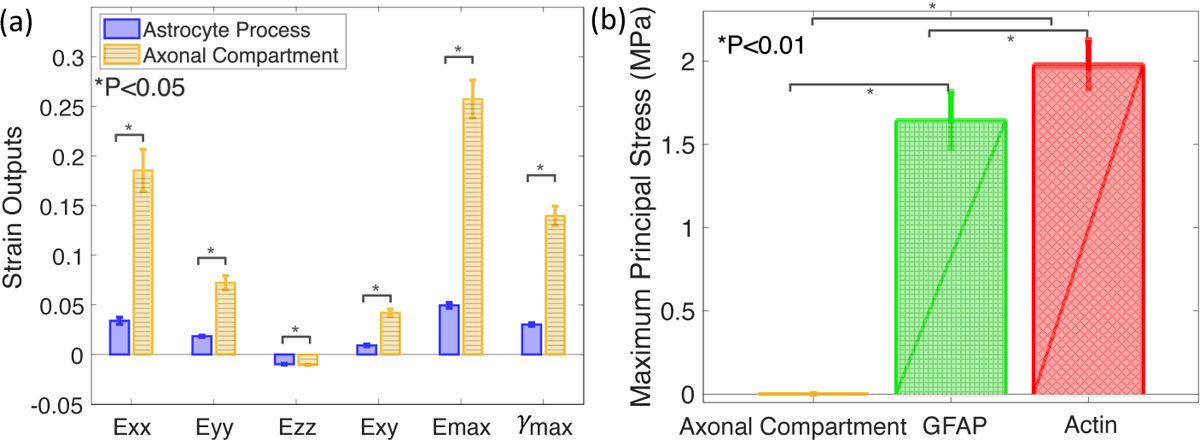
Comparison between the specimen-averaged mechanical responses in the axonal compartments (blue) and the astrocyte processes (yellow, n = 6). Bar charts showing (a) the magnitudes of Exx, Eyy, Ezz, Exy, Emax, γmax were higher in the axonal compartments than in the astrocyte processes (p <0.05). (b) The maximum principal stress, σmax, in the axonal compartments was on average 1800 times and 2100 times lower than in the GFAP and actin materials (p < 0.01).
3.5. Effects of FEM modeling assumptions on the strain response
We performed a sensitivity analysis to determine the effect of the following modeling assumptions on the strain responses of the AL models: 1) downscaling the fluorescent images to create the AL model, 2) the thickness of the AL model, 3) the in-plane boundary conditions, 4) the out-of-plane boundary conditions, and 5) the Young’s modulus of the different materials in the AL. The sensitivity analysis for the effects of downscaling was performed for the AL model of mouse 1 only, while the sensitivity analysis for the effects of the model thickness, in-plane boundary conditions, out-of-plane boundary conditions, and the Young’s modulus were performed for all 6 AL models.
3.5.1. Effects of downscaling
The FE models were constructed from the down-sampled fluorescent images of the AL. Reducing the image resolution produced a coarser FE discretization of the microstructural features of the AL, but was needed to make the FE simulations computationally tractable. To examine the effect of this simplification on the strain response, we created an FE model of a 26 × 26 μm2 region close to the center of the AL of mouse 1 (Fig. 1b) from the fluorescent images of the AL with the original resolution using the method described in Sec. 2.1. The resulting FE model of the subvolume had a 0.104 μm element width compared to the 0.93 μm element width of the FE model created from the downsampled image. The nodal displacements ux, uy, and uz of the subvolume were extracted from the coarse model and interpolated to the nodes of all of the boundary surfaces to provide boundary conditions for the FE model of the subvolume.
The more detailed FE model of the AL subvolume of mouse 1 showed similar variations in the strain field of the axonal compartments and the astrocyte processes as the coarser FE model of the AL (Supplemental Fig. S8). The higher spatial resolution of the subvolume showed how the strain field varied within the axonal compartments in more detail. The thickness averaged Emax in the center of the axonal compartments was up to 7 times larger than in the periphery of the axonal compartment.
3.5.2. Effects of model thickness
We compared the effect of the thickness of the FE models on the strain response of the astrocytic processes. Two additional sets of FE models were constructed for all 6 AL as described in Sec. 2.1 with a thickness of 8 pixels and 10 pixels (7.5 and 9.3 μm). The latter was twice as thick as the baseline 5-pixel thick FE models.
The strain responses in astrocytic processes decreased asymptotically with an increasing model thickness (Supplemental Fig. S7). Changing the thickness of the AL from 4.7 μm to 7.5 μm resulted in a 1.0% lower Exx, 1.1% lower Eyy, and a 1.8% lower Ezz in the astrocyte processes. The strains further decreased by 0.3%, 0.4%, and 0.6% in Exx, Eyy and Ezz, respectively, as the thickness increased to 9.3 μm.
3.5.3. Effects of the in-plane boundary conditions
The process of averaging theUx andUy components of the DVC displacement field of 14 inflation-tested specimens described in Sec. 2.2.1 may introduce errors associated with uncertainties in the anatomical orientations and over-smoothing. To examine the effect of averaging the displacement field over multiple specimens, we reran the FE analyses using the Ux and Uy DVC displacement components from one AL specimen for the in-plane boundary conditions. Specifically, we extracted Ux and Uy from the same specimen used to extractUz for the out-of-plane boundary conditions. As forUz, the Ux and Uy fields were registered to align the x and y components with the NT and IS directions as described in Sec. 2.2.1. Applying the in-plane boundary conditions extracted from one mouse did not noticeably alter the strain fields as demonstrated in Supplemental Fig. S3 for the AL of mouse 1. The average maximum principal strain and the average maximum shear strain (averaged over the axonal compartments of all 6 AL) were 7.9% and 6.8% lower than using the boundary condition extracted from the average displacement field of 14 specimens.
3.5.4. Effects of the out-of-plane boundary conditions
The out-of-plane component of the DVC displacements exhibited greater specimen-to-specimen variability than the in-plane components. Moreover, the DVC displacements were measured using fluorescent markers of the astrocytic processes. Thus the resolution of the strain field was too coarse to capture the strain variations in the axonal components. However, we interpolated the out-of-plane DVC displacement field to the axonal compartments to provide boundary conditions for the anterior and posterior surfaces of the FE models of the AL. To examine the effect of the out-of-plane boundary conditions, we created two additional sets of FE models for all 6 ALs. Both sets had a traction-free boundary condition on the posterior surface. One set of models had a traction-free boundary condition on the anterior surface, and the other had a 20 mmHg pressure boundary on the anterior surface, representing the applied pressure increase in the inflation tests.
Applying a pressure of 20mmHg on the anterior surface instead of the DVC z-displacements resulted in an average 0.6% lower Exx, 0.6% lower Eyy and 1.2% higher Ezz in astrocytic processes. For the model with the traction-free boundary condition on the anterior and posterior surfaces, the strains were 3.3% lower in Exx, 3.7% lower for Eyy, and 1.7% lower for Ezz than those in the baseline models (Supplemental Fig. S5). These results showed that the in-plane boundary displacement conditions, imposed by the scleral hoop stresses, were more significant than the boundary conditions in the z-direction for the astrocytic processes. The pressure boundary condition did result in 3.1%, 2.9%, 7.2% and 12.7% larger Emax, Exx, Eyy and γmax in the axonal compartments.
3.5.5. Effects of Young’s modulus of the astrocyte cytoskeletal filaments
We evaluated the effects of decreasing Young’s modulus Eactin and EGFAP by a factor of 10 while keeping EAC unchanged on the normal strain components of the astrocyte processes for the 6 FE models. Reducing Young’s modulus of actin and GFAP by 10 times increased the magnitude of Exx by 0.6%, Eyy by 0.2%, and Ezz by 0.5%. The strains in the astrocytic processes were insensitive to the Young’s modulus of the constituent materials because displacement boundary conditions were applied to all the surfaces of the AL model and the astrocytic processes comprised 85% of the volume of the AL. As a result, decreasing Young’s modulus of the astrocyte cytoskeletal filaments only decreased the magnitude of Exx, Eyy, Ezz and γmax in the axonal compartments by 1.4%, 1.7%,0.4% and 1.6% respectively (Supplemental Fig. S2).
Altogether, the results indicate that the in-plane displacement boundary conditions and the Poisson’s ratio had a greater influence on the strains in the astrocytic processes than the other factors examined here.
3.6. Relationship between structural features and strain response in axonal compartments
Gaussian process regression (GPR) (Williams and Rasmussen, 2006) was used to analyze the statistical correlations between structural features and the 8 strain outcomes of the axonal compartments from the 6 FE models. Four structure-strain models had an R2 larger than 0.70. The structure-strain models for γmax had the best fit to the FE models (R2 = 0.84), followed by Exx (R2 = 0.83), Eyy (R2 = 0.77), and Emax (R2 = 0.75, all p < 0.001 Table 5, Fig. 10).
Table 5:
The goodness of fit (R2), p-value (p), signal variance (sf), and length scale log(ln) for the structure-strain models with R2 > 0.70. A high R2 indicates that the structure-strain model was able to predict the strain outcomes of the FE simulations. A smaller sf indicates less variance of the outcome from the mean function fit by the structure-strain model. The length scale ln represents the sensitivity of the output to changes in that structural input. The most sensitive structural feature with the lowest log(ln) for each structure-strain model (column) was highlighted.
| Emax | Exx | Eyy | γ max | ||
|---|---|---|---|---|---|
| Goodness of fit | Correlation R 2 | 0.75 | 0.83 | 0.77 | 0.84 |
| p–value | <0.001 | <0.001 | <0.001 | <0.001 | |
| Signal Variance | s f | 0.18 | 0.16 | 0.08 | 0.08 |
| log(l n ) for each AC structural output | Area | −0.31 | −0.71 | −0.48 | −0.67 |
| Aspect ratio | 0.72 | 0.19 | 0.45 | 0.38 | |
| Orientation | 0.29 | 0.25 | −0.09 | −0.03 | |
| % Distance to centroid | 1.30 | 0.61 | 0.67 | 1.48 | |
| % GFAP in surrounding box | 0.22 | 1.56 | 0.59 | 0.75 | |
| % Actin in surrounding box | 1.49 | 1.13 | 1.47 | 1.16 | |
| log(l n ) for each AL structural output | Area | 2.92 | 3.33 | 2.00 | 0.48 |
| Aspect ratio | 0.57 | 0.74 | 2.20 | 2.29 | |
| Axonal fraction | 2.83 | 2.53 | 0.76 | 0.83 | |
| GFAP fraction | 0.84 | 1.35 | 0.30 | 2.16 | |
| Actin fraction | 2.48 | 0.82 | 2.06 | 0.92 |
Fig. 10:

The effect of structural features on the pressure-induced strains in the axonal compartments from the GPR structure-strain fit to the 6 FE models of the AL. (a) Emax increased by more than 14 times as area of the axonal compartment increased by 21 times. (b) Orienting the major axis of the axonal compartments to the 90° IS axis instead of the 0° NT axis increased Exx by 231% but (c) decreased Eyy by 160%. (d) Increasing local actin area fraction from 41% to 90% decreased Emax by 187%. (e) Axonal compartments that were closest to the center of the AL experienced 16% higher γmax than those that were at the boundary of the AL. (f) Axonal compartments in a 21% larger AL experienced 42% larger γmax.
The strain outcomes were most sensitive to changes in the area of the axonal compartments, as indicated by the smallest log(ln) in Table 5, followed by the orientation and aspect ratio of the axonal compartment. Increasing the area of the axonal compartment by 21 times while keeping other structural features unchanged increased Emax by more than 14 times (Table 6, Fig. 10a). Orienting the major axis of the axonal compartments to the y (90°) axis instead of the x (0°) axis increased Exx by 231% (Fig. 10b) but decreased Eyy by 160% (Fig. 10c). For axonal compartments that are horizontally aligned, the strains varied little with the aspect ratio for aspect ratios ranging from 1–4. However, Emax and Exx decreased while Eyy and γmax increased as the aspect ratio increased from 4–6 (Supplemental Fig. S11f–S14f). Increasing the actin area fraction in the 15 × 15 μm2 area surrounding the axonal compartments from 41% to 90% decreased Emax, Exx and Eyy, and γmax in the axonal compartments by 187%, 360%, 42%, and 240%, respectively (Fig. 10d & Supplemental Fig. S12d–S14d). There was also a decreasing trend in strain for axonal compartments further away from the center of the AL. However, the strain response was not as sensitive to the location of the axonal compartment as to the area and the orientation of the axonal compartment (Table 5, Fig. 10e). The local GFAP area fraction did not show a consistent trend (Supplemental Fig. S11e–S14e). The Emax decreased with increasing local GFAP fraction in the range of 0–0.2, but was insensitive to the local GFAP areas fraction for higher fractions. In comparison, Exx, Eyy, and γmax showed less variation with the local GFAP area fraction.
Table 6:
The sensitivity of the strain outcomes to changes in each structural feature, showing the absolute percentage change between the minimum and maximum outcome predicted from each structure-strain model as the input structural features varied from its minimum to its maximum value.
| Structural features | E max | E xx | E yy | γ max | |
|---|---|---|---|---|---|
| Axonal Compartment | Area | 1376.9 % | 1683.2 % | 549.1 % | 847.8 % |
| Aspect ratio | 716.4% | 1733.2 % | 367.1 % | 124.5 % | |
| Orientation | 98.0 % | 230.8 % | 160.1 % | 82.2 % | |
| Normalized distance to AL center | 17.2 % | 161.5 % | 39.8 % | 16.3 % | |
| Local GFAP area fraction | 210.6 % | 120.7 % | 75.2 % | 28.0 % | |
| Local actin area fraction | 186.6 % | 360.0 % | 42.0 % | 239.9 % | |
| Astrocytic Lamina | Area | 0.1 % | 0.02 % | 0.9% | 42.1 % |
| Aspect ratio | 42.9 % | 8.9% | 0.4% | 0.3 % | |
| Axonal fraction | 0.1 % | 0.2% | 29.7 % | 10.1 % | |
| GFAP fraction | 12.1 % | 16.0 % | 41.3 % | 0.7 % | |
| Actin fraction | 0.3 % | 35.5 % | 0.9% | 19.8 % |
In general, the strains in the axonal compartments were more sensitive to the structural features of the axonal compartment than of the AL. The log(ln) in Table 5 for the global AL features were generally larger than for the local features of the axonal compartments. To eliminate the effects of variation in the AL structural features, we also applied structure-strain analysis to analyze the statistical correlations between the 6 structural features of the axonal compartments and the axonal strains for the FE model of the AL of mouse 1 only. The structure-strain analysis for the AL model of mouse 1 also showed that the strains were more sensitive to the area, orientation, and aspect ratio of the axonal compartments. Fig. 11 plots the variation of Emax, γmax, Exx and Eyy with the structural features of the axon compartments for the AL model of mouse 1 and the sensitivity analysis for the four strain components are given in Supplemental Table S3–S5. In general, the structure-strain relationship obtained for the AL model of mouse 1 showed similar trends and ranges of variation as those obtained from the structure-strain analysis of the 6 AL models. Finally, to examine the effect of the in-plane boundary conditions, we performed the structure strain analysis for the AL model of mouse 1 that extracted the in-plane boundary conditions from 1 inflation tested specimen rather than from the average of 14 specimens (Sec. 3.5.3). As shown in the supplemental Fig. S15, the structure-strain analysis for the simulation of mouse 1 using the boundary conditions of a single AL specimen was similar to that from FE models using average in-plane boundary conditions.
Fig. 11:

The effect of structural features on the strains in the axonal compartments from GPR structure-strain fit to the FE model of the AL of mouse 1. (a) Emax increased by 4.8 times as the area of the axonal compartment increased by 16 times. (b) Orienting the major axis of the axonal compartments to the 90° IS axis instead of the 0° NT axis increased Exx by 245% but (c) decreased Eyy by 148%. (d) Increasing local actin area fraction from 52% to 87% decreased Emax by 98%. (e) Axonal compartments that were closest to the center of the AL experienced 53% higher γmax than those that were at the boundary of the AL.
We applied structure-strain analysis to analyze the statistical correlations between the structural variables and strains in the axon compartments of the 6 incompressible FE models of the AL to examine the effect of incompressibility. The results were similar to those obtained for the structure-strain analysis of the baseline compressible FE models (Fig. 12). The strains were most sensitive to the area and orientation of the axonal compartments. Fig. 12 plots the variation of Emax, γmax, Exx and Eyy with the structural features of the axon compartments for incompressible models, and the results of the sensitivity analysis are given in Supplemental Table S6–S8. The structure-strain relationships for the incompressible models of the AL were similar to those of the baseline compressible models. The Emax for the incompressible model also increased with the area of the axonal compartments but the relationship for the incompressible model showed greater fluctuations.
Fig. 12:

The effect of structural features on the pressure-induced strains and stresses in the axonal compartments from the GPR structure-strain fit to the 6 incompressible FE models AL. (a) Emax increased by more than 21 times as the area of the axonal compartment increased by 21 times. (b) Orienting the major axis of the axonal compartments to the 90° IS axis instead of the 0° NT axis increased Exx by 606% but (c) decreased Eyy by 362%. (d) Increasing local actin area fraction from 41% to 90% decreased Emax by 137%. (e) Axonal compartments that were closest to the center of the AL experienced 13% higher γmax than those that were at the boundary of the AL. (f) Axonal compartments in a 21.4% larger AL experienced 3.2% larger γmax.
Structure-strain analysis was also performed for AL models with 20mmHg boundary conditions. The structure-strain relationships were similar to those of the baseline compressible models (Supplemental Fig. S5, Supplemental Table S9–11).
4. Discussion
In this study, we applied experimentally-informed FE models of the mouse AL and GPR to analyze the effects of structural features on the mechanical responses in the axonal compartments. Our approach differs from previous modeling approaches for the human and monkey lamina cribrosa in that we reconstructed the boundary conditions of the mouse AL from the displacement fields measured using DVC in prior inflation tests of the ALs (Korneva et al, 2020). The Young’s modulus for all the materials in the AL was obtained from AFM measurements in the literature. The LC of humans, monkeys, sheep, and other large mammals contains a collagenous LC, and previous multi-scale modeling studies of the LC have represented explicitly represented connective tissue LC beams, but treated the neural tissue in the LC pores as a homogenized material (Roberts et al, 2009; Grytz et al, 2016; Voorhees et al, 2017a,b, 2020; Karimi et al, 2021; Downs et al, 2009). These studies examined the effects of the material parameters of the sclera, LC beams, LC pores, and the structural features of the LC, beams, and pores on the distribution of stresses and strains in the beams and pores. The lack of connective tissues in the mouse AL allowed us to examine for the first time the mechanical responses of the axonal compartments and the astrocyte processes within the neural tissue separately.
All stress components in the axonal compartments were significantly lower than in the stiffer astrocytic processes, while all the strain components except the near zero Exz and Eyz, were larger in the axonal compartments than in the astrocytic processes. The average strains Emax and γmax in the axonal compartments were more than 5 times higher than those in the astrocyte processes. Previous multiscale studies of the LC likewise showed that the stresses were significantly lower and strains significantly higher in the neural tissues of the LC pores than in the stiffer connective tissues of the LC beams (Voorhees et al, 2017b; Karimi et al, 2021). The average Emax of 26% in the axonal compartments in this study was higher than the previously reported range of 10–20% in the studies of the LC when axons and astrocytes were grouped as a uniform material (Voorhees et al, 2017a; Sigal et al, 2009a).
Our study showed that the level of strains varied with the local structural features. The structure-strain analysis showed that the maximum principal strain fluctuated with the area of the axonal compartment, but showed an overall nonlinear increasing trend with increasing area of the axonal compartment over the wide range found in the 6 AL specimens. The analysis also showed significant nonlinear relationships between the aspect ratio of the axonal compartments and the strains. The computational studies of Voorhees et al (2017a) applied multivariate linear regression analysis the study the relationship between the structure and strain of the neural tissues in the LC pore. They showed that the peak tensile strain (similar to the Emax outcome of this study) decreased with increasing pore area and decreased with an increasing aspect ratio of the pores. The differences in the trends may be caused by differences in the range of the pore/axon areas examined in the study and by using a nonlinear versus linear statistical model.
The structure-strain analysis also showed that the orientation of the axonal compartments and local actin fraction had a significant effect on the axonal strain response. Axonal compartments with their major axis aligned along the superior-inferior direction of the AL were more likely to experience higher strains. A larger actin coverage around the axonal compartments decreased the strains in the axonal compartments. This suggested that stimulating actin polymerization around large axonal compartments may offer mechanical protection for the axons. The effect of the local actin area fraction was more dominant than the effect of the local GFAP area fraction because the elastic modulus of the actin cytoskeleton was assumed to be 8 times stiffer than the modulus of GFAP. The IOP-induced axonal damage often initiates in small local regions in the AL (Morrison et al, 1997) and is not uniform across the ON. The variations in strains in the axonal compartments due to variations in local structural features may explain why some axons are more susceptible to damage than others. Previous ex vivo inflation test in the human LC showed that regions with larger pore area fraction had larger strains (Ling et al, 2019). In glaucoma patients, the axonal loss was more prominent in the inferior-superior region, which corresponded to the region with larger pores (Quigley, 2015). Within the pores, axons with larger diameters had a lower survival rate (Kerrigan-Baumrind et al, 2000; Quigley et al, 1987). Within pores of the monkey ONH with experimental glaucoma, axons at the pore periphery were more likely to exhibit axonal transport blockade than those in the center of the pore (Quigley et al, 1980). Since structural features are more clinically accessible than strains or cellular responses, visualizing the LC and astrocytic structure could help predict regions that are more susceptible to axonal degeneration.
The strains and stresses also showed large variations in the astrocyte processes. The maximum principal strain Emax was higher in thin processes sandwiched between two axonal compartments than in thicker processes. In a previous study, we found a thinning of the processes after 3 days of IOP elevation (Ling et al, 2020), which likely resulted in higher strains in the processes. Persistent tensile strains in the astrocyte processes have been shown to cause elongation in the direction of stretch (Katiyar et al, 2017). Elongating and thinning of the processes could cause further enlargement of the size of the axonal compartments. In our previous study, we found that the area of the axonal compartments in the mouse AL increased after 3 days of IOP elevation (Ling et al, 2020). This is compatible with the known swelling of axons due to axonal transport blockade at the ONH. In normal ONH, axon cell membranes are in close contact with either other axons or with astrocyte processes, with minimal extracellular space. The model currently assumes that the axonal bundle remains in contact with the astrocytes processes and experiences high in-plane strain in response to IOP elevation. However, if there is a disease-specific alteration of the normal configuration of axons and astrocytes, the physiological support provided by the astrocyte processes may be altered.
There are many limitations of this modeling study. The study analyzed the biomechanics of the AL of only 6 mouse eyes. More specimens are needed to study the effects of AL structural features on the strain response in the axonal compartments and astrocytic processes. The GPR structure-strain analysis considers the axonal compartment of each AL as an independent sample; however, the strain field of the axonal compartments within an AL may be strongly correlated if they are sufficiently close to each other. With more samples, future studies can employ a multilevel modeling approach to account for the dependencies between the strain outcomes of axonal compartments for the same AL.
This initial study involves only 6 AL specimens, which makes it challenging to determine possible dependences of the axonal compartments of the same AL. We considered these possible dependencies by including the AL area, AL aspect ratio, the AL axonal fraction, local GFAP fraction, and local actin fraction in the GPR analysis of the structure-strain response of the axonal compartments. The results of the GPR analysis showed that the axonal strains were much more sensitive to the local structural features of the axonal compartment than to the global structural features of the AL. In future work, we plan to add more samples such that we can more rigorously account for the dependences of the axonal compartments of the same AL using a multi-level modeling approach.
To reduce the number of elements and make the simulations more tractable, the resolution of the fluorescent images was down-sampled by a factor of 9 to construct the FE model of the AL. This resulted in a coarser discretization of the structural features of the AL that may result generally in lower strain values in the axonal compartments. However, the variation in the strain and stress responses between the astrocyte processes and the axonal compartments had the same trend in the more detailed model created using the original image resolution. Thus, the same associations between strains and structural features should be obtained from the coarse and fine FE models.
To develop the specimen-specific FE models, the Hex8 element was selected for direct conversion from the pixels of AL images and to allow for direct comparison between measured structural properties of the axonal compartments and their mechanical responses. Hex8 element has been shown to cause element locking when the model experiences large deformation and bending, especially at the boundary between actin and the axonal compartments. Since the deformation in the in-plane direction was much larger than the deformation in the z-direction, the effect of stiffer elements was small. Moreover, volumetric locking was mitigated because a compressible material model was used. For simplicity, all materials were assumed to behave as compressible Neo-Hookean materials where their properties were extracted from literature.
The Poisson’s ratio of the materials was selected to fit the average z-strain measured from ex vivo inflation tests. The resulting Poisson’s ratio of 0.2 suggests that AL, which is composed of cells, axons, and blood vessels, is compressible. The low Poisson’s ratio of the tissue may be caused by poroelastic effects or by the compression of the blood vessels. The lower ratio could also be due to the condition of our ex vivo inflation test where water was allowed to escape from the cut surface of the tissue (Galle et al, 2010). The parametric study showed that the in-plane strains, the maximum principal strain, and the maximum shear strain in the astrocytic processes and axonal compartments were significantly less sensitive to the Poisson’s ratio than the out-of-plane normal strain. The results of the statistical comparisons between the strains and stresses in the axonal compartments and astrocytic processes were similar for ν = 0.2 and ν = 0.495.
A unique feature of the modeling study is that the displacement boundary conditions were obtained from the DVC displacement field of inflation-tested specimens. However, the inflation test used enucleated mouse eyes, and thus the boundary displacement field does not account for the effects of loading from the cerebrospinal fluid pressure.
The models also did not examine for variations through the thickness of the AL. The models were constructed based on 2D images that were projected to 3D, which simplified the 3D morphology of the axonal compartments and the AL. Deviation from the regular cylindrical shape of the axonal compartments may give rise to higher shear strains and stresses that were simulated in the model. However, these limitations should not alter the relative associations between structural properties and mechanical outcomes. The materials were also assumed to be isotropic. Incorporating the anisotropic behavior of the astrocytes and axons may alter the strain and stress states in the axonal compartment.
The FE simulations calculated the instantaneous response of the AL and its constituents to IOP elevation. The model did not describe the active remodeling of the astrocyte network and axons in response to IOP. Activated astrocytes showed upregulation of the intermediate filament genes GFAP and vimentin (Lajtha et al, 2007), which may increase the network stiffness. The astrocytes in the AL are hypothesized to be involved in mechanotransduction events leading to apoptosis of RGCs (Choi et al, 2015). It would be helpful to investigate the mechanical responses in the AL after a sustained IOP increase. Nevertheless, the presented methodology provides a tool for investigating the initial mechanical events in the axonal compartments following IOP elevation prior to the axonal degeneration in glaucoma.
5. Conclusion
This work estimated the strains and stresses in the axonal compartments and the astrocyte processes of the mouse AL using specimen-specific FE models of 6 specimens. The boundary conditions were determined from the displacement field measured by DVC in ex vivo inflation tests. The effect of the 6 structural features of the axonal compartments and the 5 structural features of the AL on the pressure-induced mechanical responses of the axonal compartments were investigated using GPR. The mechanical responses in the axonal compartments were influenced by the structural features as follows.
The IOP-induced strain responses were greater in the axonal compartments than in the astrocyte processes, while the stresses were lower in the axonal compartments when compared to the processes.
The strain and stress outcomes were most sensitive to changes in the area and the orientation of the axonal compartments. Larger axonal compartments that were closer to the center of the AL, more vertically aligned, and with lower local actin area fraction exhibited the highest strains.
Axonal compartments in larger ALs experienced lower strains when assigned the same boundary conditions in the FE models. However, the strain outcomes were more sensitive to changes in the local structural features of the axonal compartments compared to changes in the overall features of the AL.
Overall, the structure of the astrocyte network, and the shape and location of the axonal compartments in the AL affected the pressure-induced mechanical responses in the axonal compartments. Strains of the magnitude estimated here are sufficient to subject RGC axons to mechanically-induced injury.
Supplementary Material
Acknowledgments.
This work was supported by the National Institutes of Health EY 02120 (HQ); EY 01765 (Core facility grant, Wilmer Eye Institute); unrestricted donations to the Glaucoma Center of Excellence, Wilmer Eye Institute; the National Science Foundation Award 1727104 (TN); Brightfocus Foundation G2015132 (TN); and the Croucher Foundation (YTTL).
Footnotes
Supplementary Material. A supplemental document containing results from the sensitivity analyses of FE assumptions and model parameters, contour maps of strain and stress outcomes, and sensitivity analyses of the structure-strain models that were not included in the main manuscript are provided.
Availability of data and materials Data and results generated from this study are presented in detail in the supplemental materials.
Competing interests: Not application
References
- Bar-Kochba E, Toyjanova J, Andrews E, et al. (2015) A fast iterative digital volume correlation algorithm for large deformations. Exp Mech 55(1):261–274 [Google Scholar]
- Bellezza A, Hart R, Burgoyne C (2000) The optic nerve head as a biomechanical structure: initial finite element modeling. Invest Ophthalmol Vis Sci 41(10):2991–3000 [PubMed] [Google Scholar]
- Bonet J, Wood R (1997) Nonlinear continuum mechanics for finite element analysis. Cambridge university press [Google Scholar]
- Burgoyne C (2015) The morphological difference between glaucoma and other optic neuropathies. J Neuroophthalmol 35(0 1):S8. [DOI] [PMC free article] [PubMed] [Google Scholar]
- Campbell I, Coudrillier B, Mensah J, et al. (2015) Automated segmentation of the lamina cribrosa using frangi’s filter: a novel approach for rapid identification of tissue volume fraction and beam orientation in a trabeculated structure in the eye. J R Soc Interface 12(104):20141,009 [DOI] [PMC free article] [PubMed] [Google Scholar]
- Choi H, Sun D, Jakobs T (2015) Astrocytes in the optic nerve head express putative mechanosensitive channels. Mol Vis 21(July):749–766 [PMC free article] [PubMed] [Google Scholar]
- Coudrillier B, Boote C, Quigley H, et al. (2013) Scleral anisotropy and its effects on the mechanical response of the optic nerve head. Biomech Model Mechanobiol 12(5):941–963 [DOI] [PMC free article] [PubMed] [Google Scholar]
- D’Errico J (2021) inpaint nans. URL https://www.mathworks.com/matlabcentral/fileexchange/4551-inpaintnans
- Downs J, Roberts M, Burgoyne C, et al. (2009) Multiscale finite element modeling of the lamina cribrosa microarchitecture in the eye. In: 2009 Annual International Conference of the IEEE Engineering in Medicine and Biology Society, IEEE, pp 4277–4280 [DOI] [PMC free article] [PubMed] [Google Scholar]
- Edwards M, Good T (2001) Use of a mathematical model to estimate stress and strain during elevated pressure induced lamina cribrosa deformation. Curr Eye Res 23(3):215–225 [DOI] [PubMed] [Google Scholar]
- Elkington A, Inman C, Steart P, et al. (1990) The structure of the lamina cribrosa of the human eye: an immunocytochemical and electron microscopical study. Eye 4(1):42–57 [DOI] [PubMed] [Google Scholar]
- Feola A, Nelson E, Myers J, et al. (2018) The impact of choroidal swelling on optic nerve head deformation. Invest Ophthalmol Vis Sci 59(10):4172–4181. 10.1167/iovs.18-24463 [DOI] [PubMed] [Google Scholar]
- Forrester J, Dick A, McMenamin P, et al. (2020) The eye e-book: basic sciences in practice. Elsevier Health Sciences [Google Scholar]
- Galle B, Ouyang H, Shi R, et al. (2010) A transversely isotropic constitutive model of excised guinea pig spinal cord white matter. J Biomech 43(14):2839–2843 [DOI] [PubMed] [Google Scholar]
- Girard M, Downs J, Bottlang M, et al. (2009a) Peripapillary and posterior scleral mechanics-Part II: experimental and inverse finite element characterization. J Biomech Eng [DOI] [PMC free article] [PubMed] [Google Scholar]
- Girard M, Downs J, Burgoyne C, et al. (2009b) Peripapillary and posterior scleral mechanics-Part I: Development of an anisotropic hyperelastic constitutive model. J Biomech Eng [DOI] [PMC free article] [PubMed] [Google Scholar]
- Gordon M, Beiser J, Brandt J, et al. (2002) The Ocular Hypertension Treatment Study: Baseline factors that predict the onset of primary open-angle glaucoma. Arch Ophthalmol 120(6):714–720. 10.1001/archopht.120.6.714 [DOI] [PubMed] [Google Scholar]
- Grytz R, Meschke G, Jonas J (2011) The collagen fibril architecture in the lamina cribrosa and peripapillary sclera predicted by a computational remodeling approach. Biomech Model Mechanobiol 10(3):371–382 [DOI] [PubMed] [Google Scholar]
- Grytz R, Meschke G, Jonas JB, et al. (2016) Glaucoma and Structure-Based Mechanics of the Lamina Cribrosa at Multiple Scales, Springer US, Boston, MA, pp 93–122 [Google Scholar]
- Guzman C, Jeney S, Kreplak L, et al. (2006) Exploring the mechanical properties of single vimentin intermediate filaments by atomic force microscopy. J Mol Biol 360(3):623–630 [DOI] [PubMed] [Google Scholar]
- Hua Y, Tong J, Ghate D, et al. (2017) Intracranial pressure influences the behavior of the optic nerve head. J Biomech Eng 139(3). 10.1115/1.4035406 [DOI] [PubMed] [Google Scholar]
- Hua Y, Lu Y, Walker J, et al. (2022) Eye-specific 3d modeling of factors influencing oxygen concentration in the lamina cribrosa. Exp Eye Res p 109105. [DOI] [PMC free article] [PubMed] [Google Scholar]
- Investigators TA (2000) The advanced glaucoma intervention study (agis): 7. the relationship between control of intraocular pressure and visual field deterioration. Am J Ophthalmol 130:429–440 [DOI] [PubMed] [Google Scholar]
- Janmey P, Euteneuer U, Traub P, et al. (1991) Viscoelastic properties of vimentin compared with other filamentous biopolymer networks. J Cell Biol 113(1):155–160 [DOI] [PMC free article] [PubMed] [Google Scholar]
- Karimi A, Rahmati S, Grytz R, et al. (2021) Modeling the biomechanics of the lamina cribrosa microstructure in the human eye. Acta Biomater 134:357–378 [DOI] [PMC free article] [PubMed] [Google Scholar]
- Katiyar K, Winter C, Struzyna L, et al. (2017) Mechanical elongation of astrocyte processes to create living scaffolds for nervous system regeneration. J Tissue Eng Regen Med 11(10):2737–2751 [DOI] [PMC free article] [PubMed] [Google Scholar]
- Kerrigan-Baumrind L, Quigley H, Pease M, et al. (2000) Number of ganglion cells in glaucoma eyes compared with threshold visual field tests in the same persons. Invest Ophthalmol Vis Sci 41(3):741–748 [PubMed] [Google Scholar]
- Korneva A, Kimball E, Jefferys J, et al. (2020) Biomechanics of the optic nerve head and peripapillary sclera in a mouse model of glaucoma. J R Soc Interface 17(173):20200,708. 10.1098/rsif.2020.0708 [DOI] [PMC free article] [PubMed] [Google Scholar]
- Lajtha A, Galoyan A, Besedovsky H (2007) Handbook of neurochemistry and molecular neurobiology: neuroimmunology. Springer Science & Business Media [Google Scholar]
- Leske M, Connell A, Wu SY, et al. (2001) Incidence of open-angle glaucoma: the barbados eye studies. Arch Ophthalmol 119(1):89–95 [PubMed] [Google Scholar]
- Ling Y, Shi R, Midgett D, et al. (2019) Characterizing the collagen network structure and pressure-induced strains of the human lamina cribrosa. Invest Ophthalmol Vis Sci 60(7):2406–2422 [DOI] [PMC free article] [PubMed] [Google Scholar]
- Ling Y, Pease M, Jefferys J, et al. (2020) Pressure-induced changes in astrocyte gfap, actin, and nuclear morphology in mouse optic nerve. Invest Ophthalmol Vis Sci 61(11):14–14 [DOI] [PMC free article] [PubMed] [Google Scholar]
- Maas S, Ellis B, Ateshian G, et al. (2012) FEBio: Finite elements for biomechanics. J Biomech Eng 134(1). 10.1115/1.4005694 [DOI] [PMC free article] [PubMed] [Google Scholar]
- Midgett D, Pease M, Jefferys J, et al. (2017) The pressure-induced deformation response of the human lamina cribrosa: analysis of regional variations. Acta Biomater 53:123–139 [DOI] [PMC free article] [PubMed] [Google Scholar]
- Minckler D, Tso M, Zimmerman L (1976) A light microscopic, autoradiographic study of axoplasmic transport in the optic nerve head during ocular hypotony, increased intraocular pressure, and papilledema. Am J Ophthalmol 82(5):741–757. 10.1016/0002-9394(76)90012-X [DOI] [PubMed] [Google Scholar]
- Moerman K (2018) Gibbon: the geometry and image-based bioengineering add-on. J Open Source Softw 3(22):506 [Google Scholar]
- Morrison J, Moore C, Deppmeier L, et al. (1997) A rat model of chronic pressureinduced optic nerve damage. Exp Eye Res 64(1):85–96. 10.1006/exer.1996.0184 [DOI] [PubMed] [Google Scholar]
- Nguyen C, Midgett D, Kimball E, et al. (2017) Measuring deformation in the mouse optic nerve head and peripapillary sclera. Invest Ophthalmol Vis Sci 58(2):721–733 [DOI] [PMC free article] [PubMed] [Google Scholar]
- Nguyen C, Midgett D, Kimball E, et al. (2018) Age-Related Changes in Quantitative Strain of Mouse Astrocytic Lamina Cribrosa and Peripapillary Sclera Using Confocal Microscopy in an Explant Model. Investigative Ophthalmology & Visual Science 59(12):5157–5166 [DOI] [PMC free article] [PubMed] [Google Scholar]
- Otsu N (1979) A threshold selection method from gray-level histograms. IEEE Trans Syst Man Cybern 9(1):62–66 [Google Scholar]
- Quigley H (2015) The contribution of the sclera and lamina cribrosa to the pathogenesis of glaucoma: diagnostic and treatment implications. Prog Brain Res 220:59–86 [DOI] [PubMed] [Google Scholar]
- Quigley H, Flower R, Addicks E, et al. (1980) The mechanism of optic nerve damage in experimental acute intraocular pressure elevation. Invest Ophthalmol Vis Sci 19(5):505–517 [PubMed] [Google Scholar]
- Quigley H, Addicks E, Green W, et al. (1981) Optic nerve damage in human glaucoma: Ii. the site of injury and susceptibility to damage. Arch Ophthalmol 99(4):635–649 [DOI] [PubMed] [Google Scholar]
- Quigley H, Sanchez R, Dunkelberger G, et al. (1987) Chronic glaucoma selectively damages large optic nerve fibers. Invest Ophthalmol Vis Sci 28(6):913–920 [PubMed] [Google Scholar]
- Quigley H, McKinnon S, Zack D, et al. (2000) Retrograde axonal transport of bdnf in retinal ganglion cells is blocked by acute iop elevation in rats. Invest Ophthalmol Vis Sci 41(11):3460–3466 [PubMed] [Google Scholar]
- Rasmussen C (2003) Gaussian processes in machine learning. In: Summer school on machine learning, Springer, pp 63–71 [Google Scholar]
- Roberts M, Grau V, Grimm J, et al. (2009) Remodeling of the connective tissue microarchitecture of the lamina cribrosa in early experimental glaucoma. Invest Ophthalmol Vis Sci 50(2):681–690 [DOI] [PMC free article] [PubMed] [Google Scholar]
- Roberts M, Liang Y, Sigal I, et al. (2010) Correlation between local stress and strain and lamina cribrosa connective tissue volume fraction in normal monkey eyes. Invest Ophthalmol Vis Sci 51(1):295–307 [DOI] [PMC free article] [PubMed] [Google Scholar]
- Safa B, Read T, Ethier C (2021) Assessment of the viscoelastic mechanical properties of the porcine optic nerve head using micromechanical testing and finite element modeling. Acta Biomater 134:379–387 [DOI] [PMC free article] [PubMed] [Google Scholar]
- Sander E, Downs J, Hart R, et al. (2006) A cellular solid model of the lamina cribrosa: mechanical dependence on morphology. J Biomech Eng [DOI] [PubMed] [Google Scholar]
- Schindelin J, Arganda-Carreras I, Frise E, et al. (2012) Fiji: an open-source platform for biological-image analysis. Nat Methods 9(7):676. [DOI] [PMC free article] [PubMed] [Google Scholar]
- Schwaner S, Perry R, Kight A, et al. (2021) Individual-specific modeling of rat optic nerve head biomechanics in glaucoma. J Biomech Eng 143(4) [DOI] [PMC free article] [PubMed] [Google Scholar]
- Sigal I, Flanagan J, Tertinegg I, et al. (2004) Finite element modeling of optic nerve head biomechanics. Invest Ophthalmol Vis Sci 45(12):4378–4387. 10.1167/iovs.04-0133 [DOI] [PubMed] [Google Scholar]
- Sigal I, Flanagan J, Ethier C (2005) Factors influencing optic nerve head biomechanics. Invest Ophthalmol Vis Sci 46(11):4189–4199. 10.1167/iovs.05-0541 [DOI] [PubMed] [Google Scholar]
- Sigal I, Flanagan J, Tertinegg I, et al. (2009a) Modeling individual-specific human optic nerve head biomechanics. Part I: IOP-induced deformations and influence of geometry. Biomech Model Mechanobiol 8(2):85–98 [DOI] [PubMed] [Google Scholar]
- Sigal I, Flanagan J, Tertinegg I, et al. (2009b) Modeling individual-specific human optic nerve head biomechanics. Part II: influence of material properties. Biomech Model Mechanobiol 8(2):99–109 [DOI] [PubMed] [Google Scholar]
- Voorhees A, Jan NJ, Austin M, et al. (2017a) Lamina cribrosa pore shape and size as predictors of neural tissue mechanical insult. Invest Ophthalmol Vis Sci 58(12):5336–5346 [DOI] [PMC free article] [PubMed] [Google Scholar]
- Voorhees A, Jan NJ, Sigal I (2017b) Effects of collagen microstructure and material properties on the deformation of the neural tissues of the lamina cribrosa. Acta Biomaterialia 58:278–290 [DOI] [PMC free article] [PubMed] [Google Scholar]
- Voorhees A, Hua Y, Brazile B, et al. (2020) So-called lamina cribrosa defects may mitigate iop-induced neural tissue insult. Invest Ophthalmol Vis Sci 61(13):15–15. 10.1167/IOVS.61.13.15 [DOI] [PMC free article] [PubMed] [Google Scholar]
- Wang B, Hua Y, Brazile B, et al. (2020) Collagen fiber interweaving is central to sclera stiffness. Acta Biomater 113:429–437 [DOI] [PMC free article] [PubMed] [Google Scholar]
- Williams C, Rasmussen C (2006) Gaussian processes for machine learning, vol 2. MIT press; Cambridge, MA [Google Scholar]
- Zhang L, Albon J, Jones H, et al. (2015) Collagen microstructural factors influencing optic nerve head biomechanics. Invest Ophthalmol Vis Sci 56(3):2031–2042 [DOI] [PubMed] [Google Scholar]
- Zhang Y, Abiraman K, Li H, et al. (2017) Modeling of the axon membrane skeleton structure and implications for its mechanical properties. PLoS Comput Biol 13(2):1–22. 10.1371/journal.pcbi.1005407 [DOI] [PMC free article] [PubMed] [Google Scholar]
- Zhuo L, Sun B, Zhang C, et al. (1997) Live astrocytes visualized by green fluorescent protein in transgenic mice. Dev Biol 187(1):36–42 [DOI] [PubMed] [Google Scholar]
- Zuiderveld K (1994) Contrast limited adaptive histogram equalization. Graphics gems pp 474–485 [Google Scholar]
Associated Data
This section collects any data citations, data availability statements, or supplementary materials included in this article.