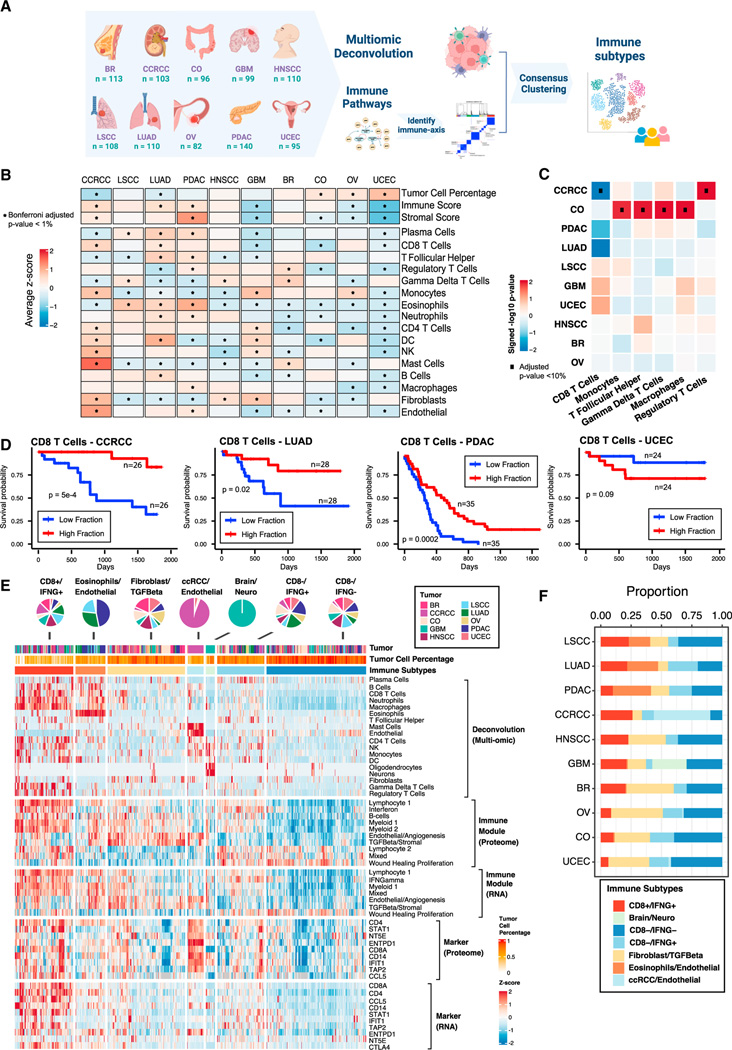
Figure 1. Derivation of immune subtypes.
(A) Outline for the derivation of immune subtypes. First, multi-omic deconvolution was performed based on proteomics and RNA-seq to estimate cell type compositions in each tumor. In parallel, pathway scores of immune-related pathways derived based on proteomics were clustered to define 10 immune pathway modules. Finally, the estimated cell type fractions and the 10 immune module scores were integrated to cluster tumors into different immune subtypes.
(B) Heatmap showing, for each cancer, the average of tumor cell percentage, immune and stromal scores, and cell type fractions. Significant differential levels between cancers (Bonferroni’s adjusted p value < 1%) are highlighted with a (*) (STAR Methods).
(C) Association between cell type fractions and survival outcomes for each cancer. The heatmap displays p values (signed −log10 scale) from Cox-proportional hazard regression models. Associations significant at 10% FDR are displayed with black dots.
(D) Kaplan-Meier curves showing cancer-specific associations between fractions of CD8 T cells and patient survival outcomes. For each cancer, tumors with high and low fractions of CD8 T cells were derived using the 1st and the 3rd quartiles, respectively. p values from logrank test are reported.
(E) Heatmap showing, from top to bottom, (1) estimated cell type fractions by deconvolution analysis; (2 and 3) pathway scores of immune modules based on proteome and RNA, respectively; (4 and 5) protein and RNA expressions of cell type markers. The annotation track and the pie-plot on the top show the distribution of different tumors within immune subtypes.
(F) Bar plot showing the proportion of samples allocated to different immune subtypes within each cancer.

