Abstract
Purpose
The Surveillance, Epidemiology, and End Results (SEER) registry recently released Gleason score at the time of biopsy/TURP, which, for the first time, permits accurate assessment of the presentation and treatment of prostate cancer according to clinical factors at diagnosis.
Materials and Methods
The SEER database was used to identify men diagnosed with localized prostate cancer in 2010 who were assigned National Comprehensive Cancer Network (NCCN) risk based on clinical factors. We identified sociodemographic factors associated with having high-risk disease and analyzed the impact of these factors, along with NCCN risk, on local treatment.
Results
42,403 men were identified. 38% had low-risk, 40% had intermediate-risk, and 22% had high-risk disease. In multivariable analysis, patients who were older, non-White, non-married, or living in counties with higher poverty rates were more likely to be diagnosed with high-risk disease (all p < 0.05). Of the 38,634 men for whom prostate cancer was the first malignancy, 23% had no local treatment, 40% had prostatectomy, 36% had radiation treatment, and 1% had local tumor destruction (predominantly cryotherapy). In multivariable analysis, patients who were older, black, non-married, living in counties with higher poverty rates, or with low-risk disease were less likely to receive local treatment (all p < 0.05).
Conclusions
Our analysis provides information regarding the current clinical presentation and treatment of localized prostate cancer in the US. We found that nonwhite, older men, living in counties with higher poverty were more likely to be diagnosed with high-risk disease and less likely to receive local treatment.
Keywords: Prostate cancer, Gleason score, Prostate specific antigen, Healthcare disparities
Introduction
The introduction of prostate specific antigen (PSA) screening over the last several decades has resulted in an increased incidence of prostate cancer, such that it is now the leading cancer diagnosis among men in the United States (US)1. Moreover, PSA screening has impacted the clinical presentation of prostate cancer, with patients now presenting with predominantly localized, low-risk disease2–3. Nonetheless, accurate information regarding the current risk profile of localized prostate cancer patients in the US is lacking. Previous studies that have reported on the risk profile of localized prostate cancer patients have suffered from an inadequate number of patients and/or insufficient information regarding clinical prognostic factors that are used to risk-stratify patients. An understanding of prostate cancer risk groups is important as these are used to guide pretreatment evaluations and management recommendations and also to predict the likelihood of recurrence after treatment.
This past year, the National Cancer Institute Surveillance, Epidemiology, and End Results (SEER) cancer registry released prostate cancer data which, for the first time, separately reports individual patient clinical Gleason score (GS) at the time of biopsy/TURP4. Although the SEER database has been capturing individual patient GS since 2004, prior to 2010, only pathologic GS (i.e. GS at the time of prostatectomy) was reported for patients undergoing surgery. Clinical GS, along with the previously available clinical (c) tumor (T)-stage and pre-biopsy/treatment Prostate Specific Antigen (PSA) level, is required to accurately risk-stratify patients based on clinical factors at presentation. As the SEER database captures information from approximately 28% of the US population, this allows a unique opportunity to study the risk strata at diagnosis across sociodemographic groups and treatment selection according to clinical factors at diagnosis. In this study, we present updated date on the current clinical presentation and treatment of localized prostate cancer in the US. We hypothesize that extent of disease and treatment varies across sociodemographic groups.
Methods
The SEER database [“SEER 18 Regs Research Data + Hurricane Katrina Impacted Louisiana Cases, Nov 2012 Sub (1973–2010 varying)”] was queried using SEER*Stat software, version 8.0.4 to identify men ages 20 years old and above diagnosed in 2010 with microscopically confirmed prostate adenocarcinoma (ICD-O-3 morphology code 8140). As all patient information in the SEER database is de-identified, this study was exempt from institutional review board evaluation.
Data on age at diagnosis, race, marital status, SEER registry, county poverty level (year 2000, the most recent available), clinical T-stage (from clinical extension coding), N-stage, M-stage, GS on needle core biopsy/TURP, and pre-biopsy/treatment PSA value was extracted for all patients. Patients were classified as having localized (N0, M0), regional (N1, M0), or metastatic disease (M1) based on T-stage, N-stage, and M-stage at diagnosis. Those with localized prostate cancer were further categorized as low-(≤ cT2a, GS ≤ 6, and PSA < 10 ng/mL), intermediate-(cT2b-c, or GS 7, or PSA 10 – 20 ng/mL), or high-(≥ cT3, or GS ≥ 8, or PSA > 20 ng/mL) risk based on the National Comprehensive Cancer Network (NCCN) stratification scheme1. Patients with unknown T-stage, GS, or PSA were otherwise not risk stratified unless they had at least one high risk factor. Men with cT2 NOS were classified based on GS and PSA alone, a method shown to be reliable in a recent analysis5. Given the limited number of patients from Alaska and Rural Georgia, these were combined with those from Hawaii and Greater Georgia, respectively.
Among localized prostate cancer patients for whom prostate cancer was the first or only malignancy, we determined the type of local treatment received. Types of local treatment included no local treatment (with or without TURP), prostatectomy, external beam radiation, brachytherapy, combination external beam radiation and brachytherapy, radiation NOS, cryotherapy, high-intensity focused ultrasound, laser therapy, hyperthermia and other methods of local tumor destruction. The following categorizations of local treatment were used for the purposes of analysis: none (no local treatment with or without TURP), prostatectomy (with or without post-operative external beam radiation), radiation therapy (external beam radiation, brachytherapy, combination external beam radiation and brachytherapy, or radiation NOS), and local tumor destruction (cryotherapy, high-intensity focused ultrasound, laser therapy, hyperthermia, and other methods of local tumor destruction).
We calculated the proportion classified as having low, intermediate, and high NCCN risk as well as the proportion treated with no local treatment, prostatectomy, radiation therapy, and local tumor destruction according to the available patient demographic information. Chi-square analysis was performed to determine significant differences among groups of patients. We performed multivariate logistic regression analysis, including all available patient demographic information, to determine predictors of high-risk disease. Moreover, we performed multivariate logistic regression analysis, including all available patient demographic information along with NCCN risk category, to determine predictors of no local treatment (among all patients as well as subsets of patients according to NCCN risk). Sensitivity analyses were performed excluding patients classified as cT2 NOS and high risk patients with missing T-stage, GS, or PSA, to verify the conclusions of the multivariable analyses.
All statistical analyses were done at the 0.05 level of significance using SAS software version 9.3 (SAS Institute, Inc., Cary, NC).
Results
We identified 54,537 men diagnosed with prostate adenocarcinoma in 2010. Of these, 90% (48,978) had localized disease, 5% (2,655) had nodal or distant metastasis, while 5% (2,904) could not be classified. The characteristics of the 42,403 men (87% of those with localized disease) with sufficient information to be assigned NCCN risk are summarized in Table 1. The remaining 13% (12,134) patients with localized disease had insufficient information to be assigned NCCN risk.
Table 1.
Patient and tumor characteristics of 42,403 men with localized prostate cancer stratified by risk group.
| Low- Risk (n=16,171; 39.0%) |
Intermediate -Risk (n=16,990; 40.1%) |
High- Risk (n = 9,242; 20.8%) |
p-value# | ||||
|---|---|---|---|---|---|---|---|
| Age | < 0.001 | ||||||
| Median | 63 | 66 | 69 | ||||
| Range | 34–103 | 33–96 | 36–98 | ||||
|
| |||||||
| Race | < 0.001 | ||||||
| White | 11424 | 70.6% | 11746 | 69.1% | 6096 | 66.0% | |
| Black | 2059 | 12.7% | 2732 | 16.1% | 1500 | 16.2% | |
| Hispanic | 1354 | 8.4% | 1251 | 7.4% | 795 | 8.6% | |
| Asian/Pacific Islander | 653 | 4.0% | 743 | 4.4% | 488 | 5.3% | |
| Native American | 49 | 0.3% | 54 | 0.3% | 40 | 0.4% | |
| Other/Unknown | 632 | 3.9% | 464 | 2.7% | 323 | 3.5% | |
|
| |||||||
| Marital status | < 0.001 | ||||||
| Married | 11115 | 39.0% | 11530 | 67.9% | 5821 | 63.0% | |
| Not married | 3043 | 33.9% | 3690 | 21.7% | 2252 | 24.4% | |
| Unknown | 2013 | 40.7% | 1770 | 10.4% | 1169 | 12.6% | |
|
| |||||||
| County poverty rate | < 0.001 | ||||||
| Highest rate quartile | 3835 | 23.7% | 4177 | 24.6% | 2409 | 26.1% | |
| 3rd quartile | 3984 | 24.6% | 4014 | 23.6% | 2351 | 25.4% | |
| 2nd quartile | 4159 | 25.7% | 4313 | 25.4% | 2316 | 25.1% | |
| Lowest rate quartile | 4191 | 25.9% | 4484 | 26.4% | 2160 | 23.4% | |
| Unknown | 2 | 0.0% | 2 | 0.0% | 6 | 0.0% | |
|
| |||||||
| SEER Registry | < 0.001 | ||||||
| SF/Oakland | 982 | 6.1% | 890 | 5.2% | 503 | 5.4% | |
| Connecticut | 738 | 4.6% | 817 | 4.8% | 452 | 4.9% | |
| Detroit | 924 | 5.7% | 1332 | 7.8% | 524 | 5.7% | |
| Hawaii/Alaska | 183 | 1.1% | 224 | 1.3% | 143 | 1.5% | |
| Iowa | 489 | 3.0% | 709 | 4.2% | 404 | 4.4% | |
| New Mexico | 363 | 2.2% | 392 | 2.3% | 246 | 2.7% | |
| Seattle | 955 | 5.9% | 1059 | 6.2% | 537 | 5.8% | |
| Utah | 547 | 3.4% | 541 | 3.2% | 240 | 2.6% | |
| Atlanta | 600 | 3.7% | 727 | 4.3% | 302 | 3.3% | |
| San Jose-Monterey | 617 | 3.8% | 536 | 3.2% | 287 | 3.1% | |
| Los Angeles | 1337 | 8.3% | 1291 | 7.6% | 732 | 7.9% | |
| CA excluding SF/SJM/LA | 3379 | 20.9% | 3458 | 20.4% | 1949 | 21.1% | |
| Kentucky | 771 | 4.8% | 755 | 4.4% | 522 | 5.6% | |
| Louisiana | 1072 | 6.6% | 1080 | 6.4% | 644 | 7.0% | |
| New Jersey | 2041 | 12.6% | 1786 | 10.5% | 981 | 10.6% | |
| Greater/Rural Georgia | 1173 | 7.3% | 1393 | 8.2% | 776 | 8.4% | |
|
| |||||||
| PSA | < 0.001 | ||||||
| < 10 | 16171 | 100.0% | 12326 | 72.5% | 3462 | 37.5% | |
| 10 to 20 | 0 | 0.0% | 4664 | 27.5% | 1436 | 15.5% | |
| > 20 | 0 | 0.0% | 0 | 0.0% | 3561 | 38.5% | |
| Unknown | 0 | 0.0% | 0 | 0.0% | 783 | 8.5% | |
|
| |||||||
| Gleason score | < 0.001 | ||||||
| 2 to 6 | 16171 | 100.0% | 2740 | 16.1% | 913 | 9.9% | |
| 7 | 0 | 0.0% | 14250 | 83.9% | 1689 | 18.3% | |
| 8 to 10 | 0 | 0.0% | 0 | 0.0% | 6532 | 70.7% | |
| Unknown | 0 | 0.0% | 0 | 0.0% | 108 | 1.2% | |
|
| |||||||
| T-stage | < 0.001 | ||||||
| 1 | 12615 | 78.0% | 10977 | 64.6% | 4594 | 49.7% | |
| 2 | 3556 | 22.0% | 6013 | 35.4% | 3540 | 38.3% | |
| 3 | 0 | 0.0% | 0 | 0.0% | 937 | 10.1% | |
| 4 | 0 | 0.0% | 0 | 0.0% | 103 | 1.1% | |
| Unknown | 0 | 0.0% | 0 | 0.0% | 68 | 0.7% | |
Comparison across risk groups. Chi-square statistic for categorical variables and t-test for continuous variables.
SEER = Surveillance, Epidemiology, and End Results; NCCN = National Comprehensive Cancer Network; SF = San Francisco; CA = California; SJM = San Jose-Monterey; LA = Los Angeles
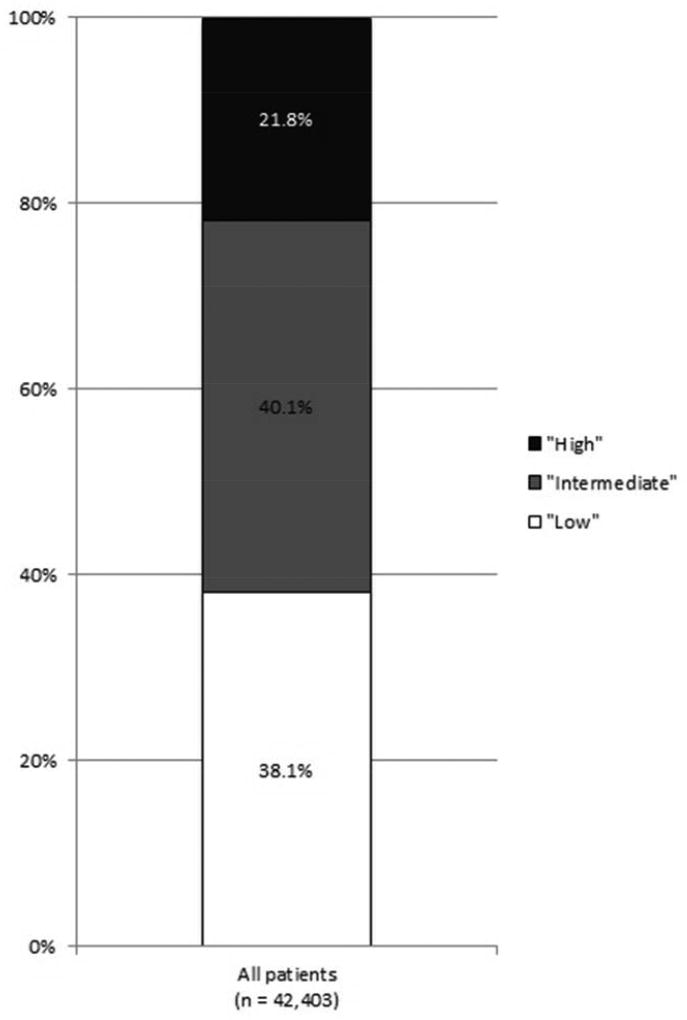
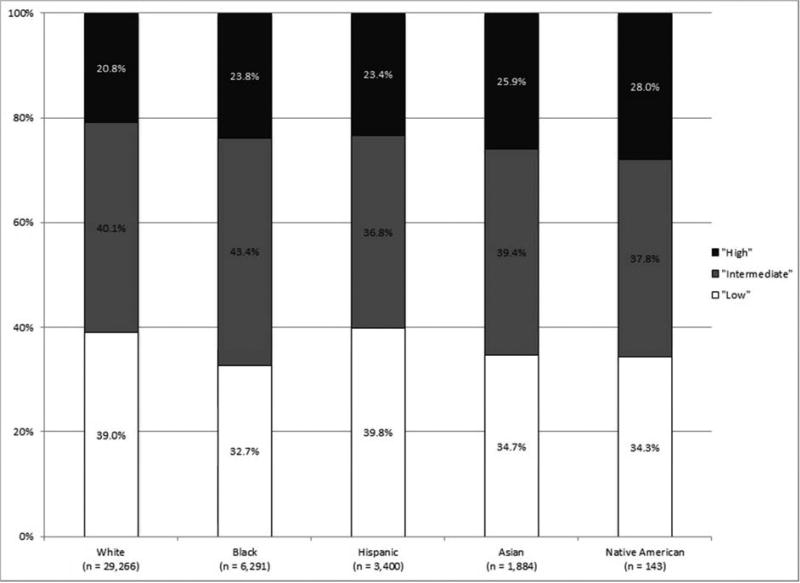
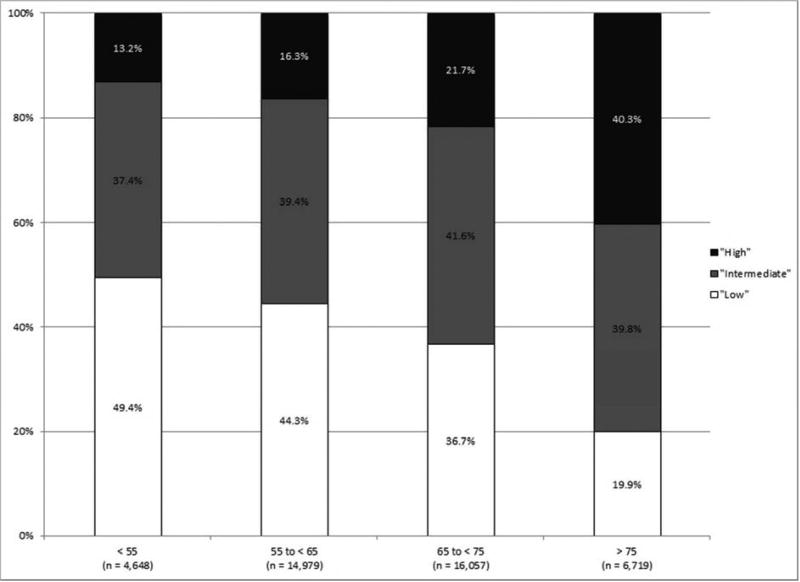
The median age at diagnosis was 65 years old; 69% (29,266) were white, 15% (6,291) were black, 8% (3,400) were Hispanic, 4% (1,884) were Asian/Pacific Islanders, and 0.3% (143) were Native American. In total, 38% (16,171) had low-risk, 40% (16,990) had intermediate-risk, and 22% (9,242) had high-risk disease. There was significant variation in NCCN risk by patient age, race/ethnicity, marital status, county poverty level and SEER registry (all p < 0.0001). Of note, 66% had non-palpable (cT1) disease, including 50% of men with high-risk disease. Of the 7,882 patients who were classified as cT2 NOS, 35% (2,721) had low-risk, 38% (2,982) had intermediate-risk, and 28% (2,179) had high-risk disease. Additionally, 9% (873) of the high-risk patients had missing T-stage, GS, or PSA. Risk group classification was driven primarily by GS; 84% of men with intermediate-risk disease had a GS of 7 and 71% of men with high-risk disease had a GS of 8–10. Of note, with use of pathologic instead of clinical GS in men undergoing prostatectomy, 7% of all patients would have an increase in NCCN risk and 3% would have a decrease in NCCN risk.
As shown in Figure 1, the incidence of high-risk disease varied according to race/ethnicity, with those of non-White race/ethnicity at greatest risk for high-risk disease. High-risk disease also increased with patient age, with a tripling of high-risk disease among those 75 years and older as compared to those less than 55 years old.
Figure 1.
NCCN risk stratification (A) for all patients, (B) by race/ethnicity, and (C) by age (all p < 0.001).
Multivariable analysis confirmed that older age, non-White race/ethnicity, non-married status, living in a county with a higher poverty level, and geographic location were independent predictors of high-risk disease (Table 2).
Table 2.
Sociodemographic factors associated with high-risk disease at presentation.
| % High-risk disease at presentation | Adjusted Odds Ratio (95% CI) | p-value# | |
|---|---|---|---|
|
| |||
| Age at diagnosis (per year increase) | 1.06 (1.06–1.07) | < 0.001 | |
|
| |||
| Race | |||
| White | 20.8% | [reference] | |
| Black | 23.8% | 1.42 (1.32–1.53) | < 0.001 |
| Hispanic | 23.4% | 1.23 (1.12–1.34) | < 0.001 |
| Asian/Pacific Islander | 25.9% | 1.35 (1.20–1.52) | < 0.001 |
| Native American | 28.0% | 1.44 (0.99–2.11) | 0.058 |
| Other/Unknown | 22.8% | 1.09 (0.95–1.24) | 0.232 |
|
| |||
| Marital status | |||
| Married | 20.4% | [reference] | |
| Not married | 25.1% | 1.30 (1.22–1.37) | < 0.001 |
| Unknown | 23.6% | 1.11 (1.03–1.20) | 0.009 |
|
| |||
| SEER Registry | |||
| CA excluding SF/SJM/LA | 21.2% | [reference] | |
| SF/Oakland | 22.5% | 0.95 (0.84–1.07) | 0.373 |
| Connecticut | 18.8% | 1.16 (1.02–1.32) | 0.021 |
| Detroit | 26.0% | 0.79 (0.70–0.89) | < 0.001 |
| Hawaii/Alaska | 25.2% | 1.04 (0.83–1.29) | 0.756 |
| Iowa | 24.6% | 1.29 (1.13–1.48) | < 0.001 |
| New Mexico | 21.1% | 1.09 (0.93–1.28) | 0.278 |
| Seattle | 18.1% | 1.06 (0.94–1.19) | 0.364 |
| Utah | 18.5% | 0.84 (0.72–0.98) | 0.029 |
| Atlanta | 19.9% | 0.86 (0.74–0.99) | 0.031 |
| San Jose-Monterey | 21.8% | 0.89 (0.76–1.03) | 0.119 |
| Los Angeles | 22.2% | 0.91 (0.81–1.02) | 0.111 |
| Kentucky | 25.5% | 1.32 (1.17–1.48) | < 0.001 |
| Louisiana | 23.0% | 0.97 (0.87–1.09) | 0.642 |
| New Jersey | 20.4% | 0.95 (0.86–1.05) | 0.295 |
| Greater/Rural Georgia | 23.2% | 1.05 (0.95–1.17) | 0.317 |
|
| |||
| County poverty rate | |||
| Lowest quartile | 19.9% | [reference] | |
| 2nd quartile | 21.5% | 1.02 (0.95–1.10) | 0.616 |
| 3rd quartile | 22.7% | 1.07 (0.99–1.16) | 0.093 |
| Highest quartile | 23.1% | 1.13 (1.03–1.24) | 0.01 |
Multivariate logistic regression model n = 42,393; men with unknown county poverty level (n = 10) were excluded.
SEER = Surveillance, Epidemiology, and End Results; NCCN = National Comprehensive Cancer Network; SF = San Francisco; CA = California; SJM = San Jose-Monterey; LA = Los Angeles
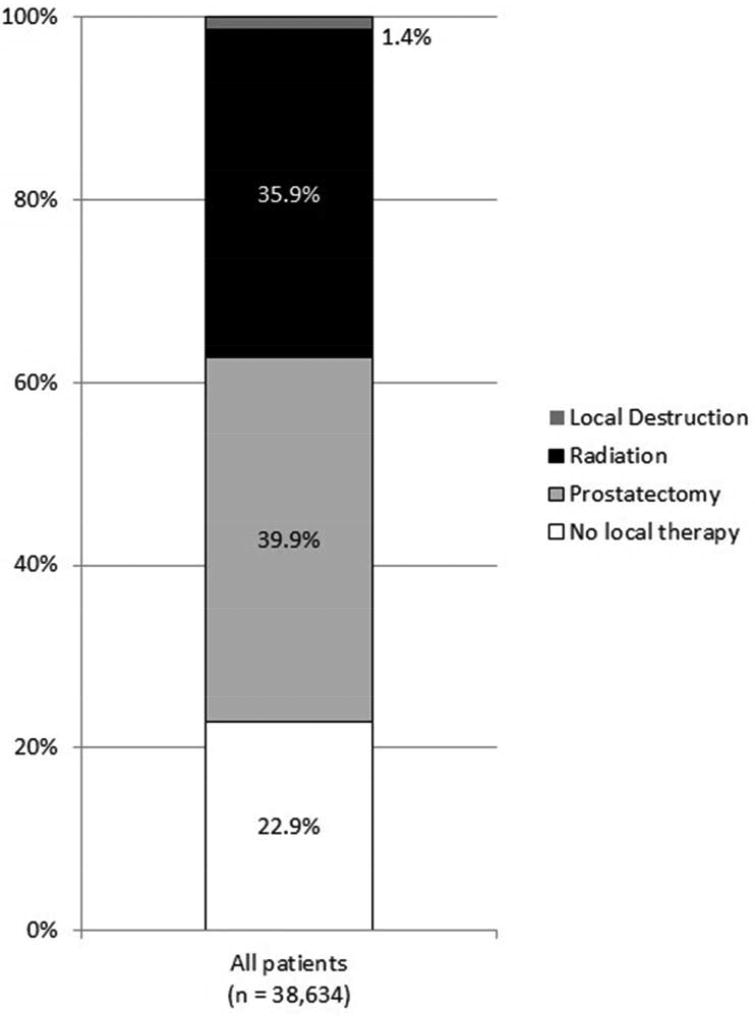
Altogether, 39,154 men did not have a history of prior malignancy. The characteristics of the 38,634 men (99%) for whom local treatment could be determined are summarized in Table 3. In total, 23% (8,832) received no local treatment, 40% (15,421) received prostatectomy, 36% (13,855) received radiation therapy, and 1% received local tumor destruction. Of those that received prostatectomy, 5% (694) received immediate post-operative external beam radiation. Of those that received radiation therapy as primary treatment, the majority (68%) received external beam radiation, while 20% received brachytherapy and 11% received combination external beam radiation and brachytherapy. Cryotherapy represented the majority (63%) of patients who underwent local tumor destruction. There was significant variation in local treatment by patient age, race/ethnicity, marital status, county poverty level, SEER registry, and NCCN risk category (all p < 0.0001).
Table 3.
Patient and tumor characteristics of 38,634 men with localized prostate cancer without primary malignancy stratified by type of local treatment.
| No local therapy (n=8,832; 22.9%) |
Prostatectomy (n=15,421; 39.9%) |
Radiation Therapy (n = 13,855; 35.9%) |
Local Destruction (n = 526; 1.4%) |
p-value# | |||||
|---|---|---|---|---|---|---|---|---|---|
| Age | < 0.001 | ||||||||
| Median | 65 | 61 | 68 | 70 | |||||
| Range | 33–103 | 33–90 | 37–99 | 43–93 | |||||
|
| |||||||||
| Race | < 0.001 | ||||||||
| White | 5673 | 64.2% | 11149 | 72.3% | 9135 | 65.9% | 372 | 70.7% | |
| Black | 1304 | 14.8% | 1969 | 12.8% | 2483 | 17.9% | 88 | 16.7% | |
| Hispanic | 689 | 7.8% | 1334 | 8.7% | 1153 | 8.3% | 35 | 6.7% | |
| Asian/Pacific Islander | 379 | 4.3% | 722 | 4.7% | 636 | 4.6% | 23 | 4.4% | |
| Native American | 45 | 0.5% | 48 | 0.3% | 40 | 0.3% | 1 | 0.2% | |
| Other/Unknown | 742 | 8.4% | 199 | 1.3% | 408 | 2.9% | 7 | 1.3% | |
|
| |||||||||
| Marital status | < 0.001 | ||||||||
| Married | 4593 | 52.0% | 11735 | 76.1% | 9242 | 66.7% | 371 | 70.5% | |
| Not married | 2050 | 23.2% | 2787 | 18.1% | 3242 | 23.4% | 114 | 21.7% | |
| Unknown | 2189 | 24.8% | 899 | 5.8% | 1371 | 9.9% | 41 | 7.8% | |
|
| |||||||||
| County poverty rate | < 0.001 | ||||||||
| Highest rate quartile | 2209 | 25.0% | 4027 | 26.1% | 3269 | 23.6% | 119 | 22.6% | |
| 3rd quartile | 2218 | 25.1% | 3740 | 24.3% | 3609 | 26.0% | 152 | 28.9% | |
| 2nd quartile | 2331 | 26.4% | 4022 | 26.1% | 3149 | 22.7% | 140 | 26.6% | |
| Lowest rate quartile | 2071 | 23.4% | 3630 | 23.5% | 3825 | 27.6% | 115 | 21.9% | |
| Unknown | 3 | 0.0% | 2 | 0.0% | 3 | 0.0% | 0 | 0.0% | |
|
| |||||||||
| SEER Registry | < 0.001 | ||||||||
| SF/Oakland | 681 | 7.7% | 654 | 4.2% | 804 | 5.8% | 15 | 2.9% | |
| Connecticut | 392 | 4.4% | 800 | 5.2% | 603 | 4.4% | 5 | 1.0% | |
| Detroit | 508 | 5.8% | 970 | 6.3% | 972 | 7.0% | 97 | 18.4% | |
| Hawaii/Alaska | 82 | 0.9% | 222 | 1.4% | 189 | 1.4% | 11 | 2.1% | |
| Iowa | 267 | 3.0% | 665 | 4.3% | 505 | 3.6% | 13 | 2.5% | |
| New Mexico | 308 | 3.5% | 347 | 2.3% | 277 | 2.0% | 3 | 0.6% | |
| Seattle | 631 | 7.1% | 1000 | 6.5% | 607 | 4.4% | 50 | 9.5% | |
| Utah | 359 | 4.1% | 477 | 3.1% | 363 | 2.6% | 36 | 6.8% | |
| Atlanta | 312 | 3.5% | 416 | 2.7% | 718 | 5.2% | 28 | 5.3% | |
| San Jose-Monterey | 328 | 3.7% | 418 | 2.7% | 570 | 4.1% | 4 | 0.8% | |
| Los Angeles | 611 | 6.9% | 1715 | 11.1% | 774 | 5.6% | 8 | 1.5% | |
| CA excluding SF/SJM/LA | 1862 | 21.1% | 3435 | 22.3% | 2550 | 18.4% | 121 | 23.0% | |
| Kentucky | 298 | 3.4% | 877 | 5.7% | 650 | 4.7% | 21 | 4.0% | |
| Louisiana | 672 | 7.6% | 950 | 6.2% | 902 | 6.5% | 33 | 6.3% | |
| New Jersey | 875 | 9.9% | 1540 | 10.0% | 1938 | 14.0% | 36 | 6.8% | |
| Greater/Rural Georgia | 646 | 7.3% | 935 | 6.1% | 1433 | 10.3% | 45 | 8.6% | |
|
| |||||||||
| NCCN Risk | < 0.001 | ||||||||
| Low | 4379 | 49.6% | 5964 | 38.7% | 4437 | 32.0% | 159 | 30.2% | |
| Intermediate | 2407 | 27.3% | 6396 | 41.5% | 5887 | 42.5% | 247 | 47.0% | |
| High | 2046 | 23.2% | 2521 | 16.3% | 3531 | 25.5% | 120 | 22.8% | |
Comparison across risk groups. Chi-square statistic for categorical variables and t-test for continuous variables
SEER = Surveillance, Epidemiology, and End Results; NCCN = National Comprehensive Cancer Network; SF = San Francisco; CA = California; SJM = San Jose-Monterey; LA = Los Angeles
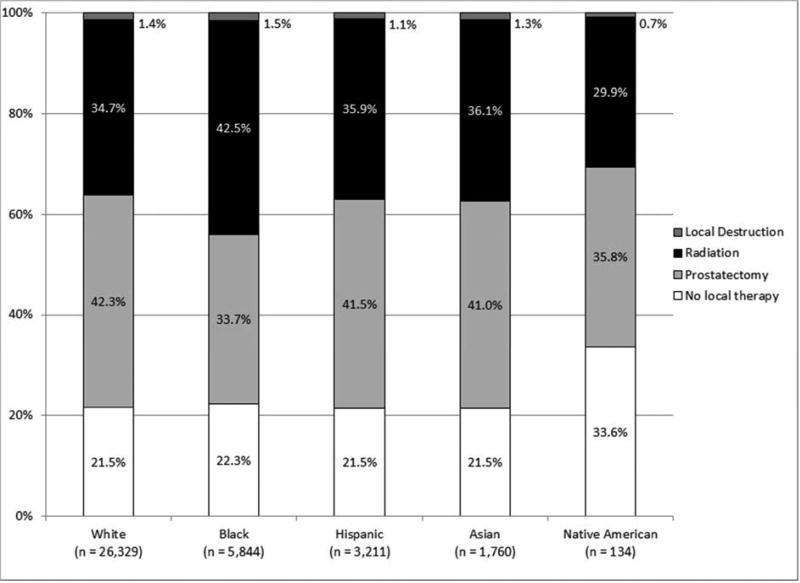
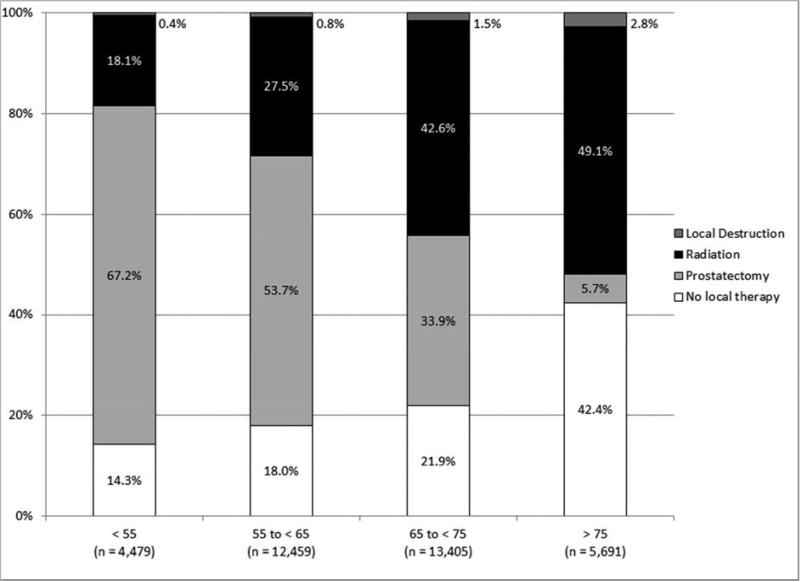
As shown in Figure 2, local treatment varied by race/ethnicity, with Whites most likely to undergo prostatectomy and blacks most likely to undergo radiation treatment. Moreover, the proportion of patients treated with prostatectomy declined with age whereas all other local treatment options increased with age.
Figure 2.
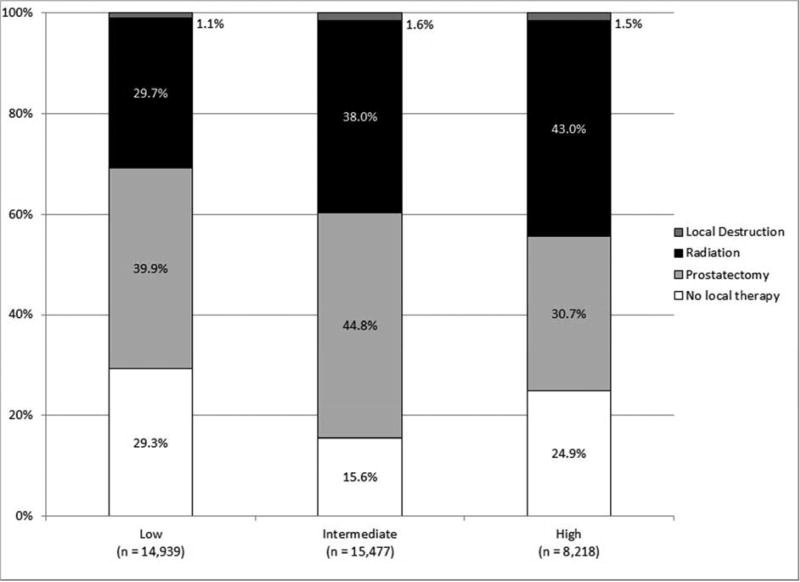
Local treatment (A) for all patients, (B) by race/ethnicity, (C) by age, and (D) by NCCN risk (all p < 0.001).
Finally, the proportion of patients receiving radiation treatment increased with NCCN risk and, interestingly, more intermediate risk patients received local treatment than those with high NCCN risk. As compared to high-risk patients who received treatment, those that did not receive treatment were older (median age 74 versus 67; p < 0.0001) and less likely to be white (58% versus 67%; p < 0.0001). Moreover, high-risk patients who did not receive treatment were less likely to have palpable disease on exam.
Multivariable analysis of all patients confirmed that older age, black race/ethnicity, non-married status, living in a county with a higher poverty level, geographic location and low NCCN risk were independent predictors of the lack of local treatment (Table 4). On subset analysis, age, race/ethnicity, marital status, and geographic location remained independent predictors of the lack of local treatment among the low, intermediate, and high-risk cohorts, although county poverty level did not reach statistical significance.
Table 4.
Sociodemographic and tumor factors associated with type of local treatment.
| % Receiving no local therapy | Adjusted Odds Ratio (95% CI) | p-value# | |
|---|---|---|---|
|
| |||
| Age at diagnosis (per year increase) | 1.07 (1.07–1.07) | < 0.001 | |
|
| |||
| Race | |||
| White | 21.5% | [reference] | |
| Black | 22.3% | 1.26 (1.16–1.36) | < 0.001 |
| Hispanic | 21.5% | 0.96 (0.87–1.06) | 0.416 |
| Asian/Pacific Islander | 21.5% | 1.02 (0.89–1.16) | 0.822 |
| Native American | 33.6% | 1.62 (1.10–2.41) | 0.016 |
| Other/Unknown | 54.7% | 2.93 (2.58–3.32) | < 0.001 |
|
| |||
| Marital status | |||
| Married | 17.7% | [reference] | |
| Not married | 25.0% | 1.67 (1.56–1.77) | < 0.001 |
| Unknown | 48.6% | 3.97 (3.69–4.27) | < 0.001 |
|
| |||
| SEER Registry | |||
| CA excluding SF/SJM/LA | 23.4% | [reference] | |
| SF/Oakland | 31.6% | 1.50 (1.33–1.69) | < 0.001 |
| Connecticut | 21.8% | 1.15 (1.00–1.32) | 0.049 |
| Detroit | 19.9% | 0.86 (0.75–0.98) | 0.02 |
| Hawaii/Alaska | 16.3% | 0.61 (0.47–0.81) | < 0.001 |
| Iowa | 18.4% | 0.85 (0.73–1.00) | 0.044 |
| New Mexico | 32.9% | 1.50 (1.28–1.77) | < 0.001 |
| Seattle | 27.6% | 1.39 (1.23–1.57) | < 0.001 |
| Utah | 29.1% | 1.23 (1.05–1.43) | 0.009 |
| Atlanta | 21.2% | 0.98 (0.84–1.14) | 0.775 |
| San Jose-Monterey | 24.8% | 1.11 (0.95–1.29) | 0.196 |
| Los Angeles | 19.7% | 0.81 (0.71–0.92) | < 0.001 |
| Kentucky | 16.1% | 0.69 (0.60–0.80) | < 0.001 |
| Louisiana | 26.3% | 1.28 (1.14–1.44) | < 0.001 |
| New Jersey | 19.9% | 0.72 (0.65–0.80) | < 0.001 |
| Greater/Rural Georgia | 21.1% | 0.89 (0.79–0.99) | 0.036 |
|
| |||
| County poverty rate | |||
| Lowest quartile | 21.5% | [reference] | |
| 2nd quartile | 24.2% | 1.09 (1.00–1.18) | 0.046 |
| 3rd quartile | 22.8% | 1.01 (0.93–1.11) | 0.758 |
| Highest quartile | 23.0% | 1.15 (1.04–1.28) | 0.006 |
|
| |||
| NCCN Risk | |||
| Low | 29.3% | [reference] | |
| Intermediate | 15.6% | 0.35 (0.33–0.37) | < 0.001 |
| High | 24.9% | 0.51 (0.47–0.54) | < 0.001 |
Multivariate logistic regression model n = 38,626; men with unknown county poverty level (n = 8) were excluded.
SEER = Surveillance, Epidemiology, and End Results; NCCN = National Comprehensive Cancer Network; SF = San Francisco; CA = California; SJM = San Jose-Monterey; LA = Los Angeles
Discussion
Our analysis provides information regarding the clinical presentation and treatment of localized prostate adenocarcinoma among a contemporary population which is representative of the US as a whole. We found that the majority of patients present with low to intermediate-risk disease, although there was significant variation by sociodemographic factors. Specifically, patients who were older, non-White, nonmarried, living in counties with higher poverty rates were more likely to be diagnosed with high-risk disease. Similarly, age, race/ethnicity, marital status, and county poverty rates—along with NCCN risk—were significant predictors of type of local treatment.
Although a number of previous studies have sought to describe the clinical presentation of prostate cancer in the current era, these included a limited number of patients and/or had limited information regarding important factors necessary for risk stratification6–8. The SEER database has grown to include more registries (and, therefore, patients) over time4. Moreover, the information provided for certain cancer diagnoses has evolved. For instance, SEER studies evaluating the presentation of prostate cancer prior to 2004 utilize the previously used WHO grading system7. The most recent and comprehensive SEER analysis that looks at the presentation of prostate cancer evaluated men diagnosed between 2004 and 20056. During that time period, however, the SEER database recorded only a single GS from the largest tumor specimen available, which was the prostatectomy rather than biopsy specimen for those who underwent prostatectomy. Given the high rates of up- and down-grading of GS from biopsy to prostatectomy9, determination of risk stratification based on data extracted from the SEER database during that era would not reflect disease at diagnosis for a considerable number of patients. Our analysis, on the other hand, utilizes SEER data which includes individual patient GS at the time of biopsy/TURP and can, therefore, more accurately risk stratify patients based on clinical presentation. In our study, 10% of all patients would have a change in NCCN risk with use of pathologic instead of clinical GS. Moreover, our analysis reflects a more contemporary Gleason grading, as these men were diagnosed after the 2005 International Society of Urological Pathology Consensus Conference on Gleason Grading, which resulted in a more homogeneous definition of Gleason 6 cancer and a greater proportion of Gleason 7 and higher disease than in the past10. Finally, although the analysis by Shao et. al. did describe the risk profiles of white and black patients according to various age groupings, they did not provide an overall estimate of the proportion of patients presenting with low-, intermediate-, and high-risk disease, nor did they include patients of Hispanic or Asian/Pacific Islander race/ethnicity, which are growing segments of the US population.
Nonetheless, our findings of variation in NCCN risk according to sociodemographic factors are in line with other studies. The study by Shao et. al., for instance, also noted higher PSA levels, Gleason score, as well as overall AJCC risk with increased age and black, as opposed to white, race6. Using the CaPSURE (Cancer of the Prostate Strategic Urologic Research Endeavor) registry, which is a database capturing more than 14,300 men with prostate cancer enrolled at community, academic and VA hospitals since 1995, Dall’Era et. al. also demonstrated that older, non-White men are more likely to present with intermediate to high risk disease8. Additionally, they found that patients with lower levels of education, not in a significant relationship, or who lacked private/Veteran’s Affairs insurance were more likely to have intermediate and high risk disease.
The clinical presentation of prostate cancer has changed dramatically over the last several decades as a result of PSA screening, with a larger proportion of men presenting with localized and low-risk disease2,3,6,7. The men in our study were diagnosed in 2010, after the 2008 US Preventive Services Task Force (USPSTF) recommendation against PSA screening for men age 75 and older but before the 2011 USPSTF recommendation against PSA screening for men of any age11. Interestingly, most men diagnosed with localized prostate cancer in 2010 had no disease palpable on digital rectal examination, indicating that they likely would not have been diagnosed with cancer if PSA screening had not been performed. Although PSA screening has recently come under increased scrutiny, it is unknown how and to what degree the clinical presentation of prostate cancer might change as PSA screening is expected to continue at least to some extent12. Our analysis illustrates the variation in NCCN risk across patient groups. The likelihood of high-risk disease based on a patient’s age and race/ethnicity should be considered when weighing the potential risks and benefits of PSA screening.
Our analysis also provides information regarding the contemporary local treatment of prostate cancer. Although others have also demonstrated differences in local treatment according to patient demographics and geography8,13–20, our study is unique in that we were able to demonstrate the variability in local treatment according to NCCN risk determined at clinical presentation. We noted an increase in the utilization of radiation treatment with NCCN risk. This is consistent with the general preference to avoid multi-modal local treatment, with its associated increased toxicities, among prostate cancer patients. Although it is intuitive that low-risk patients were most likely not to receive local treatment, as these patients are often best suited for active surveillance, interestingly, we found that intermediate-risk patients were more likely to receive local treatment than high-risk patients. Of note, there are now at least two randomized trials which have demonstrated a survival benefit to the addition of radiation treatment to androgen deprivation therapy in the setting of high-risk prostate cancer21–22. This cohort of patients was diagnosed after the publication of the first21 but before the publication of the second22. Further follow-up will be required to determine if the proportion of high-risk patients receiving local treatment increases as a result of these publications.
Our analysis was, nonetheless, limited by the information available in the SEER database. For one, the SEER database does not capture individual patient income statistics and, as such, we utilized county-level poverty rates as a surrogate in our analyses. With regard to presentation, there is insufficient information regarding the utilization of PSA screening. A lack of screening may, at least to some degree, explain the disparities in presentation with high-risk disease by race23. With regard to treatment, although the SEER database captures type of local treatment, it does not capture some valuable information regarding those who receive no local treatment. Specifically, information regarding the administration of systemic therapy is not captured and, therefore, it is unknown how many patients without local treatment received androgen deprivation therapy alone. Similarly, the SEER database does not capture information regarding the reason why local treatment was withheld. There is a spectrum of men receiving no local treatment, including those who are healthy and elect to undergo active surveillance and those who are older and/or less healthy for whom the benefits of local treatment are not thought to outweigh its risks. As the SEER database does not capture information regarding comorbidities or performance status, we were unable to include these in our analysis. Finally, the decreased proportion of high-risk patients receiving local treatment may be the result of underascertainment of radiation delivery in the SEER database. Whereas there is some controversy regarding the addition of androgen deprivation therapy to external beam radiation in the setting of intermediate-risk prostate cancer, the utilization of androgen deprivation therapy is well-established for high-risk prostate cancer. The administration of neoadjuvant androgen deprivation therapy for high-risk patients may have led to some being misclassified as having received no local treatment due to a delay (and, therefore, inability to capture) in delivery of radiation treatment.
Conclusions
In conclusion, our analysis describes the contemporary clinical presentation and local treatment of prostate cancer in the US. We found that the majority of patients presented with low to intermediate-risk disease and that local treatment varied according to risk stratification. We, moreover, note persistent disparities in the presentation and treatment of prostate cancer according to sociodemographic factors.
Key of definitions
- SEER
Surveillance Epidemiology and End Results
- NCCN
National Comprehensive Cancer Network
- PSA
Prostate specific antigen
- US
United States
- GS
Gleason score
- TURP
Trans-urethral resection of the prostate
- NOS
Not otherwise specified
Footnotes
Publisher's Disclaimer: This is a PDF file of an unedited manuscript that has been accepted for publication. As a service to our customers we are providing this early version of the manuscript. The manuscript will undergo copyediting, typesetting, and review of the resulting proof before it is published in its final citable form. Please note that during the production process errors may be discovered which could affect the content, and all legal disclaimers that apply to the journal pertain.
References
- 1.Siegel R, Naishadham D, Jemal A. Cancer statistics, 2013. CA Cancer J Clin. 2013;63:11. doi: 10.3322/caac.21166. [DOI] [PubMed] [Google Scholar]
- 2.Cooperberg MR, Lubeck DP, Meng MV, et al. The changing face of low-risk prostate cancer: trends in clinical presentation and primary management. J Clin Oncol. 2004;22:2141–2149. doi: 10.1200/JCO.2004.10.062. [DOI] [PMC free article] [PubMed] [Google Scholar]
- 3.Cooperberg MR, Broering JM, Kantoff PW, et al. Contemporary trends in low risk prostate-cancer: risk assessment and treatment. J Urol. 2007;178:S14–19. doi: 10.1016/j.juro.2007.03.135. [DOI] [PMC free article] [PubMed] [Google Scholar]
- 4.Surveillance, Epidemiology, and End Results (SEER): About SEER. National Cancer Institute. [accessed 08/01/2013]. http://www.seer.cancer.gov/about .
- 5.Elliott SP, Johnson DP, Jarosek SL, et al. Bias due to missing SEER data in D’Amico risk stratification of prostate cancer. J Urol. 2012;187:2026–2031. doi: 10.1016/j.juro.2012.01.070. [DOI] [PubMed] [Google Scholar]
- 6.Shao YH, Demissie K, Shih Weichung, et al. Contemporary risk profile of prostate cancer in the United States. J Natl Cancer Inst. 2009;101:1280–1283. doi: 10.1093/jnci/djp262. [DOI] [PMC free article] [PubMed] [Google Scholar]
- 7.Jani AB, Johnstone PA, Liauw SL, et al. Age and grade trends in prostate cancer (1974–2003): a Surveillance, Epidemiology, and End Results Registry analysis. Am J Clin Oncol. 2008;31:375–378. doi: 10.1097/COC.0b013e3181637384. [DOI] [PubMed] [Google Scholar]
- 8.Dall’Era MA, Hosang N, Konety B, et al. Sociodemographic predictors of prostate cancer risk category at diagnosis: unique patterns of significant and insignificant disease. J Urol. 2009;181:1622–1627. doi: 10.1016/j.juro.2008.11.123. [DOI] [PubMed] [Google Scholar]
- 9.Epstein JI, Feng Z, Trock BJ, et al. Upgrading and downgrading of prostate cancer from biopsy to radical prostatectomy: Incidence and predictive factors using the modified Gleason grading system and factoring in tertiary grades. Eur Urol. 2012;61:1019–1024. doi: 10.1016/j.eururo.2012.01.050. [DOI] [PMC free article] [PubMed] [Google Scholar]
- 10.Epstein JI. An update of the Gleason grading system. J Urol. 2010;183:433–440. doi: 10.1016/j.juro.2009.10.046. [DOI] [PubMed] [Google Scholar]
- 11.Chou R, Croswell JM, Dana T, et al. Screening for prostate cancer: review of the evidence for the US Preventive Services Task Force. Ann Intern Med. 2012;155:762–771. doi: 10.7326/0003-4819-155-11-201112060-00375. [DOI] [PubMed] [Google Scholar]
- 12.Colbert JA, Adler JN. Clinical decisions. Prostate cancer screening—polling results. N Engl J Med. 2012;367:e25. doi: 10.1056/NEJMclde1212034. [DOI] [PubMed] [Google Scholar]
- 13.Harlan L, Brawley O, Pommerenke F, et al. Geographic, age, and racial variation in the treatment of local/regional carcinoma of the prostate. J Clin Oncol. 1995;13:93–100. doi: 10.1200/JCO.1995.13.1.93. [DOI] [PubMed] [Google Scholar]
- 14.Spencer BA, Fung CH, Wang M, et al. Geographic variation across veterans affairs medical centers in the treatment of early stage prostate cancer. J Urol. 2004;172:2362–2365. doi: 10.1097/01.ju.0000144064.54670.7b. [DOI] [PubMed] [Google Scholar]
- 15.Zeliadt SB, Potosky AL, Etzioni R, et al. Racial disparity in primary and adjuvant treatment for nonmetastatic prostate cancer: SEER-Medicare trends 1991 to 1999. Urology. 2004;64:1171–6. doi: 10.1016/j.urology.2004.07.037. [DOI] [PubMed] [Google Scholar]
- 16.Underwood W, De Monner S, Ubel P, et al. Racial/ethnic disparities in the treatment of localized/regional prostate cancer. J Urol. 2004;171:1504–1507. doi: 10.1097/01.ju.0000118907.64125.e0. [DOI] [PubMed] [Google Scholar]
- 17.Krupski TL, Kwan L, Afifi AA, et al. Geographic and socioeconomic variation in the treatment of prostate cancer. J Clin Oncol. 2005;23:7881–7888. doi: 10.1200/JCO.2005.08.755. [DOI] [PubMed] [Google Scholar]
- 18.Nambudiri VE, Landrum MB, Lamont EB, et al. Understanding variation in primary prostate cancer treatment within the Veterans Health Administration. Urology. 2012;79:537–545. doi: 10.1016/j.urology.2011.11.013. [DOI] [PubMed] [Google Scholar]
- 19.Schwartz K, Powell IJ, Underwood W, et al. Interplay of race, socioeconomic status, and treatment on survival of patients with prostate cancer. Urology. 2009;74:1296–1302. doi: 10.1016/j.urology.2009.02.058. [DOI] [PMC free article] [PubMed] [Google Scholar]
- 20.Moses KA, Paciorek AT, Penson DF, et al. Impact of ethnicity on primary treatment choice and mortality in men with prostate cancer: Data from CaPSURE. J Clin Oncol. 2010;28:1069–1074. doi: 10.1200/JCO.2009.26.2469. [DOI] [PMC free article] [PubMed] [Google Scholar]
- 21.Widmark A, Klepp O, Solberg A, et al. Endocrine treatment, with or without radiotherapy, in locally advanced prostate cancer (SPCG-7/SFUO-3): An open randomized phase III trial. Lancet. 2009;373:301–308. doi: 10.1016/S0140-6736(08)61815-2. [DOI] [PubMed] [Google Scholar]
- 22.Warde P, Mason M, Ding K, et al. Combined androgen deprivation therapy and radiation therapy for locally advanced prostate cancer: A randomized, phase 3 trial. Lancet. 2011;378:2104–2111. doi: 10.1016/S0140-6736(11)61095-7. [DOI] [PMC free article] [PubMed] [Google Scholar]
- 23.Carpenter WR, Howard DL, Taylor YJ, et al. Racial differences in PSA screening interval and stage at diagnosis. Cancer Causes Control. 2010;21:1071–1080. doi: 10.1007/s10552-010-9535-4. [DOI] [PMC free article] [PubMed] [Google Scholar]


