

Abstract
The study of fruit‐ripening mechanism is vital as it plays a key role in the maintenance of fruit quality. Use of various xenobiotics for quick ripening has been shown to impact the quality of fruit, which in turn affect human health. In the present study, we made an attempt to understand the metabolic perturbations in Carica papaya Linn. (papaya), which has been ripened either by the ripening practice (room temperature process as control) and/or ripening agents (calcium carbide and ethylene) using gas chromatography‐mass spectrometry (GC‐MS) based metabolomics. The partial least squares‐discriminant analysis has revealed significant alternations in 13 metabolites mainly sugars, amino acids, fatty acids, and organic acids as well as disturbances in five metabolic pathways due to different ripening practice/agents. The individual comparison of calcium carbide with control and ethylene with control has found 13 and 11 metabolites, respectively, which are common to the PLS‐DA of three ripening groups. The GC‐MS–based metabolomics has been able to predict the metabolic perturbations in papaya resulting from the ripening practice/agents. The findings from the present analysis has a wide application in food quality and will help to address safety concerns.
Keywords: calcium carbide, ethylene, metabolomics, Papaya (Carica papaya Linn.), ripening agents
Abbreviations
- AUROC
area under receiver operating characteristics
- MetPA
metabolic pathway analysis
- PCA
principal component analysis
- PLS‐DA
partial least squares‐discriminant analysis
- VIP
variable importance in projection
1. INTRODUCTION
At present, various ripening agents are being used in the process of fruit ripening. The variations in the ripening process of fruit not only affect the fruit quality but also associated with several health concerns such as hormonal imbalance, cerebral edema, reduced immunity, hypoxia, hematological and biochemical parameter changes, and increased susceptibility to cancers. 1 , 2 , 3 , 4 Different ripening practices/agents are used mainly for fruits like mango, papaya, banana, plums, etc. 5 Ripening practices are used mainly to improve the appearance by maintaining uniformity in ripening and delivery of fruit for human consumption. However, these accelerated ripening processes may alter the fruit metabolism and fruit quality due to varying physiological processes influenced by multiple biological and environmental factors. Efforts to understand these aforesaid issues are very scanty.
Papaya (Carica papaya Linn.) is one of the highly metabolically active fruit that undergo significant changes during ripening. Papaya is also known as pawpaw that belongs to Caricaceae family. 6 The production of papaya (broadly cultivated fruit) (11.22 Mt) is ranked the third after mango (38.6 Mt) and pineapple (19.4 Mt) around the world. 7 India is placed at the first place in papaya production (∼ 5.3 Mt) followed by Brazil (1.5 Mt). 8 Within India, Andhra Pradesh state is the largest producer of papaya with 30.7% of country's total production followed by Gujarat (22.1%) 9 and is being abundantly consumed due to its health benefits.
Apart from nutritive benefits, papaya has a wide range of applications in therapeutics to improve the human health by reducing the risk of occurrence of various diseases. 10 The alarming usage of various ripening practices/agents and their harmful effects on the fruit quality necessity an urgent need to understand the metabolic perturbations in papaya and their consequences on nutritional quality of the fruit.
Metabolomics is a comprehensive tool to understand the perturbations in the metabolism of food 11 and biological systems that enable the detection of metabolic alternations in biological/physiological pathways influenced by genetic and environmental factors. Metabolomics using modern analytical platforms like gas chromatography‐mass spectrometry (GC‐MS), liquid chromatography‐mass spectrometry, and nuclear magnetic resonance for identification of low molecular weight metabolites. Among them, the more reliable, reproducible, user friendly that gives straightforward results on peak identification is GC‐MS based metabolomics approach. 12 The GC‐MS–based metabolomics has advantages due to availability of mass spectral libraries and use of capillary columns makes it a valuable technique for studying the changes in metabolic profile of foods.
Over the past decade, the use of metabolomics emerged in the field of food science with increasing interest towards nutritional composition/quality, safety, and processing of food. Among all food groups, a fruit is an excellent source of metabolites as they possess complex physiological networks and various nutrients. The nutritive components are greatly influenced during the development and ripening process, which determines the quality of fruit. There are few studies that have focused on strawberry and peach metabolic profiling during development and ripening to determine their fruit quality. 13 , 14 In recent times, metabolomics play a significant role in understanding the postharvest physiological changes during ripening with different ripening practices. 15 , 16 Currently, about 15 ripening agents are available in the market to hasten the ripening process and among them ethylene and calcium carbide (CaC2) are most commonly used ripening agents. 17 The use of CaC2 for ripening of fruit is stated as carcinogenic and prohibited by Food Safety and Standard Regulations 2011 (regulation 2.3.5), but still being used due to its low cost in comparison to ethylene. 18 However, very less is known about the effects of these ripening agents on fruit quality. Thus, it is essential to investigate the metabolic changes occurring due to use of different ripening agents. The present work aims to use the GC‐MS–based metabolomics to understand the perturbations in papaya metabolome due to calcium carbide, ethylene, and room temperature ripening.
2. MATERIALS AND METHODS
2.1. Chemicals and reagents
Solvents of n‐hexane, methanol, and acetone of HPLC grade were purchased from Merck, and other derivatization reagents such as o‐ methoxyamine hydrochloride, pyridine, and N‐methyl‐N‐(trimethylsilyl) trifluoroacetamide at the purity of ≥98% were procured from Sigma Aldrich (St. Louis, MO, USA). The technical‐grade calcium carbide was procured from a local vendor at Hyderabad, India. All the chemicals and reagents used were of analytical grade.
2.2. Instrument
The GC‐MS system consisted of a 7890B gas chromatograph with a 5977A mass spectrometer in electron ionization mode (Agilent Technologies, Palo Alto, CA, USA). The chemstation software was used for the instrumental data acquisition, metaboanalyst (version 4.0) software was used for multivariate analysis (principal component analysis [PCA] and partial least squares‐discriminant analysis [PLS‐DA]), and MetPA software was used for pathway analysis.
2.3. Sampling and extraction
Nine papaya samples (green hard mature stage) were collected from orchards after examining the visual skin color as faint yellow stripe. 19 , 20 The collected samples were transported to the laboratory and divided into three groups. The samples were kept for 5 days under the ripening conditions as stated below. One sample group was kept at room temperature (30 ± 2°C) (termed as control), the second group was exposed to ethylene (100 μL−1) in a chamber (10 ft × 10 ft) at 16 ± 2°C for 24 h with relative humidity 90‐95% (subsequently stored at 24 ± 2°C), and the third group was in a corrugated carton box (16 inch × 12 inch) exposed to calcium carbide (1 g kg−1) wrapped in a newspaper and kept at the bottom of the fruits in a box at 30 ± 2°C and covered properly to prevent the leakage of acetylene gas. After 5 days, the samples were processed by separating the seeds and mashed the whole fruit to obtain a homogeneous fruit sample through grinding. The resultant sample was kept in liquid nitrogen in order to arrest the metabolic reactions and then was stored at −80 °C until further analysis.
For the analysis, 100 mg of papaya fruit sample was taken in an eppendorf tube and to this was added 500 μL of 80% methanol in ice cold condition. 16 The resultant mixture was vortexed for 15 min at 4°C and then was centrifuged. The residue after decanting the supernatant was again extracted twice by repeating the same procedure. The resultant supernatants were pooled and centrifuged at 10 000 rpm for 10 min at 4°C and stored at −20°C until further analysis. An aliquot of 100 μL was taken in a separate vial and evaporated the solvent to dryness in a vacuum dryer for 5‐6 h (Scan Speed 32, Labogene, Denmark). The resultant extract was taken for derivatization before GC‐MS analysis.
2.4. Derivatization
Derivatization is an important step in GC‐MS metabolomics studies as many of the metabolites are polar in nature. The derivatization will convert them into nonpolar amenable for GC‐MS analysis and also helps to improve the volatility, suitability, efficiency, and detectability of the polar metabolites.
Prior to derivatization, the dried extract was mixed with 50 μL of methoxyamine hydrochloride (20 mg mL−1) in pyridine and incubated for 30 min at 60°C. This will help to stabilize the sugars in the samples by preventing the intramolecular conversions (hemiacetal to acetal) during derivatization. Further, an amount of 100 μL of MSTFA with 1% N‐Methyl‐N‐(trimethylsilyl)trifluoroacetamide (TMCS) was added to the resultant solution. The mixture was incubated at 60°C for 60 min in a thermomixer (Thermomixer C, Eppendorf AG 5382, Germany). After derivatization, the sample was made up to 600 μL with n‐hexane and vortex well prior to GC‐MS analysis.
2.5. GC‐MS analysis and screening of metabolites
The GC‐MS analysis was carried out with the following conditions reported by Ratnasekhar et al, 21 after minor modifications. Briefly, an aliquot of 200 μL of a derivatized sample was taken into an insert with bottom spring in an air tight screw capped GC‐MS vials. The analysis was performed by injecting an aliquot of 1 μL of each extract via splitless mode into GC‐MS equipped with HP‐5MS capillary column (30 m × 250 μm i.d. × 0.25 μm film thickness) and electron ionization source (70 eV) at 230°C. The quadrupole analyzer, inlet, and GC‐MS interface temperatures were set at 150, 260, and 290 °C, respectively. The solvent delay was kept for 6 min. The mass spectrometer was used in full scan mode in the mass range of 29‐600 (m/z). Helium was used as a carrier gas with a constant flow of 1.2 mL min−1, and the GC oven program with an initial temperature set at 65°C for 2 min and then increased to 180°C at a rate of 5°C min−1, and further increased to 225°C at a rate of 3°C min−1, and finally increased to 265°C at a rate of 6°C min−1 held for 15 min with a total run time of 61 min. The process blank samples were also prepared as mentioned above without using the papaya sample in it to monitor the instrumental performance and to avoid artefacts during the analysis. The blank sample was injected after every six injections of each sample. After analysis, the peaks were identified by matching the acquired mass spectra of each peak with mass spectral library available in the instrument (NIST version 08).
2.6. Data processing and multivariate analysis
The fragmented spectrum was subjected to deconvolution by AMDIS (automated mass spectral deconvolution and identification system) software to separate them into individual spectra. AMDIS sequentially processes the GC‐MS raw data files, which are acquired from instrumental (chemstation) software. The raw data files converted into netCDF (network common data form) and automated processing was done by using XCMS software (based on ion with m/z, retention time, and peak matching). 22 The samples and factors (metabolites) were taken as rows and columns labels, and the file was converted into comma‐separated values (.csv) format and then used for further processing. The normalization of the data was carried through pareto scaling to make features more comparable. The Metaboanalyst software (v.4.0) was used for PCA, which is an unsupervised approach to convert the multidimensional data into two‐dimensional space without losing significant features. PLS‐DA was also performed, which is a supervised approach to further refine the discriminant metabolites between the sample groups. The significant factors responsible for discrimination in the samples were selected based on variable importance in projection (VIP) score greater than 0.9. The classification performance of the model obtained in this study was validated through area under receiver operating characteristics (AUROC). Further, the quality was assessed by measuring R 2 (goodness of fit) and Q 2 (goodness of prediction) via cross‐validation and permutation test were performed (n = 100). Finally, for intuitive visualization of discriminatory metabolites, a heat map was constructed and relative concentrations of the potential metabolites between sample groups were compared.
2.7. Pathway analysis
The pathway analysis was carried using MetPA to understand the insights underlying metabolic insult in papaya fruit under studied conditions for perturbed metabolites identified after PLS‐DA analysis. MetPA is a web‐based tool, which integrates the results obtained from the advanced methods such as enrichment and topology analysis for visualization. 23 For an over‐representative and topology analysis, hypergeometric, betweenness centrality was applied as algorithms, respectively. Arabidopsis thaliana (thale cress) was selected as a “model plant,” since Caricaceae is comes under the order Brassicales, same as Arabidopsis thaliana. The present analysis uses KEGG (Kyoto Encyclopedia of Genes and Genomes) metabolic pathway libraries as the knowledge base.
3. RESULTS AND DISCUSSION
After 5 days of ripening, all experimental groups of papaya fruit became softer and attains orange color (appropriate for consumption based on sensory observation) and this was stated as maturity stage 5. 19 The metabolic profiling of papaya fruit with three different ripening practices/agents was performed using GC‐MS, and the majority of the peaks were common among all the groups. A total of 100 metabolites were identified from the acquired data by matching the spectra's of these metabolites with the mass spectral library (NIST 08) available in the instrument after deconvolution. The metabolites identified belong to the classes of amino acids (15), organic acids (19), fatty acids (27), sugars (14), polyols (5), and others (20) (Figure 1). It is difficult to draw the inferences from the multidimensional data (due to many variables of multiclass metabolites) and a large number of samples. So, chemometric analysis (unsupervised PCA and supervised PLS‐DA) was performed to reduce the dimensionality (multi to two) of the data without affecting the actual variations in the sample groups (control, ethylene, and calcium carbide samples) and to identify differential metabolites responsible for this classification.
FIGURE 1.
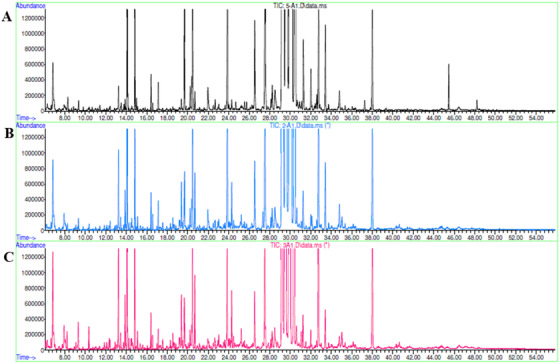
GC‐MS chromatogram for (A) control, (B) ethylene, and (C) CaC2 ripened fruit
The unsupervised PCA will provide a classification pattern between the samples ripened with different practices/agents by plotting a pairwise score plots. The total accumulated variance accounted for 94.3% and variance explained individually like PC1 of 70.9%, PC2 of 11.8%, PC3 of 6%, PC4 of 3.4%, and PC5 of 2.4%. The first two components PC1 and PC2 accounted for the maximum variability of about 82.7%. The clear separation of three different clusters, namely control (C), ethylene ripened (E1), and CaC2 ripened (E2) papaya in PCA trajectory score plot, clearly indicates the metabolic perturbations in the metabolome of papaya which is specific to the ripening practices/agents (Figure 2A). The corresponding loading plot (Figure 2B) outlines the metabolites responsible for the classification of these sample groups in the score plot.
FIGURE 2.

(A) PCA score plot indicating discrimination between control (C), ethylene (E1), CaC2 (E2) exposed samples after GC‐MS analysis. (B) Loading plot for all the three groups showing the metabolites that were major contributors to the separation of groups observed in the PCA score plot of papaya fruits
In total, 20 metabolites including sugars (d‐fructose, d‐glucopyranose, d‐glucose, gulose, d‐turanose), amino acids (l‐alanine, glycine, l‐valine, threonine, leucine), organic acids (dl‐malic acid, 1,2,3‐propane tricarboxylic acid, butanoic acid, benzene, cis‐3‐hexenyllactate), and fatty acids (hexadecanoic acid, octadecanoic, octadecane, ethanedioic acid) were found in the samples.
Then to refine further the results of classification obtained after the unsupervised PCA approach, the supervised PLS‐DA was used to generate a score plot and its corresponding loading plot from intergroup comparison of each group verses control (Figure 3A and 3B). Further screen to identify the differential metabolites through a statistical parameter called the VIP score. The results showed that 13 metabolites were significantly altered in papaya due to the use of different ripening practices/agents and identified them as candidate marker metabolites for this study (Table 1; Figure 4A). The metabolites, namely d‐fructose, butanoic acid, benzene, hexadecanoic acid, octadecane, cis‐3‐hexenyllactate, l‐alanine, glycine, octadecanoic acid, dl‐malic acid, 1,2,3‐propanetricarboxylic acid, d‐glucose, and gulose, were identified as candidate marker/differential metabolites.
FIGURE 3.

(A) PLS DA score plot and (B) loading plot
TABLE 1.
Perturbed metabolites in papaya fruit metabolome after exposed to different ripening practices/agents as identified by GC‐MS–based metabolomics
| Metabolite | Molecular formula | VIP score | Fragmentation pattern (m/z) | RT (min) | *P value | Significance variance (CaC2 vs Control) | Significance Variance (EthyleneVs Control) |
|---|---|---|---|---|---|---|---|
| d‐Fructose | C21H52O6Si5 | 3.89 | 43, 57,73, 85147 217, 437 | 27.31 | 7.61E−04 | Down | Down |
| cis‐3‐Hexenyl lactate | C9H16O3 | 1.77 | 43, 55, 67, 82, 89 | 6.82 | 6.27E−04 | Up | Up |
| l‐Alanine | C9H23NO2Si2 | 1.37 | 45, 73, 100, 116, 190 | 9.3 | .00784 | Up | Up |
| Benzene | C14H22 | 1.99 | 41, 57, 91, 115, 147, 175, 190 | 13.23 | 5.11E−04 | Up | Up |
| Glycine | C7H12F3NO3Si | 1.15 | 42, 58, 73, 110, 134, 184, 228, 285 | 12.34 | .00812 | Up | Up |
| dl‐Malic acid | C13H30O5Si3 | 1.07 | 55, 73, 133, 147, 189, 233 | 19.64 | 0.00189 | Down | Down |
| 1,2,3‐Propane tricarboxylic acid | C18H40O7Si4 | 1.04 | 45, 73, 147, 211, 273, 347, 363, 465 | 27.51 | 7.74E−04 | Down | Down |
| Hexadecanoic acid | C25H54O4Si2 | 1.99 | 43, 57, 73, 103, 129, 147, 239 | 45.45 | 5.11E−04 | Up | Up |
| Octadecanoic acid | C27H58O4Si2 | 1.13 | 43, 57, 73, 129, 147, 399, 487 | 48.21 | 5.11E−04 | Up | Up |
| Octadecane | C19H40 | 1.91 | 43, 57, 71, 85, 99, 113, 127, 141, 155 | 24.28 | 5.11E−04 | Up | Up |
| Butanoic acid | C13H33NO2Si3 | 2.24 | 45, 73, 86, 100, 147, 174, 246, 304 | 20.46 | .00168 | Down | Down |
| d‐Glucose | C22H55NO6Si5 | 0.946 | 73, 89, 103, 117, 157, 189, 205, 244, 319 | 28.21 | .01084 | Down | Down |
| Gulose | C21H52O6Si5 | 0.9 | 73, 103, 129,147, 204, 220, 319 | 33.42 | .01796 | Down | Down |
*Significance levels was calculated from nonparametric version ANOVA.
FIGURE 4.

(A) VIP score plot and (B) heat map for 13 metabolites selected from the VIP score plot by PLS‐DA analysis
The individual comparisons of calcium carbide with control samples has resulted in alternations in d‐fructose, butanoic acid, benzene, hexadecanoic acid, octadecane, cis‐3‐hexenyllactate, l‐alanine, glycine, octadecanoic acid, dl‐malic acid, 1,2,3‐propanetricarboxylic acid, d‐glucose, gulose, and all 13 metabolites were found to be common with PLS‐DA of multiple groups (control vs calcium carbide vs ethylene). In the same way, the individual comparison of ethylene ripening with controls samples has resulted in alternations in d‐fructose, octadecane, gulose, cis‐3‐hexenyllactate, benzene, hexadecanoic acid, glycine, dl‐malic acid, 1,4‐butanediamine, l‐isoleucine, d‐glucose, l‐valine, 1,2,3‐propanetricarboxylic acid, butanoic acid, undecane, out of which, 11 metabolites (d‐fructose, octadecane, gulose, cis‐3‐hexenyllactate, benzene, hexadecanoic acid, glycine, dl‐malic acid, d‐glucose, 1,2,3‐propanetricarboxylic acid, butanoic acid) were found to be common with PLS‐DA of multiple groups (control vs calcium carbide vs ethylene). This shows the predictive accuracy of the data by PLS‐DA. The heat map showed the relative abundance for differential metabolites in the experimental groups (control vs ethylene vs calcium carbide) was represented in colors (red‐high abundance, green‐low abundance) with a scale expressed value (−1 to 1) (Figure 4B).
To validate the predictive power of the classification given by these approaches and to know about the quality of the model obtained, we have further performed the cross‐validation by the leave‐one‐out cross‐validation method and the current data show the predictive accuracy Q 2 ˃ 0.97 and R 2 ˃ 0.96 and it represents a good fit of the model (Figure 5A).
FIGURE 5.

(A) Cross‐validation, bar plots showing the quality measures (accuracy, Q 2, R 2). (B) Permutation analysis of PLS‐DA models derived from artificially ripened and normal ripened papaya fruit
Further, the permutation test has also been performed for model validation and determined that the P‐value as ˂ .001 with a permutation number setting it as 100 (Figure 5B). Apart from the above, classification performance of these models was evaluated by a ROC curve plotted between sensitivity (true positive rate) vs 1‐ specificity (false positive rate) and AUROC was found to be 1.0, which is considered to be excellent classification performance of the model from this study (Figure 6A).
FIGURE 6.

(A) ROC curve analysis (AUROC = 1) based on cross‐validation performance. (B) Summary of path way analysis. x‐Axis represents the pathway impact value (node radius represents the impact value) by topology analysis, and y‐axis represents different levels of significance (node color indicates the p value, yellow to red) by enrichment analysis
dl‐Malic acid said to be one of the prominent organic acid found to have upregulated in control than that of ethylene and CaC2‐ripened papaya fruit. The other acid known as 1,2,3‐propane tricarboxylic acid (tricarballylate), which is said to be a major inhibitor of aconitase in Kreb's cycle, 24 was detected in papaya and found to be significantly higher in the control group than in ethylene‐ and CaC2‐ripened papaya fruit. Thus, we can assume that an increased concentration of 1,2,3‐propane tricarboxylic acid could be an index for accumulation of citric acid, indicating the possible decreased acidity in ethylene‐ and CaC2‐ripening papaya fruit. 25 Similarly, the sugars like d‐fructose, d‐glucose, and gulose were found to be increased in control than in ethylene‐ and CaC2‐ripened papaya. The decreased levels of sugars in ethylene‐ripened papaya fruit may be due to the storage at lower temperature, which causes the reduced rate of reaction which in turn impairs starch metabolism. 26 The reduced levels of sugars in CaC2‐ripened papaya may depend on the distinct rate of synthesis and degradation of sucrose or levels of polysaccharide content and their subsequent conversion to reducing sugars 27 in the course of rapid ripening or utilization of sugars as an energy source for ripening of the fruit and are in line with the literature findings on mango ripening with CaC2. 28 , 29 Benzene, a volatile aromatic hydrocarbon found in the horticulture crops is the strongest evidence of carcinogenicity. In the present study, the levels of benzene were higher in CaC2‐ripened fruit as compared to ethylene and control and was higher in ethylene‐ripened fruit as compared to control papaya fruit. These findings clearly suggest that the benzene accumulation in CaC2‐ripened papaya might be an indication for the presence of hydroxyl radicals induced decarboxylation or decomposition of amino acids. 30 , 31 , 32
cis‐3‐Hexenyl lactate is said to be an ester of lactic acid and normally found in the fruit during the esterification reaction in the presence of lipase, 33 this ester has a characteristic flavor and found to be higher in CaC2‐ripened fruit in comparison to control and ethylene‐ripened papaya fruit. The levels of amino acids, namely l‐alanine and glycine, were upregulated in the CaC2‐ripened papaya fruit, which may be attributed to the presence of impurities in CaC2, 34 and contribute effectively in the defense mechanism to detoxify the xenobiotics from the fruit. 35 Further, free amino acids are precursors of aroma compounds during ripening. 36
Octadecane is said to be a volatile compound and found to be one of the main flavored compounds in papaya. 37 Generally, several biochemical or metabolic pathways were responsible for release of a mixer of volatile compounds from fruits which reflect the quality attribute like fruit flavor. In the present study, a considerable increase of octadecane in the CaC2‐ripened papaya fruit was observed as compared to other two groups. This increase might reflect the advanced ripening in the CaC2‐ripened fruit compared to that of ethylene and control. But until now, we have a limited understanding how volatile compounds influence the flavor quality upon ripening. 38
In the present study, an increase in butanoic acid levels was observed in control fruit and it may be associated with off‐flavor. Previous studies have also reported that the increased butanoic acid was responsible for undesirable flavor as a consequence of storage. 36 In contrast, the decreased levels of butanoic acid were observed in the fruit when exposed to ethylene and CaC2 in comparison to control samples. Further, compounds like hexadecanoic acid and octadecanoic acid were found to be upregulated in the CaC2‐ripened papaya fruit as compared to ethylene and control ripened fruit. The fatty acids are said to be increased during fruit ripening and correlates with aroma and flavor of the fruit. 39 The increase in these fatty acids was high in the CaC2‐ripened papaya and a moderate increase in the ethylene‐ripened papaya fruit than in comparison to control papaya. This may be attributed to the fastening of the ripening, which is in the order of CaC2 > ethylene > control ripening process.
3.1. Pathway analysis
The present study has shown that the changes in metabolome of papaya were significant with different ripening practices/agents. The study also examined the affected metabolic pathways in papaya samples due to use of different ripening agents/practices. The pathways include starch and sucrose metabolism, glycine, serine, and threonine metabolism, Glyoxylate and dicarboxylate metabolism, glutathione metabolism, and galactose metabolism were affected as identified by MetPA (Figure 6B). The differential metabolites in the pathways altered are shown in Table 2. Further, from the information obtained after the chemometric analysis, the possible pathway interaction map was illustrated to identify the differential metabolites identified in each pathway (Figure 7).
TABLE 2.
Altered metabolites showing an impact on respective metabolic pathways
| Identified pathways by using KEGG library | Matched metabolites | −log(p) | Impact | FDR |
|---|---|---|---|---|
| Starch and sucrose metabolism | d‐Glucose | 1.88E+00 | 0.3 | 1.00E+00 |
| Glycine, serine, and threonine metabolism | Glycine | 1.69E+00 | 0.21 | 1.00E+00 |
| Glyoxylate and dicarboxylate metabolism | Glycine | 1.81E+00 | 0.1 | 1.00E+00 |
| Glutathione metabolism | Glycine | 1.91E+00 | 0.07 | 1.00E+00 |
| Galactose | d‐Glucose | 1.69E+00 | 0.005 | 1.00E+00 |
FIGURE 7.
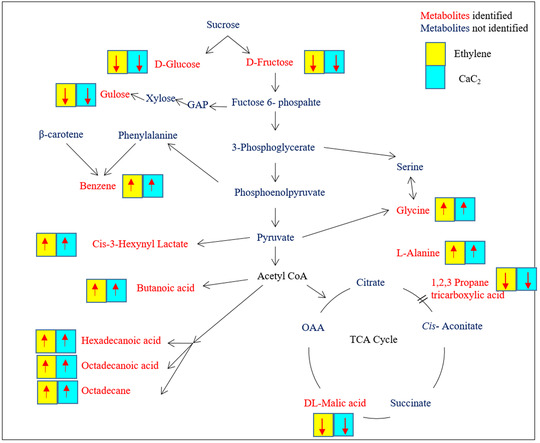
Schematic representation of metabolic pathways affected due to different ripening process/agents in papaya fruit. Red color metabolites were identified blue color metabolite were nonidentified. ↑ significant increase/upregulated, ↓ significant decrease/downregulated with chemical exposure (ethylene, CaC2) with respect to control was mentioned. Significance levels were calculated from nonparametric version ANOVA
4. CONCLUDING REMARKS
In the present study, we made an attempt to understand the metabolic perturbations occurring due to different ripening practices/agents used to ripe Carica papaya L. by the GC‐MS–based metabolomics approach. The present study identified 13 metabolites, which were significantly altered due to different ripening practices/agents. The amino acids, organic acids, and fatty acids along with sugars were significantly altered their levels, and some of them were specific to the ripening practices/agents. The study also identified that five metabolic pathways were significantly affected during the ripening practices/agents. Though the ripening agents (ethylene and CaC2) impart the ripened look for fruits, but there was a difference in certain metabolites and respective pathways related to taste and aroma when compared to control. The GC‐MS–based metabolomics approach can provide vital information to identify candidate marker metabolites in understanding the fruit‐ripening processes, which eventually help in assessing the food quality, safety, and biotechnological aspects. However, more research needs to be conducted to explore the detailed mechanism with different batches of fruit in different maturity stages for a longer time.
FUNDING SOURCE
UGC New Delhi to Mr. Hussain Shaik for Senior Research Fellowship
DST, New Delhi through Grand‐in‐Aid project (GAP‐0701)
CONFLICT OF INTEREST
The authors have declared no conflict of interest.
ACKNOWLEDGMENTS
The authors are thankful to Director, CSIR‐Indian Institute of Chemical Technology, Hyderabad, India, for providing necessary infrastructural facilities to carry out this work. The authors are also thankful to Prof. K. R. S. Sambasiva Rao, Vice Chancellor, Mizoram University, Aizawl, India, for his moral support in pursuing this work at Acharya Nagarjuna University. Mr. Hussain Shaik is thankful to UGC, New Delhi, India, for research fellowship. The authors are thankful to Department of Science & Technology, New Delhi, India, for financial support through the Grant‐in‐Aid (GAP‐0701) project. This manuscript bears CSIR‐IICT communication number IICT/Pubs./2019/108.
Ganneru S, Shaik H, Peddi K, Mudiam MKR. Understanding the metabolic perturbations in Carica papaya Linn due to different ripening practices/agents using gas chromatography‐mass spectrometry based metabolomics. Anal Sci Adv. 2020;1:183–193. 10.1002/ansa.202000026
Contributor Information
Kiranmayi Peddi, Email: kiranmayikodali@rediffmail.com.
Mohana Krishna Reddy Mudiam, Email: mmudiam@yahoo.com.
REFERENCES
- 1. Essien EB, Onyegeme‐Okerenta BM, Onyema JO. Calcium carbide as an artificial fruit‐ripening agent and its physiological effects on Wistar rats. Clin Exp Med Sci. 2018;6:47‐61. [Google Scholar]
- 2. Per H, Kurtoğlu S, Yağmur F, Gümüş H, Kumandaş S, Poyrazoğlu MH. Calcium carbide poisoning via food in childhood. J Emer Med. 2007;32:179‐180. [DOI] [PubMed] [Google Scholar]
- 3. Andrew GS, Simon UT, John AU, Godwin OO, Alexander NI, Ikagu YM. Studies on changes in some haematological and plasma biochemical parameters in Wistar rats fed on diets containing calcium carbide ripened mango fruits. Int J Food Sci Nutri Eng. 2018;8:27‐36. [Google Scholar]
- 4. Kjuus H, Andersen A, Langård S. Incidence of cancer among workers producing calcium carbide. Br J Ind Med. 1986;43:237‐242. [DOI] [PMC free article] [PubMed] [Google Scholar]
- 5. Gandhi S, Sharma M, Bhatnagar B. Comparative study on the ripening ability of banana by artificial ripening agent (calcium carbide) and natural ripening agents. Indian J Nutri. 2016;3:127. [Google Scholar]
- 6. Vijay Y, Pradeep KG, Chetan SC, Anju GBV. Carica papaya Linn: an overview. Int J Herbal Med. 2014;2:1‐08. [Google Scholar]
- 7. Edward AE, Fredy HB. An Overview of Global Papaya Production, Trade, and Consumption. Gainesville, FL: University of Florida; 2012. IFAS Extension. [Google Scholar]
- 8.FAOSTAT Crop Production. http://faostat.fao.org/site/567/default.aspx#ancor; 2012.
- 9. Tiwari RK, Mistry N, Singh B, Gandhi C, Indian horticulture database. Guragaon, India: National Horticulture Boad; 2013.
- 10. Pragati J, Bharati J. Medicative properties of Carica papaya – an overview. Int J Pharm Res. 2018;13:10‐17. [Google Scholar]
- 11. Xu J, Zhang Y, Qi D, et al. Postharvest metabolomic changes in Pyrus ussuriensis Maxim. wild accession„ Zaoshu Shanli. J Sep Sci. 2018;41:4001‐4013. [DOI] [PubMed] [Google Scholar]
- 12. Ashish C, Manish KG, Priyanka C. GC‐MS technique and its analytical applications in science and technology. J Anal Bioanal Tech. 2014;5:1‐6. [Google Scholar]
- 13. Zhang J, Wang X, Yu O, et al. Metabolic profiling of strawberry (Fragaria× ananassa Duch.) during fruit development and maturation. J Exp Bot. 2010;62:1103‐1118. [DOI] [PubMed] [Google Scholar]
- 14. Lombardo VA, Osorio S, Borsani J, et al. Metabolic profiling during peach fruit development and ripening reveals the metabolic networks that underpin each developmental stage. Plant Physiol. 2011;1571:696‐1710. [DOI] [PMC free article] [PubMed] [Google Scholar]
- 15. Lim S, Lee JG, Lee EJ. Comparison of fruit quality and GC–MS‐based metabolite profiling of kiwifruit ‘Jecy green’: natural and exogenous ethylene‐induced ripening. Food Chem. 2017;234:81‐92. [DOI] [PubMed] [Google Scholar]
- 16. Ganneru S, Shaik H, Peddi K, Mudiam MKR. Evaluating the metabolic perturbations in Mangifera indica (mango) ripened with various ripening agents/practices through gas chromatography‐mass spectrometry based metabolomics. J Sep Sci. 2019;42:1‐9. [DOI] [PubMed] [Google Scholar]
- 17. Dhembare A. Bitter truth about fruit with reference to artificial ripener. Arch Appl Sci Res. 2013;5:45‐54. [Google Scholar]
- 18. Islam MN, Mursalat M, Khan MS. A review on the legislative aspect of artificial fruit ripening. Agric Food Secur. 2016;5:1‐10. [Google Scholar]
- 19. Santamaría Basulto F, Sauri Duch E, Espadas y Gil F, Díaz Plaza R, Larqué Saavedra A, Santamaría JM. Postharvest ripening and maturity indices for maradol papaya. Int J Mol Sci. 2009;34:583‐588. [Google Scholar]
- 20. Paltrinieri G, Handling of Fresh Fruits, Vegetables and Root Crops A Training Manual—For Grenada. Rome, Italy: Food and Agriculture Organization of the United Nations; 2014.
- 21. Ratnasekhar C, Sonane M, Satish A, Mudiam MKR. Metabolomics reveals the perturbations in the metabolome of Caenorhabditis elegans exposed to titanium dioxide nanoparticles. Nanotoxicology. 2015;9:994‐1004. [DOI] [PubMed] [Google Scholar]
- 22. Tautenhahn R, Patti GJ, Rinehart D, Siuzdak G. XCMS online: a web‐based platform to process untargeted metabolomic data. Anal Chem. 2012;84:5035‐5039. [DOI] [PMC free article] [PubMed] [Google Scholar]
- 23. Xia J, Wishart DS. MetPA: a web‐based metabolomics tool for pathway analysis and visualization. Bioinformatics. 2010;26:2342‐2344. [DOI] [PubMed] [Google Scholar]
- 24.Showing metabocard for 1,2,3‐ propane tricarboxylic acid. http://hmdb.ca (HMDB31193).
- 25. Medlicott AP, Thompson AK. Analysis of sugars and organic acids in ripening mango fruits (Mangifera indica L. var Keitt) by high performance liquid chromatography. J Sci Food Agric. 1985;36:561‐566. [Google Scholar]
- 26. Peroni‐Okita FH, Cardoso MB, Agopian RGD, et al. The cold storage of green bananas affects the starch degradation during ripening at higher temperature. Carbohydr Polym. 2013;96:137‐147. [DOI] [PubMed] [Google Scholar]
- 27. Palpandian P, Shanmugam H, Rani EA, Prabu GTV. Determination of fruit quality of calcium carbide induced ripening in mango (Mangifera indica L.CV.Alphonso) by physiological, biochemical, bio‐enzymatic and elemental composition analysis (EDX). Indian J Biochem Biophys. 2019;56:205‐213. [Google Scholar]
- 28. João PF, Fernanda HGP, Maria LPAG. Papaya, mango and guava fruit metabolism during ripening: postharvest changes affecting tropical fruit. Nutritional content and quality. Global science book. Fresh Produce. 2010;4:56‐66. [Google Scholar]
- 29. Pandarinathan S, Sivakumar S, Nadu T, Arts S. Studies on biochemical changes in mangoes due to artificial ripening. Int J Agric Sci. 2010;1:3347‐3355. [Google Scholar]
- 30. Dos Santos S, Paula V, Medeiros Salgado A, Guedes Torres A, Signori Pereira K. Benzene as a chemical hazard in processed foods. Int J Food Sci. 2015:1‐7. [DOI] [PMC free article] [PubMed] [Google Scholar]
- 31. Gardner LK, Lawrence GD. Benzene production from decarboxylation of benzoic acid in the presence of ascorbic acid and a transition‐metal catalyst. J Agric Food Chem. 1993;41:693‐695. [Google Scholar]
- 32. Medeiros Vinci R, De Meulenaer B, Andjelkovic M, Canfyn M, Van Overmeire I, Van Loco J. Factors influencing benzene formation from the decarboxylation of benzoate in liquid model systems. J Agric Food Chem. 2011;59:12975‐12981. [DOI] [PubMed] [Google Scholar]
- 33. Clary J, Feron V, Van Velthuijsen J. Safety assessment of lactate esters. Regul Toxicol Pharmacol. 1998;27:88‐97. [DOI] [PubMed] [Google Scholar]
- 34. Tamás M, Sharma S, Ibstedt S, Jacobson T, Christen P. Heavy metals and metalloids as a cause for protein misfolding and aggregation. Biomolecules. 2014;4:252‐267. [DOI] [PMC free article] [PubMed] [Google Scholar]
- 35. Sharma B, Singh S, Siddiqi NJ. Biomedical implications of heavy metals induced imbalances in redox systems. BioMed Res Int. 2014;2014:640754. [DOI] [PMC free article] [PubMed] [Google Scholar] [Retracted]
- 36. Hanny WC, Feng C. Flavour of Papaya (L.) fruit. Biotropia. 2013;20:50‐71. [Google Scholar]
- 37. Wu Q, Li Z, Chen X, Yun Z, Li T, Jiang Y. Comparative metabolites profiling of harvested papaya (Carica papaya L.) peel in response to chilling stress. J Sci Food Agric. 2019;15:6868‐6881. [DOI] [PubMed] [Google Scholar]
- 38. Muna AMEH, Feng‐Jie Z, Fei‐Fei W, Chun‐Hua Z, Jun T. Advances in fruit aroma volatile research. Molecules. 2013;;7:8200‐8229. [DOI] [PMC free article] [PubMed] [Google Scholar]
- 39. Gholap AS, Bandyopadhyay C. Fatty acid biogenesis in ripening mango (Magnifera indica L. var. ‘Alphonso’). J Agric Food Chem. 1980;28:839‐841. [Google Scholar]