

Abstract
High throughput experimentation is a growing and evolving field that allows to execute dozens to several thousands of experiments per day with relatively limited resources. Through miniaturization, typically a high degree of automation and the use of digital data tools, many parallel reactions or experiments at a time can be run in such workflows. High throughput experimentation also requires fast analytical techniques capable of generating critically important analytical data in line with the increased rate of experimentation. As traditional techniques usually do not deliver the speed required, some unique approaches are required to enable workflows to function as designed. This review covers the recent developments (2019‐2020) in this field and was intended to give a comprehensive overview of the current “state‐of‐the‐art.”
Keywords: high throughput analysis, liquid chromatography, mass spectrometry, supercritical fluid chromatography, ultrafast analysis
ABBREVIATIONS
- ADE
acoustic droplet ejection
- AEMS
acoustic ejection mass spectrometry
- AIMS
ambient ionization mass spectrometry
- AMI
acoustic mist ionization
- AP
atmospheric pressure
- APCI
atmospheric‐pressure chemical ionization
- APPI
atmospheric‐pressure photoionization
- BPR
back pressure regulator
- CD
circular dichroism
- DART
direct analysis in real‐time
- DESI
desorption electrospray ionization
- FPP
fully porous particles
- HTA
high throughput analysis
- HTE
high throughput experimentation
- HTS
high throughput screening
- IMS
ion mobility spectrometry
- MISER
multiple injections in a single experimental run
- OPI
open port interface
- OT
open tubular
- SAMDI
self‐assembled monolayers coupled with desorption/ionization
- SFC
supercritical fluid chromatography
- SIMS
secondary ion mass spectrometry
- SPME
solid‐phase microextraction
- SPP
superficially porous particles
- UHPLC
ultrahigh‐performance liquid chromatography/ultrahigh‐pressure liquid chromatography
- UV
ultraviolet
1. INTRODUCTION
In recent years, many industries and scientific disciplines have embraced the concept of high throughput experimentation (HTE) to support the ever‐increasing need for faster data generation and acceleration of product development cycles. In pharmaceutical industry, HTE has been adopted in diverse areas, such as the discovery of biomarkers and of new chemical entities in drug discovery, 1 , 2 , 3 as a tool to accelerate the characterization of new pharmaceutical compounds as well as small‐molecule chemical process development, 4 , 5 , 6 , 7 in biotherapeutics analysis, 8 forced degradation studies of therapeutic peptides, 9 and analytical method qualification. 10
Highly automated platforms that are capable of swiftly running large numbers of experiments in parallel also require a concomitant increase in the rate at which the desired analytical data can be generated and processed, if analytics are not to be the bottleneck.
For most analytical techniques, there exists a tradeoff between the speed at which data can be generated and the quality or accuracy of the data, and for any HTE workflow, one needs to strike the right balance between these two aspects.
Although traditional analytical tools such as HPLC or NMR spectroscopy typically require measurement times in the order of several minutes per sample, appropriate high throughput analytical (HTA) techniques that are capable of generating datasets in timeframes of less than a minute or seconds are essential for HTE workflows.
HTA is thus an integral component of HTE and a proper choice of techniques and implementation is essential to the performance of any HTE platform. While chromatography‐based techniques provide extensive information for a given experiment, their throughput is often not sufficient to accommodate HTE setups where, for example, several 96‐, 384‐, or even 1536‐well microplates need to be analyzed within a day.
Much progress has already been made in recent years to further reduce the analytical cycle time, to the extent that same‐ or next‐day analysis is possible, as is required for most HTE workflows. Further evolution of analytical techniques will however be needed to support future HTE setups in order to avoid that analytics become the time‐limiting factor. Besides speed, the selection of appropriate analytical tools should also be based on how universally a technique can be applied and how well it is able to generate ‘quantitative’ data (absolute concentrations). Because of their versatility and selectivity, chromatography‐based techniques are often at the heart of an HTA setup. NMR is the preferred technique for quantitation, as relative concentrations can be determined without the use of standards and the absolute concentrations of components within a mixture can be determined with a single standard. Nevertheless, NMR is a relatively slow technique typically requiring several minutes per sample. MS has gained widespread use in HTA workflows as it is capable of combining high sample throughput (in the order of a few samples per second) and high selectivity (cf. mass‐based target confirmation). On the downside, MS‐based techniques cannot provide accurate quantification in a straightforward manner and may suffer from issues such as ion suppression and other matrix effects.
Earlier reviews have been published on HTA, covering a timeframe up to 2019. 11 , 12 This review aims to provides a critical overview of literature published between early 2019 and September 2020. We have surveyed the rapidly growing field of HTA, covering established chromatographic techniques as well as recently introduced spectroscopic and microfluidics‐based approaches; the review was structured accordingly. The focus was directed to HTA platforms and approaches in the context of small molecule drug discovery and chemical and pharmaceutical development.
2. THIN‐LAYER CHROMATOGRAPHY
Though TLC is one of the oldest, simplest, and most common analytical techniques to determine the rate of conversion in a chemical reaction it has not received much attention in the context of high throughput screening (HTS). Because of the limited throughput and the fact that detection and quantification is often not straightforward, we however believe that it has little value in the HTE space. The low throughput can however be increased to some extent by spotting of multiple samples on a single TLC plate. Welch and co‐workers 13 further improved the throughput by using staggered parallel spotting (Figure 1) and automated computer image processing tools to calculate reaction yields and conversion.
FIGURE 1.

Modeling and initial studies using dyes from microplates spotted on TLC plates using a staggered spotting approach. A, Excel modeling showing “sweet spot” of Rf ∼0.5 for most effective visualization. B, Elution of spots from a 96‐well plate containing samples of methylene blue (Rf ∼0) and methyl red (Rf ∼0.6) using 95% ethanol/water. C, Analysis of plate containing four wells spiked with additional methyl red allows easy determination of the “address” of the hits. Reprinted with permission from J. Org. Chem. 2020, 85, 15, 9447–9453. Copyright 2020 American Chemical Society
3. LIQUID CHROMATOGRAPHY
Many HTE analytical workflows are using liquid chromatography as a key analysis technique. The simplest way of increasing throughput of the analytical platform is to reduce the measurement time per sample. Several approaches have been adopted to shorten the LC analysis time such as the application of high temperatures 14 , 15 or the use of monolithic columns 16 , 17 or parallel segmented flow columns. 18 These adaptations provide relatively modest gains in analysis speed.
3.1. Ultrahigh‐Pressure LC
A significant reduction of analysis time was achieved several years ago by the introduction of ultrahigh‐pressure LC (UHPLC) systems and sub‐2 µm diameter stationary phase particles, 19 but significant efforts continue to be directed toward improving the speed and throughput of the LC technique for HTA purposes. 20 By using custom‐made devices featuring very short bed lengths, optimized geometries, and application of signal processing tools, Armstrong and co‐workers have pushed separation speeds down to the sub‐second timeframe (Figure 2), thus approaching sensor‐like throughput. 21 Despite the substantial evolution in commercially available column technology and instrumentation, 22 additional improvements that reduce the peak dispersion introduced by frits, tubing, and other parts of the instrumentation are needed to make such leaps in performance available to users in the industry. 23 Recently published work on the gain that may be expected from extremely high‐pressure separations 24 , 25 showed that the separation speed can be doubled when systems are capable of working at pressures up to 3000 bar and by using columns packed with 1 µm diameter particles (Figure 3). The prediction that one can expect a factor of 2 gain in separation speed versus a threefold increase in pumping pressure indicates that any evolution in this field seems to adhere to the “law of diminishing returns”: an increasingly bigger effort is required to achieve decreasingly smaller or less significant improvements. The authors also stated that many further developments are needed, such as the large‐scale production of well‐packed 1–1.2 mm internal diameter columns, the production of uniform and mechanically robust 1 µm particles, the design of instruments and detectors with a significantly reduced overall dispersion, pressure‐tolerant column housings, connectors, and valves, as well as sufficiently precise pressure‐compliant flow meters. Pushing the speed of LC analysis to timeframes of less than a minute using current commercially available instruments and columns has been achieved by the use of very short columns packed with small diameter particles and the application of high flow rates. 26
FIGURE 2.

Sub second HILIC separations of structurally and functionally related analytes on bare 1.9µm SPP silica packed in 1.0 × 0.3 cm i.d. columns at flow rates of ∼8 mL min. Reprinted with permission from Anal. Chem. 2018, 90, 5, 3349–3356. Copyright 2018 American Chemical Society
FIGURE 3.

Kinetic plot showing the potential gain in analysis time by increasing the pressure limit for a number of common particle diameters. Reprinted with permission from Anal. Chem. 2020, 92, 1, 554–560. Copyright 2020 American Chemical Society
Whereas the use of small particle diameters saw a rapid uptake in the field of achiral analysis, the area of chiral analysis was lagging somewhat behind with sub‐2 µm immobilized chiral stationary phases (CSPs) becoming commercially available in 2016. Since then several groups have started to explore the use of sub‐2 µm fully porous particles (FPPs) for fast enantioselective LC methods, whereby the analysis time was reduced to a few minutes (Figure 4). 27 , 28
FIGURE 4.

Separation of enantiomers of 13‐HOTrE, 12‐HETrE, 14‐HDoHE, and 5,6‐DiHETE. Blue line shows chromatogram from a corresponding oxidized PUFA and red trace shows chromatogram from a pure standard (in case of 13‐HOTrE, 12‐HETrE and 14‐HDoHE standards were pure S enantiomers and 5,6‐DiHETE was a racemic mixture of cis‐ enantiomers). Reprinted with permission from J Chromatogr A, 2020. 1624: p. 461206. Copyright (2020) Elsevier Publishing
When columns packed with very fine particles are operated at high mobile phase velocities and back pressures, the friction between the mobile and stationary phase generates heat that causes additional peak broadening. 29 This issue has recently been addressed by Lesko et al who showed that the effect of viscous heating could be mitigated by using a more heat‐conductive diamond‐based stationary phase. 30
3.2. Superficially porous particles
Besides the use of small‐diameter particles, which require instruments capable of working at high pressures (> 1000 bar), the use of superficially porous particles (SPPs), also known as core‐shell particles, has been a popular way to perform rapid analyses without the need for high‐pressure instruments. The advantage of SPP columns lies in the fact that the stationary phase particles provide significantly reduced plate heights, similar to those of sub‐2 µm particles, due to a reduction of the analyte diffusion path length. The latter affects the A (eddy diffusion) and C (resistance to mass transfer) terms of the van Deemter equation. Because of the larger overall particle diameter, the higher separation efficiency is achieved without the use of high column pressures.
Though conceptually dating from the 1970s, modern SPPs were introduced commercially only in 2006 with 2.7 µm Halo particles featuring a 1.7 µm nonporous silica core and a 0.5 µm thick shell of porous silica. 31
When comparing FPP and SPP particles, most authors have found that SPPs offer more opportunities for increased throughput than FPPs. Evaluation of the chromatographic performance based on van Deemter curves showed that columns packed with SPP particles performed better than FPP columns. 32 , 33 , 34 A kinetic plot‐based evaluation further demonstrated that SPP columns represent the most favorable compromise in terms of speed, efficiency, and pressure drop, enabling sub‐minute separations with much lower pressure drops. Godinho et al 35 studied the use of SPPs for the analysis of polycyclic aromatic hydrocarbons. They demonstrated that, for similar levels of selectivity, fully porous 1.8 µm particles and superficially porous 2.7 µm particles showed similar efficiency but less back pressure was generated on the SPP column. Using the SPP column increased throughput and enabled them to separate a 16‐component sample mixture in a mere minute timeframe (Figure 5). The benefits of SPP columns have also been acknowledged for supercritical fluid chromatography (SFC) separations (see section 6).
FIGURE 5.

Experimental chromatograms, using conditions modeled in silico, depicting the SPP (A) and FPP (B) columns. These gradients are both at 3 mL/min flow rate. For the SPP column 50% acetonitrile was held for 1 min and increased to 100% acetonitrile by 1.2 min. For the FPP column 50% acetonitrile was held for 1.5 min and increased to 100% by 1.7 minu. Note the overall faster runtime for the SPP column. Reprinted with permission from J. Chromatogr. A, 2020. 1628: p. 461‐432. Copyright 2020 Elsevier Publishing
3.3. Open tubular columns
Another approach to reduce the analysis time is to step away from the common packed‐bed format employed in LC in favor of the open tubular (OT) column format, usually associated with GC. The OT format, proposed in the 1970s, 36 theoretically leads to lower plate heights because of the absence of eddy dispersion and potentially offers better kinetic performance. The format never became popular because of the tradeoff that exists between high efficiency (use of very narrow capillaries) and the restricted mass load ability of such small internal diameter columns, leading to issues with detection.
Calculations by Causon et al provided guidance on the design of OT columns, balancing their kinetic performance and loadability. 37 The loadability of OT columns has been improved by coating the inner surface of an OT capillary column with thin, porous (octadecylsilylated) silica layers, 38 , 39 yielding column efficiency improvements in the order of 15%.
Since then few authors have demonstrated the potential of using OT columns for ultrafast LC separations. Xiang et al recently demonstrated the concept using a 2.7 cm long, 2 µm wide OT column. With this miniaturized column and an optimized laser‐induced fluorescence detection scheme, six peptides could be resolved in 0.7 s (Figure 6) and trypsin‐digested cytochrome C separations could be completed in 10‐50 s. 40
FIGURE 6.

Typical ultrafast NOTLC separations. A, NOT column: 2‐µm‐i.d. × 6 cm‐length (2.7 cm effective) coated with C18; MA: 10 mM NH4HCO3; MB: 50% acetonitrile in 10 mM NH4HCO3; mixer: mixer 2 in (C); Elution pressure: 23 MPa; Injected sample volume: ∼120 pL. Sample: 1 µM gly, 3 µM tyr, 3 µM ala, 3 µM arg, 10 µM trp and 2.5 µM phe. Reprinted with permission from Xiang, P.; Yang, Y.; Zhao, Z.; Chen, M.; Liu, S. Anal. Chem. 2019, 91, 10738−10743. Copyright 2019 American Chemical Society
4. SUPERCRITICAL FLUID CHROMATOGRAPHY
Fast or ultrafast separations have often been linked to the use of SFC, and analysis times in the order of minutes or even seconds 41 are indeed achievable. 5 , 42 , 43 , 44 , 45 In most cases, the SFC‐based approach yields higher throughput than LC‐based approaches. 46 Armstrong and co‐workers demonstrated separations on the order of just a few seconds using sub/supercritical CO2 in conjunction with high‐efficiency, narrow particle‐size distribution silica packed in short columns and using very high flow rates (up to 19 mL min‐1). 47 The authors did point out that, as the analysis time is going down toward the order of seconds, some unexpected peculiarities are seen which are absent in ultrafast LC and which affect the apparent efficiency of the system. Such effects can be attributed to the compressible nature of the mobile phase and in order to fully exploit the benefits of ultrafast SFC separations great care needs to be taken in the design of the system, the choice of tubing, and the back‐pressure regulator design. The theoretical limits of current systems and column formats have been extensively studied in a recent paper by Desmet et al. 48 and it seems there is a general consensus that, at this moment, column technology is ahead of instrumentation capabilities and that any further increase in performance will likely need to come from further instrument optimization.
Berger reported on the fast SFC separation of achiral solutes using short 20–30 mm columns packed with sub‐2 µm particles 49 while addressing the need to reduce extra‐column dispersion. By reducing the system's extra‐column dispersion from 80 to 5 µL2 he was able to obtain reduced plate heights as low as 2.2 and resolve 7 solutes in less than 8 seconds on a 2 cm long column. Important factors influencing the efficiency in this experiment were the choice of injection solvent and injection volume.
Similar to the benefits for LC that were described above, the advantage of using SPPs in SFC mode has been demonstrated by several authors. In a study focused on the chiral analysis of pesticides and their stereoisomers, Hellinghausen et al. 50 reported < 1 min separations for the majority of compounds that were studied using 2.7 µm SPPs. By exploiting the low viscosity advantage of the CO2/MeOH mobile phase, allowing the application of very high flow rates (up to 14 mL/min), and using high‐efficiency 2.7 µm chiral SPPs, Roy and Armstrong were able to do chiral separations in a timeframe of 13 seconds. 51 The authors claimed that even faster separations may be achieved if advances in SFC instrumentation could address some shortcomings involving extra‐column effects and pressure limitations. Such improvements would unleash the full potential of SPPs and other small particle supports. Recently, other groups have also reported on the use of SPPs in SFC conditions for chiral analyses. Mazzoccanti et al 52 studied a set of 31 racemates of derivatized amino acids which could be resolved on a teicoplanin‐based chiral selector bonded on either 1.9 µm FPPs with a narrow particle‐size distribution or on 2.0 µm SPPs, achieving better results on the SPP phase versus the FPP version. Similarly, Folprechtova et al 53 have applied such teicoplanin‐based SPP‐packed chiral columns for SFC separations of phytoalexins, substituted tryptophan's, and ketamine derivatives. Ultrafast separations and screening of chiral compounds using OT columns in SFC mode was done by Galietti et al 54 using turbulent flow conditions. The authors used CO2 at relatively high flow and GC OT columns to achieve turbulent flow conditions. Upon transitioning from laminar flow to the turbulent flow regime they observed a reduction in plate height leading to a nearly threefold increase in peak capacity. The observation was explained by the more efficient mass transfer in the mobile phase due to a flatter flow profile and faster analyte dispersion across the OT column. The use of turbulent flow conditions in OT columns allowed to separate four polycyclic aromatic hydrocarbons within a 2.2 s window (Figure 7).
FIGURE 7.

Turbulent flow SFC open tubular column separation of 7 polycyclic aromatic hydrocarbons. Reprinted with permission from Anal. Chem. 2020, 92, 11, 7409–7412. Copyright 2020 American Chemical Society
5. MULTIPLE INJECTIONS IN A SINGLE EXPERIMENTAL RUN
A popular and user‐friendly way of monitoring a large set of experiments by LC or LC‐MS in a high throughput fashion is the so‐called ‘Multiple Injections in a Single Experimental Run’ (MISER) approach developed by Christopher Welch during his time at Merck & Co. 55 MISER chromatography lends itself well to kinetic analysis/profiling and relies on sequential sample injections with minimal chromatographic separation of the analytes of interest from interfering substances. The proportion of solvent used during a MISER run is chosen in such a way that there is minimal interaction with the stationary phase, thus accelerating the passage of the analyte(s) through the column. The objective is not to fully separate all peaks but only to resolve matrix or interfering peaks and reduce/remove potential ion‐suppression or other matrix effects. Once the mobile phase has been optimized, the speed at which samples can be tested is essentially only limited by the injection rate of the autosampler.
MISER analysis is typically used for comparing related samples that contain the same compound of interest but have been prepared using different conditions. 56 , 57 , 58 The collection of results is termed a ‘misergram’ (Figure 8) and allows for simple evaluation of the data. The approach has been very successful in catalyst discovery where the screening of a large number of reactions is required. Although most often used in conjunction with LC or LC‐MS, SFC‐ and GC‐based MISER workflows have been reported as well. An example is the MISER‐GC‐MS setup described by Knorrscheidt et al. 59 which is capable of analyzing a 96‐well microplate within 60 minutes.
FIGURE 8.

Identification of novel unspecific peroxygenase chimeras and unusual YfeX axial heme ligand by a versatile high‐throughput GC‐MS approach. Reprinted with permission from ChemCatChem, 2020. 12(19): p. 4788‐4795). Copyright (2020) Wiley‐VCH Verlag GmbH & Co KGaA
6. ON‐CHIP CHROMATOGRAPHY
A significant parameter influencing the separation efficiency and hence speed and throughput is the detrimental effect of so‐called extra‐column volumes (cf. tubing, detector, etc.) on peak broadening. One way of reducing these effects is by using microfluidic systems in which all components are integrated on a chip. Since the first demonstration of microfluidic chip‐based LC, 60 significant advances have been made in chip design and fabrication. The use of higher pressures and novel on‐chip injection and detection strategies have significantly enhanced the performance of these devices. Advances in fabrication techniques such as 3D printing 61 have also paved the way for producing such systems at low cost. 62 One of the benefits of the planar chip format is the improved heat transfer. This property has been exploited for separating analytes at high temperatures in < 30 s in both isocratic and gradient HPLC modes. 63
Coupling a chip‐based chromatographic separation device to an ion mobility spectrometer (IMS) enabled 2D analysis within a sub‐minute timeframe, demonstrating the use of IMS as a new detection method for chip‐based HPLC. 64 Using a TOF‐MS coupled to chip‐based LC, Zheng et al were able to automate a high throughput drug screening platform used in pharmaceutical industry. 65
Besides relying on miniaturization to achieve faster separations, throughput can also be increased by fabricating devices that include multiple, parallel separation channels. Komendova et al 66 recently reported on a titanium device with four parallel channels that was manufactured by 3D printing and that featured an electrochemical detector capable of simultaneous analysis of dopamine precursors and metabolites.
7. GAS CHROMATOGRAPHY
Gas chromatography (GC) is a common analytical tool that is particularly useful for the analysis of more volatile compounds, and it certainly has a place in the HTA field. Classical GC systems lack the required speed to support HTE workflows, but some approaches that enable more rapid analyses have been developed. Recently, Fialkov et al. 67 achieved reasonably good separations with cycle times of less than 1 min by combining low‐pressure (vacuum outlet) GC‐MS (LPGC‐MS) with low thermal mass (LTM) resistive heating for rapid heating and cooling of the capillary column. They threaded the analytical column into LTM thin‐walled metal tubing inside an "LTM Fast GC” module that was mounted onto a detector port of a classical GC system. The column inlet and outlet were connected to the GC injector and MS transfer line, respectively (Figure 9). The inlet operates at normal GC pressures, but the analytical column is under vacuum, which increases the optimal helium carrier gas flow velocity and the speed of full range separations while maintaining an acceptable quality of chromatographic separation. The LTM‐LPGC‐MS configuration provided a 64‐fold gain in speed of analysis versus standard GC‐MS at the expense of a 4‐fold loss in peak capacity (Figure 10), and could reduce the analysis time from minutes to seconds in some common applications.
FIGURE 9.

Schematic diagram of the low thermal mass fast GC module installed on an available FID port atop an Agilent 7890 GC configured for GC‐MS. Note the capillary column combination in fast LPGC‐MS operation. Reprinted with permission from J. Chromatogr. A, 2020. 1612: p. 460691. Copyright (2020) Elsevier Publishing
FIGURE 10.
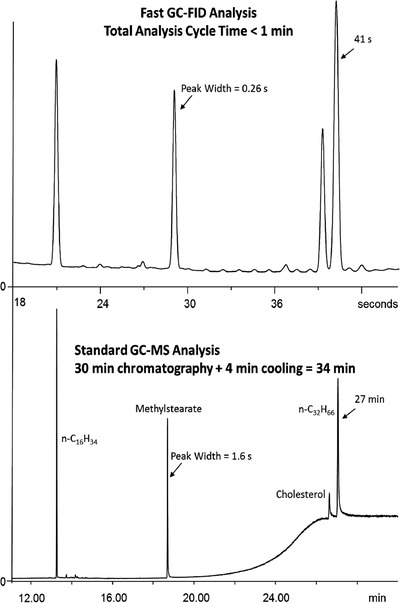
Fast GC‐FID analyses (top) of a test mixture of 10 ng/ µL each of n‐C 16 H 34 , methyl stearate, cholesterol, and n‐C 32 H 66 injected with 9:1 split (1 ng each on column). The fast GC‐FID trace is compared with GC‐MS analysis of the same test mixture (bottom) using a standard 30 m, 0.25 mm i.d. column. The 34 min GCMS analysis was reduced to ≈1 min full analysis cycle time using the fast GC‐FID method. Reprinted with permission from J. Chromatogr. A, 2020. 1612: p. 460691. Copyright 2020 Elsevier Publishing
8. MASS SPECTROMETRY
MS‐based analysis offers benefits highly desirable in HTA, such as high speed combined with the ability to identify and quantify compounds in a mixture. The ability to selectively monitor the mass of a particular target is very useful for, for instance, hit and lead identification or chemical reaction screening. These advantages have led to the rapid adoption and development of MS‐based tools in HTE workflows in the industry and have stimulated academic research efforts to develop innovative approaches. In traditional LC‐MS setups relying on ionization techniques such as ESI, APCI, or APPI, 68 significant gains in analysis speed have been achieved by automating the sample preparation steps and using optimized, short UHPLC methods. 69 , 70 , 71 , 72 , 73 More specific reviews on novel MS‐based tools and approaches for HTA have been written by Kempa et al 74 and Pu et al 75 and were focused on methodologies that automate or remove sample preparation steps in hit and lead generation or reaction screening and optimization.
One example of a commercially available MS system for HTA is the Agilent ‘RapidFire MS’, in which an SPE‐based sample‐cleanup robotics workflow is coupled to ESI‐MS detection and which enables analysis times as short as 5‐10 s per sample. Such platforms are typically used for screening or compound profiling tasks where the desired throughput is in the range of < 5000 samples/day. 76 However, the technology does not meet the demands of screening assays that involve the analysis of tens of thousands up to millions of samples per day. These needs have led to the development of techniques such as surface‐based MS or microfluidics systems that require little to no sample preparation and push the analysis speed into the sub‐second timeframe. Direct infusion (DI) MS techniques or flow‐injection (FI) MS, where samples are directly injected into the ionization source, saw early uptake in the HTA field, for example, for reaction screening. 77 A downside of this approach is that samples are introduced without prior separation or cleanup which may lead to ion competition, lowering the sensitivity or obscuring the result. Sarvin et al described an approach to overcome this effect by analyzing the distribution of ion m/z values and computationally determining a series of optimal scan ranges in metabolomics and lipidomics analyses of serum samples. 78
The most common bottleneck in DI or FI analysis is the sampling rate, which is often significantly slower than the actual acquisition of MS data. To fully exploit the strengths of the MS system, the instrument should be rapidly supplied with small volumes of sample. Since the speed of traditional LC‐MS approaches is inherently limited by the speed at which each experiment can be sampled by an autoinjector to introduce it into the MS ionization chamber, new ways of sample introduction were developed. This has led to the advent of a new class of ionization techniques, commonly known as “ambient ionization MS” (AIMS) whereby samples are ionized at atmospheric pressure. Some surface/plate‐based techniques require that samples are first deposited onto a suitable carrier or incorporated into a suitable matrix, after which rapid in situ analysis is possible. These developments have revolutionized the HTA space because AIMS techniques enable throughputs that are orders of magnitude higher than those of conventional LC‐MS tools, approaching analysis rates that are achievable with fluorescence‐based techniques but without the need for fluorescent labels. Several surface‐based MS techniques, such as matrix‐assisted laser desorption/ionization (MALDI), direct analysis in real‐time (DART), desorption electrospray ionization (DESI), secondary ion mass spectrometry (SIMS), and self‐assembled monolayers coupled with desorption/ionization (SAMDI), are capable of direct ionization of analytes with little to no sample preparation and have been demonstrated to be applicable in situations that require short analysis times and very small sample volumes. 79 , 80 An in‐depth review of the many AIMS approaches that have been reported thus far has been written by Kuo et al. 81 Below we will focus on some of the most common techniques. Some AIMS techniques, such as surface‐assisted laser desorption/ionization (SALDI) mass spectrometry, have been used for online monitoring of photocatalytic reactions and for ultrafast photocatalyst screening. 82 In this study, a photocatalytic nanomaterial was used as the substrate to initiate and monitor the reactions simultaneously. The measurements revealed a reaction acceleration effect: the interfacial reactions proceeded in seconds, versus hours for conventional reactions in the bulk phase; this is attractive for ultrafast reaction screening.
8.1. Matrix‐assisted laser desorption/ionization
MALDI‐MS is one of the oldest and most validated implementations of ambient, surface‐based MS. The analyte is co‐crystallized on a surface together with a suitable matrix and then subjected to UV laser light, which desorbs and ionizes the analytes. 76 MALDI coupled with time‐of‐flight (MALDI‐TOF) MS has been used extensively for ultrahigh‐throughput screening of large molecules, with many literature examples related to drug target identification proteomics and analysis of DNA/RNA, lipids, oligosaccharides, and synthetic polymers. Conventional MALDI‐TOF‐MS has various limitations in analyzing small molecules owing to fragmentation of organic matrix molecules and matrix interferences in the lower mass range. Therefore, its use for small molecule analysis has not been developed as exhaustively. Nonetheless, some groups have demonstrated the possibility of using MALDI for small molecule applications, even for the rapid analysis of crude reaction mixtures containing catalysts, salts and bases (e.g., 1536 reactions in ∼10 min). 83 Using a parylene‐matrix chip, Park et al 84 were able to use MALDI‐TOF‐MS for the high throughput quantification and analysis of small‐molecule cancer biomarkers. Recently, Blincoe et al 85 published a practical guide for bench chemists on how to develop and evaluate high throughput MALDI‐TOF‐MS methods for the screening of chemical reactions in well plates without application of any MALDI plate modification or product tagging (Figure 11). Simon and co‐workers 86 demonstrated the applicability of automated, direct MALDI‐TOF‐MS as a readout strategy for large‐scale drug discovery HTS campaigns. They used a MALDI‐TOF‐based screening platform in conjunction with a 1536‐well format for identifying inhibitors of human cyclic GMP‐AMP synthase in a fast, robust, and accurate way.
FIGURE 11.

Decision tree for determining if a small molecule reaction mixture is suitable for MALDI analysis. Reprinted with permission from Tetrahedron, 2020. 76(36): p. 131434. Copyright (2020) Elsevier Publishing
Analyses or assays of compounds in biological matrices are particularly challenging for different MS ionization methods. The issue could be due to ion signal suppression imparted by the matrix or general incompatibility with the MS technique, such as presence of nonvolatile salts or, in the case of MALDI, inhibition of the matrix crystallization. Krenkel et al 87 investigated the use of liquid support matrices for the analysis of peptides, antibiotics, and lipids in complex biological fluids by MALDI‐MS. Throughput and robustness were found to be mainly dependent on the complexity of the sample composition and the current limitations of the commercial hardware. It was shown that traditional label‐based, non‐MS assays could be adapted for MALDI‐MS analysis and that the implementation of an additional MALDI spot washing step could reduce buffer concentrations and make more assays accessible for analysis with MALDI‐MS. The authors stated that the liquid atmospheric pressure MALDI conveniently combines the analysis speed of conventional solid‐state AP‐MALDI and the versatility of ESI. In terms of speed the authors estimated that liquid AP‐MALDI could, in principle, reach a sample throughput beyond 10‐20 samples per second (Figure 12), making the technique highly competitive compared with other label‐free MS methods.
FIGURE 12.
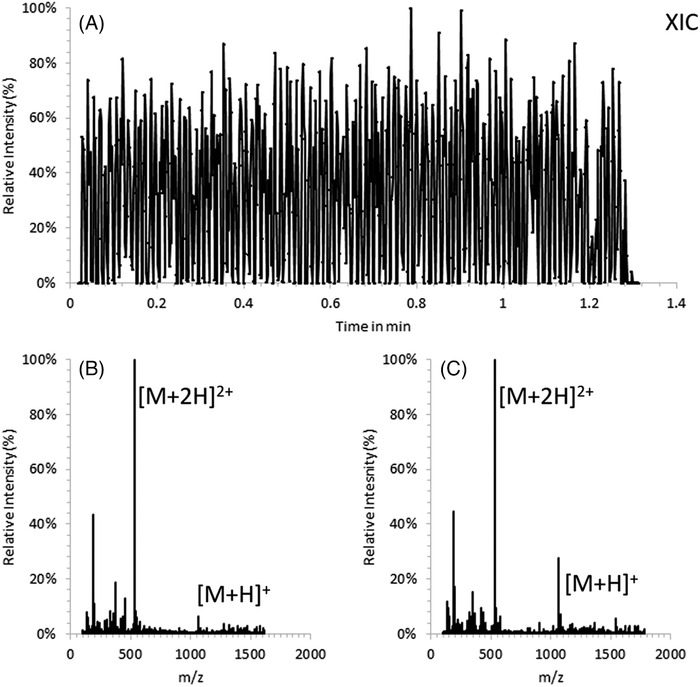
A, Liquid AP‐MALDI extracted ion chromatogram (m/z 530.79) of 96 sample wells with bradykinin as analyte (1 µL total sample volume spotted, 25 pmol analyte on target) at 5 mm/s stage movement speed. B, Mass spectrum of all scans acquired for the first sample. C, Mass spectrum of all scans acquired for the last sample. Reprinted with permission from Anal. Chem. 2020, 92, 2931‐2936 (https://pubs.acs.org/doi/abs/10.1021/acs.analchem.9b05202). Copyright 2020 American Chemical Society. Further permissions related to the material excerpted should be directed to the ACS
8.2. Direct analysis in real time/desorption electrospray ionization
From the MALDI technique, other MS methods such as desorption electrospray ionization (DESI) and direct analysis in real time (DART) originated. Due to its capability of rapid screening of analytes in complex matrices with minimal sample preparation, DART has become a popular tool in areas such as food safety monitoring and environmental applications 88 or to check for drug counterfeiting or contamination. 89 Khaled et al adopted an SPME‐DART‐based HTS workflow for screening multiresidue pharmaceutical drugs in bovine tissue samples. 90 They demonstrated that 53% of the 98 target analytes could be efficiently ionized by DART and quantified at the required level, while the fully automated sample preparation workflow allowed for total analysis times as short as 1 min per sample. While DART showed limited capabilities in terms of analyte coverage, their research highlights the potential usefulness of SPME‐DART‐MS/MS as a method for rapid analysis in food safety monitoring applications.
Another ambient ionization technique that has attracted much attention is DESI. Since its inception in 2004, it has been a popular research topic in the field of HTA. In its simplest form, a DESI–MS setup uses an aqueous spray directed at an insulating sample or an analyte deposited on an insulating surface such as polytetrafluoroethylene (PTFE). The DESI‐MS inlet is then moved across the surface using an x–y stage and a 2D map of chemical information in the form of full mass spectra can be generated. As compared to MALDI‐MS, the DESI technique has the advantage that no matrix is needed to perform the experiment and that multiply charged ions can be generated, which has the benefit of extending the mass range of the detector required for large molecules or biological samples. The desorbed ions are sampled with a commercial ion trap mass spectrometer equipped with an atmospheric interface connected to an extended, preferably flexible ion transfer line made out of metal or an insulator. DESI has been successfully used for the ionization of various compounds, including peptides 91 and proteins present on metal, polymer, and mineral surfaces. 92 The ability to record mass spectra of samples in their native environment that does not require sample preparation by creating ions outside the instrument, enables extremely rapid analysis with high sensitivity and high chemical specificity, characteristics that are highly sought after for HTA.
In recent years, the DESI technique has been extensively applied to HTA for small molecule reaction screening and optimization. For example, Cooks and co‐workers optimized amine alkylation reactions on PTFE membrane substrates using methanol as the DESI spray/analysis solvent. 93
One form of DESI, referred to as “reactive DESI”, is used in the screening of chemical reactions and involves adding reagents into the spray solvent which can selectively react with specific functional groups present in the mixture. Reactions can occur during the microdroplet–surface collisions at higher rates than in bulk solutions. 94
Loren et al used DESI‐MS as a tool for qualitatively predicting the outcomes of microfluidics‐based rapid screening of N‐alkylation reactions. 95 Through the use of DESI‐MS HTA they were able to quickly narrow down the number of critical reaction parameters, such as the type of solvent. Similar work but focusing on Suzuki–Miyaura cross‐coupling and reductive amination reactions was published by Fedick et al. 96 Their DESI‐MS system utilized microdroplet‐based reaction acceleration, allowing multiple reagents, bases, and stoichiometries to be screened at rates close to 10,000 reaction mixtures per hour (i.e., approximately 3 Hz). Cooks, Thompson, and co‐workers optimized nucleophilic aromatic substitution reactions by means of HTE under flow conditions. They could evaluate 3072 unique reactions at a speed of ∼3.5 s per reaction using a system that included both a liquid handling robot for reaction mixture preparation and a DESI‐MS module. The reactions were performed in microtiter arrays. Using in‐house developed software, heat maps were generated from the MS data and these facilitated rapid evaluation and selection of the most promising conditions (Figure 13). Authors from the same research group used a similar approach for screening 3840 unique reductive amination reactions. 4
FIGURE 13.

Heat map of 1536 reactions (768 in droplet/thin film and 768 in bulk microtiter at three time points) from round 2 of the SNAr HTE using MeOH with 1% FA as the DESI spray solvent and NMP as the reaction solvent. (A) Droplet/thin film and bulk microtiter at 150°C. (B) Droplet/thin film and bulk microtiter at 200°C. Blue cells represent successful reactions (average product intensity ≥ 150 counts). Red cells represent unsuccessful reactions (average product intensity < 150 counts). Reprinted with permission from ACS Comb. Sci. 2020, 22, 4, 184–196. Copyright 2020 American Chemical Society
Using DESI‐MS, Sobreira and co‐workers 98 reached analysis times of up to 1 reaction mixture per second in a study of N‐alkylation, N‐acylation, and N‐sulfonylation reactions. The measurements showed high repeatability (94–97%) and a false negative rate of about 6% (depending on the chosen noise threshold).
Cooks and co‐workers 99 used DESI‐MS for enzymatic assays that are normally performed using labeled compounds and plate readers. DESI‐MS allowed to perform analyses directly from the bioassay matrix with an effective analysis time of 0.3 s per sample. The enzymatic process was studied through monitoring of the substrate and product after an external calibration.
8.3. Acoustic droplet ejection
Recent advances in acoustic sample handling and introduction to MS interfaces have further reduced the total analysis time by circumventing the need for spotting samples onto a surface or plate before the actual analysis. Such acoustic ejection MS (AEMS) platforms have recently become commercially available (eg, Echo MS system offered by SCIEX or Acoustic Mist Interface (AMI) offered by LabCyte/Waters). In AEMS, femto‐ to nanoliter volume sample droplets are acoustically dispensed (ie, ejected in a contactless way) from microtiter plate wells into a continuous fluid transfer open‐port interface (OPI) for subsequent ionization at atmospheric pressure. The AMI format uses customized commercial acoustic liquid handlers to eject electrically charged droplets directly from well plates into a custom transfer interface where desolvation and ionization occur in ESI mode.
Researchers from AstraZeneca 100 , 101 have reported on the development and application of an AMI interface in the field of drug discovery for triage assays and metabolic profiling. The system was capable of contactless nanoliter‐scale transfer of up to three samples per second into a mass detector. Plate handling automation allowed to reach a throughput of 100 000 samples per day on a single mass spectrometer. As a proof of concept, the AMI‐MS platform was used to identify inhibitors of a human histone deacetylase from AstraZeneca's collection of 2 million small molecules. More recently, DiRico and co‐workers at Pfizer 102 reported on the use of a ultrahigh‐throughput reader platform based on ADE‐OPI‐MS for reaction screening within a drug discovery context (Figure 14).
FIGURE 14.

Acoustic droplet ejection‐open port interface. Reprinted with permission from Med. Chem. Lett. 2020, 11, 6, 1101–1110. Copyright 2020 American Chemical Society
The use of AEMS was also demonstrated in the field of bioanalysis for analyzing polar analytes. It is challenging to measure such analytes in biological matrices using conventional LC‐MS/MS because of their poor chromatographic retention and the ion suppression from co‐eluting matrix components. Wagner et al. from Bristol‐Myers Squibb 103 presented an AEMS‐based platform to perform ultrahigh‐throughput and chromatography‐free bioanalysis of polar compounds. When comparing the results from actual assay samples obtained by AEMS to those obtained by the fastest previously reported LC‐MS/MS method, a 15‐fold speed advantage and approximately 500‐fold lower sample consumption was demonstrated. Also, Häbe et al 104 from Boehringer Ingelheim published on an AEMS system used in HTS and achieving maximum sampling rates of 6 Hz.
Several other publications on AEMS‐based platforms have appeared over the recent months, highlighting its promising potential for HT compound screening and profiling. 105 Liu et al 106 evaluated some key performance metrics, such as well‐to‐well sampling speed, droplet volume calibration, precision, and reproducibility, of an in‐house built system and introduced a new method to measure the volume of individually dispensed droplets, which is useful to aid method validation and tuning of acoustic dispensing parameters for samples having a wide range of viscosities and surface tensions. They discussed the various modes of operation and demonstrated the first use of a 1536‐well plate format in AEMS. They also described ways of increasing the detection dynamic range and a “continuous infusion” mode that provided a low sample consumption sustained steady‐state signal for analyte detection optimization, improved ion statistics, and a higher signal‐to‐noise ratio. Their setup featured a drastically reduced transfer distance between the OPI and the ESI electrode for optimum throughput and achieved sampling rates up to 6 Hz.
Specific metrics and comparing pros and cons for the different AIMS approaches is given in (Table 1).
TABLE 1.
Comparison of the High Throughput MS Technologies (not all have been described in detail in the current review). Reprinted (adapted) with permission from ACS Med. Chem. Lett. 2020, 11, 11, 2108–2113. Copyright 2020 American Chemical Society
| Technology | Direct Analysis | Theoretical Throughput | REFs | Limitations | Commercialized/ Vendor |
|---|---|---|---|---|---|
| MALDI | No | 10 Hz 87 | 76, 83–87 | Requires matrix treatment Incompatible with salt and detergent Ionization in vacuum | Yes /Bruker |
| SAMDI | No | 1 Hz 74 | 74 | Requires chemical modification to capture analytes and matrix treatment Ionization in vacuum | Yes /SAMDI Tech |
| RapidFire | No | 0.1 Hz 76 | 76 | Sample preparation may be necessary | Yes /Agilent |
| DESI | Yes | 3 Hz 99 | 4, 88–99 | Subject to matrix effect Sensitivity and reproducibility for quantitation | Yes /Waters a |
| ADE* | Yes | 6 Hz 104 | 100, 101, 102, 103, 104, 105, 106 | Subject to matrix effect Requires homogeneous liquid sample May not be suitable for direct cell/tissue analysis | Yes /SCIEX |
| Droplet Microfluidics | Yes | 30 Hz 113 | 107, 108, 109, 110, 111, 112, 113 | Complex workflow, need encoding to track compound information | No |
ADE = Acoustic Droplet Ejection.
Waters DESI for MS Imaging.
9. MICROFLUIDICS
Another field that has seen rapid development, particularly in the past decade, is the use of microfluidics for ultrahigh‐throughput experimentation and analysis. Like acoustic ejection technology, the use of microfluidic devices in combination with droplet generators does not require the samples to be deposited onto a substrate prior to introducing it into the MS detector. The technology allows to manipulate sample volumes in the microliter to femtoliter range with high precision, which is useful for automating basic laboratory operations in a droplet‐based, miniaturized format. By means of segmented flow, using two immiscible fluids, chemical reactions can for example be performed inside isolated droplets rather than individual wells, and each of the droplets can be analyzed by direct coupling to MS detection. Recent reviews on the development, application and evolution of droplet‐based microfluidic analytical tools have been published by Liu and Zhu 107 and by Kennedy and co‐workers. 108
In 2014, Sun and Kennedy reported on the coupling of a multiwell plate workflow and droplet microfluidics system to MS detection using both ESI and MALDI. 109 Their initial, relatively simple system consisted of capillary tubing and used a multichannel syringe pump to generate segmented flow microdroplets from a 384‐well plate. The individual droplets from a single channel were infused into an ESI‐MS detector at a rate of 0.58 Hz. By using eight parallel channels they could reach an overall analysis throughput of 4.5 Hz in ESI mode. In a more recent publication, 110 the reaction volume was further decreased to a few nL or even the pL range using a “nanoESI” emitter at nL/min flow rates, yielding throughputs of up to 10 droplets per second (ie, 10 Hz; Figure 15). Continuous infusion of droplets into the nanoESI emitter for monitoring in‐droplet enzymatic reactions was demonstrated for as long as 2.5 h, corresponding to the analysis of over 20 000 samples. A linear concentration‐based response and sample‐to‐sample carryover of < 3% were also shown. In an even more sophisticated setup, direct ESI‐MS detection was used to sort out nanoliter droplets in a high throughput fashion in an approach termed ‘mass activated droplet sorting’ (MADS). 111 Distinct from fluorescence‐activated droplet sorting (FADS), the generated droplets are split into two portions: one for MS detection and one for sorting and collection. The use of MS instead of fluorescence‐based detection expands the range of detectable analytes to virtually any molecule that can be ionized via ESI. The throughput of the reported setup was 0.7 samples/sec, but a further increase in speed was deemed feasible by solving current limitations of the MS system that was used. The ability of microfluidic systems to create, assay, and sort microscale samples is attractive in applications where sample preparation and analysis are bottlenecks, such as in the directed evolution of enzymes. Microfluidic droplet sorting enables the high throughput screening and selection of water‐in‐oil microreactors at speeds and volumes that are unparalleled by traditional well‐plate approaches.
FIGURE 15.

Illustration of microfluidic elements that enabled stable analysis of droplets at nL/min flow rates. (A) Overview of entire droplet generator and nESI‐MS system. From left to right, pictured are the syringe pump for driving flow, which leads to the droplet generation chip on a microscope for monitoring droplet formation, followed by transfer to nESI‐MS analysis. (B) Conventional microfluidic droplet generator device setup with 750 µm o.d. inlet and outlet tubing interfaced perpendicular to microfluidic channels. (C) Modified droplet generator with insertion of 150 µm o.d. inlet and outlet capillaries in‐line with microfluidic channels. For (B,C), blue arrows indicate inlet lines, whereas red arrows show outlets. Channels had widths and heights of 100 µm and were filled with green food color to aid in visualization. Reprinted with permission from Anal Chem, 2019. 91(10): p. 6645‐6651. Copyright 2019 American Chemical Society
The Kennedy group also used a similar approach 112 to miniaturize and accelerate liquid‐liquid extractions coupled to MS for rapid analysis. Such liquid‐liquid extractions are typically conducted on microliter to milliliter volume scales, requiring long equilibration times and manual procedures. The approach based on the generation of segmented plug‐flow in a capillary allows multiple extractions to be performed simultaneously using only 5 nL of sample and with the extraction solvent needing only a few seconds extraction time (< 5 s) to reach equilibrium. The method was used to quantify octanol‐water partition coefficients accurately and rapidly at the nL scale. It was also applied to the extraction of analytes from complex biological samples prior to ESI‐MS/MS analysis at a rate of 6 s per sample, allowing for simultaneous determination of five different drugs spiked into human plasma, synthetic urine, and artificial cerebral spinal fluid.
Recent work by Kempa et al 113 further improved the speed of a droplet‐based analyzer for the analysis of crude reaction mixtures, cell lysates, or even live cells to the order of 30 Hz and above. They presented a few designs for chip‐based interfaces that permit the coupling to MS, each having their own advantages and challenges. The potential of the technology was demonstrated by a series of proof‐of‐concept experiments, analyzing small molecules, peptides, and (small) proteins on three commercially available mass spectrometers in challenging mixtures that are representative of real‐life biological matrices (e.g. egg white, unpurified recombinant protein, and a biotransformation supernatant). Depending on the MS platform and configuration used, droplet infusion rates of 6 Hz up to 33 Hz were demonstrated (Figure 16, Figure 17).
FIGURE 16.

Conceptual representation of a droplet microchip design. Reprinted with permission from Anal. Chem. 2020, 92, 18, 12605–12612. Copyright 2020 American Chemical Society
FIGURE 17.

Total ion chromatogram (TIC) acquired during infusion of droplets (∼2.1 nL) containing leucine enkephalin (LeuEnk, ∼1.3 mM solution) at an infusion rate of approximately 5 droplets/s (Hz). Each individual peak indicates one droplet reaching the Agilent 6560 IM‐Q‐TOF detector. Mass spectrum (m/z range 500−600) acquired from one droplet containing LeuEnk ([LeuEnk + H]+ = 556.27 Da. Reprinted with permission from Anal. Chem. 2020, 92, 18, 12605–12612. Copyright 2020 American Chemical Society
9.1. Plate readers
While chromatography‐ and MS‐based workflows are most common, the use of optical methods such as UV and/or circular dichroism (CD) analysis is getting increased attention in reaction or biotransformation screening. 114 , 115 Though generally less accurate than (U)HPLC, such techniques may offer distinct advantages, such as high speed and throughput, and may be used to determine conversion, yield, and enantiomeric or diastereomeric excess (ee, de).
Given the fact that many pharmaceutical compounds contain one or more stereocenters, determination of the ee is important and rapid measurements of enantiopurity is particularly relevant in asymmetric (bio)catalysis studies. Chiral (U)HPLC and SFC may not deliver the speed that is required in an HTA workflow and typically require elaborate and time‐consuming method development. Optical analysis, on the other hand, can be rapidly performed on plate formats and is thus more amenable to HTA. Numerous probe designs and optical assays that yield ee values via CD, fluorescence, or UV absorbance have been developed and reported. 116 , 117 A recent publication by Pilicer et al. 118 explored reagents, instrumentation, and experimental protocols that would be needed for practical high throughput enantioselective analysis using a quartz microplate and CD spectroscopy. The reported setup executed fast CD measurements using vertical optics to accommodate either 96‐ or 384‐well microplates. Variation of the scanning time per well (from 1 to 25 s) showed that the precision of the readings was optimal for an integration time of 3 s. In cases where less accurate data would be sufficient, such as for HTS purposes, the scanning time could be reduced to 0.8 s per well. Under such conditions, and taking into account the time needed for well‐to‐well movement, CD analysis of 96 samples could be achieved in approximately 4 min.
10. SUMMARY AND OUTLOOK
This review covered some of the recent developments and approaches to increase the throughput of chromatographic and spectroscopic techniques as well as advances in sample manipulation to make them suitable as HTA tools in a HTE workflow. Much sought‐after benefits include speed, universality, sensitivity, and accuracy. Typically, one must strike a balance between the required analysis speed for a given application and the quality or level of information of the generated data, respectively.
The use of ultrafast chromatographic and/or MS‐based techniques are essential tools in HTA that need to be applied according to the data that is desired. From an analysis speed perspective, significant strides have been made in the field of (ultra)fast chromatography, and theoretical modeling predicts that further advances are still possible if the current system design is improved and pressure limitations are overcome. Nonetheless, it is unlikely that, in the short to medium term, chromatographic techniques will match the level of (sub‐second) throughput that is already offered by some or droplet microfluidics or MS platforms although trade‐offs exist when using MS without prior separation by chromatography.
Multidimensional separations (eg, 2D LC) are becoming increasingly popular for solving complex analytical problems in areas such as proteomics or metabolomics and offer (very) high peak capacities in a limited timeframe. An interesting evolution in this field is the development of spatial three‐dimensional chromatography by the Eeltink group whereby components are separated in the space domain with each peak being characterized by its coordinates in a 3D separation body. 119
The introduction of novel sampling techniques, such as acoustic dispensing, and of ambient ionization methods for MS detection have proven to yield substantially higher sample throughput, but only a few configurations are commercially available. It also remains to be seen whether these setups can be applied in a reproducible and robust manner across a diverse set of applications. It is expected that, as DESI‐MS further matures and DESI setups become widely commercially available, we will see more applications of this technique in the HTA/HTE field. In recent years, several research groups have also demonstrated the benefits of microfluidic approaches and achieved very high throughput, but some concerns regarding robustness need to be further addressed.
Among the holy grails of HTA are specific, sensitive, and high‐speed optical sensors or chips that are easy to use and that are capable of generating data at an unprecedented speed. We envision that the efforts put into the development of such devices will significantly grow in the coming years.
It will be interesting to see how robotics, automation, and the application of Machine Learning and Artificial Intelligence will contribute to the further evolution of HTE and HTA in the near future. Some groups have already presented examples of automated collection of data, such as kinetic data, product distributions, and activation barriers for gas‐phase catalytic reactions. Recent examples are the ‘‘Catalysis‐in‐a‐Box’’ approach that uses a simple, low‐cost modification of a commercial GC instrument to automate the collection of catalyst screening data 120 and the use of freely moving autonomous robots that automate the lab worker rather than the instrumentation. 121
To conclude, we can say that the ongoing efforts in the field of HTA have certainly contributed to the success of HTE and the extent to which this methodology has been adopted by industry. Whilst some of the HTA tools and techniques have already become commercially available and several others will undoubtedly be commercialized in the near future, considerable work is still needed to improve their robustness and user‐friendliness. Further advancements in data analysis tools to facilitate the rapid interpretation of the vast amounts of data that are generated by HTA tools will also be indispensable.
Data sharing is not applicable to this article as no new data were created or analyzed in this study.
CONFLICT OF INTEREST
The authors have declared no conflict of interest.
Vervoort N, Goossens K, Baeten M, Chen Q . Recent advances in analytical techniques for high throughput experimentation. Anal Sci Adv. 2021;2:109–127. 10.1002/ansa.202000155
DATA AVAILABILITY STATEMENT
Data sharing is not applicable to this article as no new data were created or analyzed in this study.
REFERENCES
- 1. Berenguel Hernandez AM, de la Cruz M, Alcazar‐Fabra M, et al. Design of high‐throughput screening of natural extracts to identify molecules bypassing primary coenzyme Q deficiency in Saccharomyces cerevisiae . SLAS Discovery. 2020;25:299‐309. [DOI] [PubMed] [Google Scholar]
- 2. Izquierdo M, Lin D, O'Neill S, et al. Development of a high‐throughput screening assay to identify inhibitors of the major M17‐leucyl aminopeptidase from trypanosoma cruzi using rapidfire mass spectrometry. SLAS Discovery. 2020;25:1064‐1071. [DOI] [PubMed] [Google Scholar]
- 3. Leavell MD, Singh AH, Kaufmann‐Malaga BB. High‐throughput screening for improved microbial cell factories, perspective and promise. Curr Opin Biotechnol. 2020;62:22‐28. [DOI] [PubMed] [Google Scholar]
- 4. Logsdon DL, Li Y, Paschoal Sobreira TJ, Ferreira CR, Thompson DH, Cooks RG. High‐throughput screening of organic reactions in microdroplets using desorption electrospray ionization mass spectrometry (DESI‐MS): hardware and software implementation. Org Process Res Dev. 2020;24:1647‐1657. [DOI] [PubMed] [Google Scholar]
- 5. Osipyan A, Shaabani S, Warmerdam R, Shishkina SV, Boltz H, Doemling A. Automated, accelerated nanoscale synthesis of iminopyrrolidines. Angew Chem, Int Ed. 2020;59:12423‐12427. [DOI] [PMC free article] [PubMed] [Google Scholar]
- 6. Basuri P, Gonzalez LE, Morato NM, Pradeep T, Cooks RG. Accelerated microdroplet synthesis of benzimidazoles by nucleophilic addition to protonated carboxylic acids. Chem Sci. 2020. Ahead of Print. [DOI] [PMC free article] [PubMed] [Google Scholar]
- 7. Mennen SM, Alhambra C, Allen CL, et al. The evolution of high‐throughput experimentation in pharmaceutical development and perspectives on the future. Org Process Res Dev. 2019;23:1213‐1242. [Google Scholar]
- 8. Park H‐M, Winton VJ, Drader JJ, et al. Novel interface for high‐throughput analysis of biotherapeutics by electrospray mass spectrometry. Anal Chem. 2020;92:2186‐2193. [DOI] [PMC free article] [PubMed] [Google Scholar]
- 9. Li Y, Hu Y, Logsdon DL, Liu Y, Zhao Y, Cooks RG. Accelerated forced degradation of therapeutic peptides in levitated microdroplets. Pharm Res. 2020;37:138. [DOI] [PubMed] [Google Scholar]
- 10. Kresge GA, Grosse S, Zimmer A, et al. Strategies in developing high‐throughput liquid chromatography protocols for method qualification of pharmacopeial monographs. J Sep Sci. 2020;43:2964‐2970. [DOI] [PubMed] [Google Scholar]
- 11. Welch CJ. High throughput analysis enables high throughput experimentation in pharmaceutical process research. React Chem Eng. 2019;4:1895‐1911. [Google Scholar]
- 12. Schafer W, Bu X, Gong X, Joyce LA, Welch CJ. High‐throughput analysis for high‐throughput experimentation in organic chemistry. Comprehensive Organic Synthesis II. Elsevier; 2014:28‐53. [Google Scholar]
- 13. Boulgakov AA, Moor SR, Jo HH, et al. Next‐generation TLC: A quantitative platform for parallel spotting and imaging. J Org Chem. 2020;85:9447‐9453. [DOI] [PMC free article] [PubMed] [Google Scholar]
- 14. Pasch H, Heinz L‐C, Macko T, Hiller W. High‐temperature gradient HPLC and LC‐NMR for the analysis of complex polyolefins. Pure Appl Chem. 2008;80:1747‐1762. [Google Scholar]
- 15. Heinisch S, Rocca JL. Solvent selection in liquid chromatography. J Chromatogr A. 2009;1216:642‐658. [DOI] [PubMed] [Google Scholar]
- 16. Rashed NS, Zayed S, Abdelazeem A, Fouad F. Development and validation of a green HPLC method for the analysis of clorsulon, albendazole, triclabendazole and ivermectin using monolithic column: Assessment of the greenness of the proposed method. Microchem J. 2020;157:105069. [Google Scholar]
- 17. Dores‐Sousa JL, Terryn H, Eeltink S. Morphology optimization and assessment of the performance limits of high‐porosity nanostructured polymer monolithic capillary columns for proteomics analysis. Anal Chim Acta. 2020;1124:176‐183. [DOI] [PubMed] [Google Scholar]
- 18. Soliven A, Pareja L, Shalliker RA, Heinzen H. Perez‐Parada, A. A high‐throughput and high peak capacity narrow‐bore parallel segmented flow column strategy for the liquid chromatography‐tandem mass spectrometry analysis of organic contaminants in water. Anal Methods. 2020;12:239‐246. [Google Scholar]
- 19. Mazzeo JR, Neue UD, Kele M, Plumb RS. Advancing LC Performance with Smaller Particles and Higher Pressure. Anal Chem. 2005;77:460A‐467A. [Google Scholar]
- 20. Kaplitz AS, Kresge GA, Selover B, et al. High‐Throughput and Ultrafast Liquid Chromatography. Anal Chem. 2020;92:67‐84. [DOI] [PubMed] [Google Scholar]
- 21. Patel DC, Wahab MF, O'Haver TC, Armstrong DW. Separations at the Speed of Sensors. Anal Chem. 2018;90:3349‐3356. [DOI] [PubMed] [Google Scholar]
- 22. Guiochon G. Separation science is the key to successful biopharmaceuticals. J Chromatogr A. 2011;1228:2‐19. [DOI] [PubMed] [Google Scholar]
- 23. Zhou Z, Desmet G, Pra M, Steiner F, Eeltink S. Assessing effects of ultra‐high‐pressure liquid chromatography instrument configuration on dispersion, system pressure, and retention. J Chromatogr A. 2020;1634:461660. [DOI] [PubMed] [Google Scholar]
- 24. Broeckhoven K, Desmet G. Advances and Innovations in Liquid Chromatography Stationary Phase Supports. Anal Chem. 2020;92:554‐560. [DOI] [PubMed] [Google Scholar]
- 25. Sorensen MJ, Anderson BG, Kennedy RT. Liquid chromatography above 20,000 PSI. Trends Analyt Chem. 2020;124:115810. [DOI] [PMC free article] [PubMed] [Google Scholar]
- 26. Wahab MF, Wimalasinghe RM, Wang Y, Barhate CL, Patel DC, Armstrong DW. Salient Sub‐Second Separations. Anal Chem. 2016;88:8821‐8826. [DOI] [PubMed] [Google Scholar]
- 27. Cebo M, Fu X, Gawaz M, Chatterjee M, Lammerhofer M. Micro‐UHPLC‐MS/MS method for analysis of oxylipins in plasma and platelets. J Chromatogr A. 2020;1624:461206. [DOI] [PubMed] [Google Scholar]
- 28. Yoshikawa K, Furuno M, Tanaka N, Fukusaki E. Fast enantiomeric separation of amino acids using liquid chromatography/mass spectrometry on a chiral crown ether stationary phase. J Biosci Bioeng. 2020;130:437‐442. [DOI] [PubMed] [Google Scholar]
- 29. Gritti F, Martin M, Guichon G. Effect of the surface coverage of C 18 ‐bonded silica particles on the obstructive factor and intraparticle diffusion mechanism. Anal Chem. 2009;81:3365‐3384.19361228 [Google Scholar]
- 30. Lesko M, Samuelsson J, Aasberg D, Kaczmarski K, Fornstedt T. Impact of methanol adsorption on the robustness of analytical supercritical fluid chromatography in transfer from SFC to UHPSFC. J Chromatogr A. 2020;1625:461076. [DOI] [PMC free article] [PubMed] [Google Scholar]
- 31. https://www.advanced-materials-tech.com/explore-fused-core-technology/.
- 32. Geibel C, Dittrich K, Woiwode U, et al. Comparison of small size fully porous particles and superficially porous particles of chiral anion‐exchange type stationary phases in ultra‐high performance liquid chromatography: effect of particle and pore size on chromatographic efficiency and kinetic performance. J Chromatogr A. 2019;1603:130‐140. [DOI] [PubMed] [Google Scholar]
- 33. Pantsulaia S, Targamadze K, Khundadze N, et al. Potential and current limitations of superficially porous silica as a carrier for polysaccharide‐based chiral selectors in separation of enantiomers in high‐performance liquid chromatography. J Chromatogr A. 2020;1625:461297. [DOI] [PubMed] [Google Scholar]
- 34. Kresge GA, Wong J‐MT, De Pra M, Steiner F, Grinias JP. Using superficially porous particles and ultrahigh pressure liquid chromatography in pharmacopeial monograph modernization of common analgesics. Chromatographia. 2019;82:465‐475. [Google Scholar]
- 35. Godinho JM, Lawhorn J, Boyes BE. Rapid analysis of polycyclic aromatic hydrocarbons. J Chromatogr A. 2020;1628:461432. [DOI] [PubMed] [Google Scholar]
- 36. Hibi K, Ishii D, Fujishima I, Takeuchi T, Nakanishi T. Studies of open tubular micro capillary liquid chromatography. 1. The development of open tubular micro capillary liquid chromatography. J High Resolut Chromatogr. 1978;1:21‐27. [Google Scholar]
- 37. Causon T, Shellie R, Hilder E, Desmet G, Eeltink S. Temperature pulsing for controlling chromatographic resolution in capillary liquid chromatography. J Chromatogr A. 2011;1218:8388‐8393.21982992 [Google Scholar]
- 38. Hara T, Futagami S, Eeltink S, De Malsche W, Baron GV, Desmet G. Very high efficiency porous silica layer open‐tubular capillary columns produced via in‐column sol–gel processing. Anal Chem. 2016;88:10158‐10166. [DOI] [PubMed] [Google Scholar]
- 39. Hara T, Izumi Y, Nakao M, et al. Silica‐based hybrid porous layers to enhance the retention and efficiency of open tubular capillary columns with a 5 µm inner diame9ter. J Chromatogr A. 2018;1580:63‐71. [DOI] [PubMed] [Google Scholar]
- 40. Xiang P, Yang Y, Zhao Z, Chen M, Liu S. Experimentally validating open tubular liquid chromatography for a peak capacity of 2000 in 3 h. Anal Chem. 2019;91:10738‐10743. [DOI] [PubMed] [Google Scholar]
- 41. Regalado EL, Welch CJ. Pushing the speed limit in enantioselective supercritical fluid chromatography. J Sep Sci. 2015;38:2826‐2832. [DOI] [PubMed] [Google Scholar]
- 42. Chen J, Lou C. Applications of supercritical fluid chromatography technique in current bioanalysis and pharmaceutical analysis. Bioanalysis. 2020;12:1347‐1351. [DOI] [PubMed] [Google Scholar]
- 43. Pandya PA, Shah PA, Shrivastav PS. Facile separation of four co‐formulated ternary antihypertensive drug combinations with a customized elution protocol using supercritical fluid chromatography. Microchem J. 2020;159:105594. [Google Scholar]
- 44. Novakova L, Sejkorova M, Smolkova K, Plachka K, Svec F. The benefits of ultra‐high‐performance supercritical fluid chromatography in determination of lipophilic vitamins in dietary supplements. Chromatographia. 2019;82:477‐487. [Google Scholar]
- 45. Barhate CL, Joyce LA, Makarov AA, et al. Ultrafast chiral separations for high throughput enantiopurity analysis. Chem Commun (Camb). 2017;53:509‐512. [DOI] [PubMed] [Google Scholar]
- 46. Wang B, Liu X‐H, Xue Z‐Y, Yang X‐Y, Fang Y‐Y, Feng S‐L. Comparative study of ultra‐high‐performance supercritical fluid chromatography and ultra‐high‐performance liquid chromatography to simultaneous determination of ten components in Radix hedysari. Pharmacogn Mag. 2020;16:99‐110. [Google Scholar]
- 47. Barhate CL, Wahab MF, Tognarelli DJ, Berger TA, Armstrong DW. Instrumental Idiosyncrasies Affecting the Performance of Ultrafast Chiral and Achiral Sub/Supercritical Fluid Chromatography. Anal Chem. 2016;88:8664‐8672. [DOI] [PubMed] [Google Scholar]
- 48. Broeckhoven K, Desmet G. Methods to determine the kinetic performance limit of contemporary chromatographic techniques. J Sep Sci. 2020. Ahead of Print. [DOI] [PubMed] [Google Scholar]
- 49. Berger TA. Packed column SFC. Chromatographia. 2019;82:537‐542. [Google Scholar]
- 50. Hellinghausen G, Readel ER, Wahab MF, et al. Evaluation of nicotine in tobacco‐free‐nicotine commercial products. Chromatographia. 2019;82:221‐233. [Google Scholar]
- 51. Roy D, Armstrong DW. Fast super/subcritical fluid chromatographic enantioseparations on superficially porous particles bonded with broad selectivity chiral selectors relative to fully porous particles. J Chromatogr A. 2019;1605:360339. [DOI] [PubMed] [Google Scholar]
- 52. Mazzoccanti G, Manetto S, Ricci A, et al. High–throughput enantioseparation of Nα–fluorenylmethoxycarbonyl proteinogenic amino acids through fast chiral chromatography on zwitterionic‐teicoplanin stationary phases. J Chromatogr A. 2020;1624:461235. [DOI] [PubMed] [Google Scholar]
- 53. Folprechtova D, Kozlov O, Armstrong DW, Schmid MG, Kalikova K, Tesarova E. Enantioselective potential of teicoplanin‐ and vancomycin‐based superficially porous particles‐packed columns for supercritical fluid chromatography. J Chromatogr A. 2020;1612:460687. [DOI] [PubMed] [Google Scholar]
- 54. Galietti MR, Peulon‐Agasse V, Cardinael P, Fogwill MO, Besner S, Gritti FG. Turbulent supercritical fluid chromatography in open‐tubular columns for high‐throughput separations. Anal Chem. 2020;92:7409‐7412. [DOI] [PubMed] [Google Scholar]
- 55. Welch CJ, Gong X, Schafer W, et al. MISER Chromatography (Multiple Injections in a Single Experimental Run): the Chromatogram is the Graph. Tetrahedron: Asymmetry. 2010;21:1674‐1681. [Google Scholar]
- 56. Zawatzky K, Barhate CL, Regalado EL, et al. Overcoming "speed limits" in high throughput chromatographic analysis. J Chromatogr A. 2017;1499:211‐216. [DOI] [PubMed] [Google Scholar]
- 57. Zawatzky K, Grosser S, Welch CJ. Facile kinetic profiling of chemical reactions using MISER chromatographic analysis. Tetrahedron. 2017;73:5048‐5053. [Google Scholar]
- 58. Equitz TR, Rodriguez‐Cruz SE. High‐throughput Analysis of Controlled Substances: combining Multiple Injections in a Single Experimental Run (MISER) and Liquid Chromatography – Mass Spectrometry (LC‐MS). Forensic Chem. 2017;5:8‐15. [Google Scholar]
- 59. Knorrscheidt A, Puellmann P, Schell E, Homann D, Freier E, Weissenborn MJ. Development of 96 Multiple Injection‐GC‐MS Technique and Its Application in Protein Engineering of Natural and Non‐Natural Enzymatic Reactions. ChemCatChem. 2020;12:4788‐4795. [Google Scholar]
- 60. Ocvirk G, Verpoorte E, Manz A, Grasserbauer M, Widmer H. High‐performance liquid‐chromatography partially integrated onto a silicon chip. Analytical Methods and Instrumentation. 1995;2:74‐82. [Google Scholar]
- 61. Waheed S, Cabot JM, Macdonald NP, et al. 3D printed microfluidic devices: enablers and barriers. Lab Chip. 2016;16:1993‐2013. [DOI] [PubMed] [Google Scholar]
- 62. Cocovi‐Solberg DJ, Rosende M, Michalec M, Miro M. 3D Printing: the Second Dawn of Lab‐On‐Valve Fluidic Platforms for Automatic (Bio)Chemical Assays. Anal Chem. 2019;91:1140‐1149. [DOI] [PubMed] [Google Scholar]
- 63. Heiland J, Lotter C, Stein V, Mauritz L, Belder D. On‐chip integration of organic synthesis and HPLC/MS analysis for monitoring stereoselective transformations at the micro‐scale. Anal Chem. 2017;89:3266‐3271.28240029 [Google Scholar]
- 64. Piendl SK, Raddatz C‐R, Hartner NT, et al. 2D in Seconds: coupling of Chip‐HPLC with Ion Mobility Spectrometry. Anal Chem. 2019;91:7613‐7620. [DOI] [PubMed] [Google Scholar]
- 65. Zheng R, Li L, Deng X, Tian M, Wang Z, Yang L. Fully automated chip‐based nanoelectrospray ionization‐mass spectrometry as an effective tool for rapid and high‐throughput screening of 5α‐reductase inhibitors. Anal Bioanal Chem. 2020;412:1685‐1692. [DOI] [PubMed] [Google Scholar]
- 66. Komendova M, Nawada S, Metelka R, Schoenmakers PJ, Urban J. Multichannel separation device with parallel electrochemical detection. J Chromatogr A. 2020;1610:460537. [DOI] [PubMed] [Google Scholar]
- 67. Fialkov AB, Lehotay SJ, Amirav A. Less than 1 minute low‐pressure gas chromatography ‐ mass spectrometry. J Chromatogr A. 2020;1612:460691. [DOI] [PubMed] [Google Scholar]
- 68. Beccaria M, Cabooter D. Current developments in LC‐MS for pharmaceutical analysis. Analyst (Cambridge, U K). 2020;145:1129‐1157. [DOI] [PubMed] [Google Scholar]
- 69. Musile G, Mazzola M, Shestakova K, Savchuk S, Appolonova S, Tagliaro F. A simple and robust method for broad range screening of hair samples for drugs of abuse using a high‐throughput UHPLC‐Ion Trap MS instrument. J Chromatogr B: Anal Technol Biomed Life Sci. 2020;1152:122263. [DOI] [PubMed] [Google Scholar]
- 70. Margaryan T, Sargsyan M, Gevorgyan A, et al. Protein precipitation method for determination of clobazam and N‐desmethylclobazam in human plasma by LC‐MS/MS. Biomed Chromatogr. 2020;34:e4844. [DOI] [PubMed] [Google Scholar]
- 71. Bian Y, Zheng R, Bayer FP, et al. Robust, reproducible and quantitative analysis of thousands of proteomes by micro‐flow LC‐MS/MS. Nat Commun. 2020;11:157. [DOI] [PMC free article] [PubMed] [Google Scholar]
- 72. Li W‐x, Zhang A‐h, Zhou X‐h, et al. High‐throughput liquid chromatography mass‐spectrometry‐driven lipidomics discover metabolic biomarkers and pathways as promising targets to reveal the therapeutic effects of the Shenqi pill. RSC Adv. 2020;10:2347‐2358. [DOI] [PMC free article] [PubMed] [Google Scholar]
- 73. Sobolevsky T, Ahrens B. High‐throughput liquid chromatography tandem mass spectrometry assay as initial testing procedure for analysis of total urinary fraction. Drug Test Anal. 2020. Ahead of Print. [DOI] [PubMed] [Google Scholar]
- 74. Kempa EE, Hollywood KA, Smith CA, Barran PE. High throughput screening of complex biological samples with mass spectrometry – from bulk measurements to single cell analysis. Analyst (Cambridge, U K). 2019;144:872‐891. [DOI] [PubMed] [Google Scholar]
- 75. Pu F, Elsen NL, Williams JD. Emerging chromatography‐free high‐throughput mass spectrometry technologies for generating hits and leads. ACS Med Chem Lett. 2020. Ahead of Print. [DOI] [PMC free article] [PubMed] [Google Scholar]
- 76. Haslam C, Hellicar J, Dunn A, et al. The Evolution of MALDI‐TOF mass spectrometry toward ultra‐high‐throughput screening: 1536‐well format and beyond. J Biomol Screen. 2016;21:176‐186. [DOI] [PubMed] [Google Scholar]
- 77. Truebenbach CS, Tong H, Huang N, Schnier PD, Siegel MM. High throughput flow injection analysis‐mass spectrometry for combinatorial chemistry using electrospray ionization, atmospheric pressure chemical ionization and exact‐mass Fourier transform mass spectrometry. Elsevier; 2004. [Google Scholar]
- 78. Sarvin B, Lagziel S, Sarvin N, et al. Fast and sensitive flow‐injection mass spectrometry metabolomics by analyzing sample‐specific ion distributions. Nat Commun. 2020;11:3186. [DOI] [PMC free article] [PubMed] [Google Scholar]
- 79. Anderson SE, Fahey NS, Park J, O'Kane PT, Mirkin CA, Mrksich M. A high‐throughput SAMDI‐mass spectrometry assay for isocitrate dehydrogenase. Analyst. 2020;145:3899‐3908. [DOI] [PMC free article] [PubMed] [Google Scholar]
- 80. Techner J‐M, Kightlinger W, Lin L, et al. High‐Throughput Synthesis and Analysis of Intact Glycoproteins Using SAMDI‐MS. Anal Chem. 2020;92:1963‐1971. [DOI] [PubMed] [Google Scholar]
- 81. Kuo T‐H, Dutkiewicz EP, Pei J, Hsu C‐C. Ambient Ionization Mass Spectrometry Today and Tomorrow: embracing Challenges and Opportunities. Anal Chem. 2020;92:2353‐2363. [DOI] [PubMed] [Google Scholar]
- 82. Sun J, Jiang Y, Liu H, Huang X, Xiong C, Nie Z. Ultrafast photocatalytic reaction screening by mass spectrometry. Anal Chem. 2020;92:6564‐6570. [DOI] [PubMed] [Google Scholar]
- 83. Lin S, Dikler S, Blincoe WD, et al. Mapping the dark space of chemical reactions with extended nanomole synthesis and MALDI‐TOF MS. Science. 2018;361:eaar6236. [DOI] [PubMed] [Google Scholar]
- 84. Park J‐M, Kim M‐J, Noh J‐Y, et al. Simultaneous Analysis of Multiple Cancer Biomarkers Using MALDI‐TOF Mass Spectrometry Based on a Parylene‐Matrix Chip. J Am Soc Mass Spectrom. 2020;31:917‐926. [DOI] [PubMed] [Google Scholar]
- 85. Blincoe WD, Lin S, Dreher SD, Sheng H. Practical guide on MALDI‐TOF MS method development for high throughput profiling of pharmaceutically relevant, small molecule chemical reactions. Tetrahedron. 2020;76:131434. [Google Scholar]
- 86. Simon RP, Winter M, Kleiner C, et al. MALDI‐TOF‐based affinity selection mass spectrometry for automated screening of protein‐ligand interactions at high throughput. SLAS Discovery. 2020;25:372‐383. [DOI] [PubMed] [Google Scholar]
- 87. Krenkel H, Hartmane E, Piras C, Brown J, Morris M, Cramer R. Advancing liquid atmospheric pressure matrix‐assisted laser desorption/ionization mass spectrometry toward ultrahigh‐throughput analysis. Anal Chem. 2020;92:2931‐2936. [DOI] [PMC free article] [PubMed] [Google Scholar]
- 88. Zhang X, Mell A, Li F, et al. Rapid fingerprinting of source and environmental microplastics using direct analysis in real time‐high resolution mass spectrometry. Anal Chim Acta. 2019. Ahead of Print. [DOI] [PubMed] [Google Scholar]
- 89. Zhou L, Wang X, Liu W, Xiang P, Chen H. Advances in COVID‐19: the virus, the pathogenesis, and evidence‐based control and therapeutic strategies. Anal Methods. 2020;12:1430‐1440. [DOI] [PMC free article] [PubMed] [Google Scholar]
- 90. Khaled A, Belinato JR, Pawliszyn J. Rapid and high‐throughput screening of multi‐residue pharmaceutical drugs in bovine tissue using solid phase microextraction and direct analysis in real time‐tandem mass spectrometry (SPME‐DART‐MS/MS). Talanta. 2020;217:121095. [DOI] [PubMed] [Google Scholar]
- 91. Han Y, Levkin P, Abarientos I, Liu H, Svec F, Fréchet JMJ. Monolithic superhydrophobic polymer layer with photopatterned virtual channel for the separation of peptides using two‐dimensional thin layer chromatography‐desorption electrospray ionization mass spectrometry. Anal Chem. 2010;82:2520‐2528. [DOI] [PMC free article] [PubMed] [Google Scholar]
- 92. Takats Z, Wiseman JM, Gologan B, Cooks RG. Mass spectrometry sampling under ambient conditions with desorption electrospray ionization. Science. 2004;306:471‐473. [DOI] [PubMed] [Google Scholar]
- 93. Wleklinski M, Loren BP, Ferreira CR, et al. High throughput reaction screening using desorption electrospray ionization mass spectrometry. Chem Sci. 2018;9:1647‐1653. [DOI] [PMC free article] [PubMed] [Google Scholar]
- 94. Girod M, Moyano E, Campbell DI, Cooks RG. Accelerated bimolecular reactions in microdroplets studied by desorption electrospray ionization mass spectrometry. Chemical Science. 2011;2:501‐510. [Google Scholar]
- 95. Loren BP, Ewan HS, Avramova L, et al. High Throughput Experimentation Using DESI‐MS to Guide Continuous‐Flow Synthesis. Sci Rep. 2019;9:1‐8. [DOI] [PMC free article] [PubMed] [Google Scholar]
- 96. Fedick PW, Iyer K, Wei Z, Avramova L, Capek GO, Cooks RG. Screening of the suzuki cross‐coupling reaction using desorption electrospray ionization in high‐throughput and in leidenfrost droplet experiments. J Am Soc Mass Spectrom. 2019;30:2144‐2151. [DOI] [PubMed] [Google Scholar]
- 97. Jaman Z, Logsdon DL, Szilagyi B, et al. High‐throughput experimentation and continuous flow validation of suzuki‐miyaura cross‐coupling reactions. ACS Comb Sci. 2020;22:184‐196. [DOI] [PMC free article] [PubMed] [Google Scholar]
- 98. Sobreira TJP, Avramova L, Szilagyi B, et al. High‐throughput screening of organic reactions in microdroplets using desorption electrospray ionization mass spectrometry (DESI‐MS): hardware and software implementation. Anal Methods. 2020;12:3654‐3669. [DOI] [PubMed] [Google Scholar]
- 99. Morato NM, Holden DT, Cooks RG. High‐Throughput Label‐Free Enzymatic Assays Using Desorption Electrospray‐Ionization Mass Spectrometry. Angew Chem, Int Ed. 2020;59:20459‐20464. [DOI] [PubMed] [Google Scholar]
- 100. Sinclair I, Davies G, Semple H. Acoustic mist ionization mass spectrometry (AMI‐MS) as a drug discovery platform. Expert Opin Drug Discovery. 2019;14:609‐617. [DOI] [PubMed] [Google Scholar]
- 101. Sinclair I, Bachman M, Addison D, et al. Acoustic mist ionization platform for direct and contactless ultrahigh‐throughput mass spectrometry analysis of liquid samples. Anal Chem. 2019;91:3790‐3794. [DOI] [PubMed] [Google Scholar]
- 102. DiRico KJ, Hua W, Liu C, Tucker JW, et al. Ultra‐high‐throughput acoustic droplet ejection‐open port interface‐mass spectrometry for parallel medicinal chemistry. ACS Med Chem Lett. 2020;11:1101‐1110. [DOI] [PMC free article] [PubMed] [Google Scholar]
- 103. Wagner A, Zhang J, Liu C, et al. Ultrahigh‐Throughput and Chromatography‐Free Bioanalysis of Polar Analytes with Acoustic Ejection Mass Spectrometry. Anal Chem. 2020;92:13525‐13531. [DOI] [PubMed] [Google Scholar]
- 104. Haebe TT, Liu C, Covey TR, et al. Ultrahigh‐throughput ESI‐MS: Sampling pushed to six samples per second by acoustic ejection mass spectrometry. Anal Chem. 2020;92:12242‐12249. [DOI] [PubMed] [Google Scholar]
- 105. Belov AM, Kozole J, Bean MF, et al. Acoustic mist ionization‐mass spectrometry: a comparison to conventional high‐throughput screening and compound profiling platforms. Anal Chem. 2020;92:13847‐13854. [DOI] [PubMed] [Google Scholar]
- 106. Liu C, Van Berkel GJ, Cox DM, Covey TR. Operational modes and speed considerations of an acoustic droplet dispenser for mass spectrometry. Anal Chem. 2020. Ahead of Print. [DOI] [PubMed] [Google Scholar]
- 107. Liu W‐w, Zhu Y. Development and application of analytical detection techniques for droplet‐based microfluidics ‐ A review. Anal Chim Acta. 2020;1113:66‐84. [DOI] [PubMed] [Google Scholar]
- 108. Payne EM, Holland‐Moritz DA, Sun S, Kennedy RT. High‐throughput screening by droplet microfluidics: perspective into key challenges and future prospects. Lab on a Chip. 2020;20:2247‐2262. [DOI] [PMC free article] [PubMed] [Google Scholar]
- 109. Sun S, Kennedy RT. Droplet Electrospray Ionization Mass Spectrometry for High Throughput Screening for Enzyme Inhibitors. Anal Chem. 2014;86:9309‐9314. [DOI] [PMC free article] [PubMed] [Google Scholar]
- 110. Steyer DJ, Kennedy RT. High‐throughput nanoelectrospray ionization‐mass spectrometry analysis of microfluidic droplet samples. Anal Chem. 2019;91:6645‐6651. [DOI] [PMC free article] [PubMed] [Google Scholar]
- 111. Holland‐Moritz DA, Wismer MK, Mann BF, et al. Mass activated droplet sorting (mads) enables high‐throughput screening of enzymatic reactions at nanoliter scale. Angew Chem, Int Ed. 2020;59:4470‐4477. [DOI] [PubMed] [Google Scholar]
- 112. Wells SS, Kennedy RT. High‐throughput liquid‐liquid extractions with nanoliter volumes. Anal Chem. 2020;92:3189‐3197. [DOI] [PMC free article] [PubMed] [Google Scholar]
- 113. Kempa EE, Smith CA, Li X, et al. Coupling droplet microfluidics with mass spectrometry for ultrahigh‐throughput analysis of complex mixtures up to and above 30 hz. Anal Chem. 2020;92:12605‐12612. [DOI] [PMC free article] [PubMed] [Google Scholar]
- 114. Han S‐W, Shin J‐S. Rapid and quantitative profiling of substrate specificity of ω‐transaminases for ketones. ChemCatChem. 2019;11:3287‐3295. [Google Scholar]
- 115. Thanzeel FY, Balaraman K, Wolf C. Streamlined asymmetric reaction development: a case study with isatins. Chemistry – A European Journal. 2019;25:11020‐11025. [DOI] [PubMed] [Google Scholar]
- 116. Herrera BT, Pilicer SL, Anslyn EV, Joyce LA, Wolf C. Optical analysis of reaction yield and enantiomeric excess: a new paradigm ready for prime time. J Am Chem Soc. 2018;140:10385‐10401. [DOI] [PubMed] [Google Scholar]
- 117. Herrera BT, Moor SR, McVeigh M, Roesner EK, Marini F, Anslyn EV. Rapid optical determination of enantiomeric excess, diastereomeric excess, and total concentration using dynamic‐covalent assemblies: a demonstration using 2‐aminocyclohexanol and chemometrics. J Am Chem Soc. 2019;141:11151‐11160. [DOI] [PMC free article] [PubMed] [Google Scholar]
- 118. Pilicer SL, Dragna JM, Garland A, Welch CJ, Anslyn EV, Wolf C. High‐throughput determination of enantiopurity by microplate circular dichroism. J Org Chem. 2020;85:10858‐10864. [DOI] [PubMed] [Google Scholar]
- 119. Wouters B, Davydova E, Wouters S, Vivo‐Truyols G, Schoenmakers PJ, Eeltink S. Towards ultra‐high peak capacities and peak‐production rates using spatial three‐dimensional liquid chromatography. Lab Chip. 2015;15:4415‐4422. [DOI] [PubMed] [Google Scholar]
- 120. Burger B, Maffettone PM, Gusev VV, et al. A mobile robotic chemist. Nature. 2020;583:237‐241. [DOI] [PubMed] [Google Scholar]
- 121. Cooper AI. Boxing clever: Robotic screening of catalysts using an adapted gas chromatograph. Matter. 2020;3:611‐612. [Google Scholar]
Associated Data
This section collects any data citations, data availability statements, or supplementary materials included in this article.
Data Availability Statement
Data sharing is not applicable to this article as no new data were created or analyzed in this study.