

Abstract
Bile salt hydrolases (BSHs) are enzymes that are essential for the enterohepatic metabolism of bile acids (BAs). BSHs catalyze the production of unconjugated BAs and regulate the homeostasis of BA pool. This study identified Lactobacillus as a crucial BSH‐encoding genus, and 16 main species were obtained using metagenomic data from publicly available human gut microbiome databases. Then, the 16 species of lactobacilli were classified into four typical categories by BSH phylotypes, including five species encoding BSH‐T0, six species encoding BSH‐T2, four species encoding BSH‐T3, and Ligilactobacillus salivarius encoding both BSH‐T0 and BSH‐T3. The lactobacilli with the highest in vitro deconjugation activities against seven conjugated BAs were the BSH‐T3‐encoding strains. Furthermore, in vivo studies in mice administered four representative lactobacilli strains encoding different BSH phylotypes showed that treatment with BSH‐T3‐encoding Limosilactobacillus reuteri altered the structure of the gut microbiome and metabolome and significantly increased the levels of unconjugated BAs and total BA excretion. Our findings facilitated the taxonomic identification of crucial BSH‐encoding lactobacilli in human gut microbiota and shed light on their contributions toward modulation of the enterohepatic circulation of BAs, which will contribute to future therapeutic applications of BSH‐encoding probiotics to improve human health.
Keywords: bile acid, bile salt hydrolase, gut microbiota, lactobacilli, phylotype
Based on our previous work, Lactobacillus was identified as a crucial genus encoding bile salt hydrolase (BSH). Sixteen species of lactobacilli were obtained and classified into four typical categories according to BSH phylotypes used in silico approaches. Then, an in vitro detection experiment showed that the deconjugation ability of the lactobacilli strains could be represented as follows: Lac (BSH‐T3) ≈ Ligilactobacillus. salivarius > Lac (BSH‐T2) > Lac (BSH‐T0). Furthermore, in vivo studies of four representative strains from four categories showed that administration of Limosilactobacillus reuteri altered the structure of the gut microbiome and metabolome in mice and modulated the enterohepatic circulation of bile acids (BAs), specifically increasing total BAs and some unconjugated BAs.

Highlights
Lactobacillus was identified as a crucial genus encoding bile salt hydrolase (BSH), and 16 main species of lactobacilli were classified into four categories according to BSH phylotypes.
BSH‐T3‐encoding strains had the highest in vitro deconjugation activities.
Treatment with BSH‐T3‐encoding Limosilactobacillus reuteri altered the enterohepatic bile acid profile in mice.
INTRODUCTION
Bile acids (BAs) are initially synthesized from cholesterol in the hepatocytes and then covalently attached to glycine or taurine and stored in the gallbladder. In response to dietary intake, conjugated BAs in the gallbladder are transferred to the gut to generate unconjugated BAs and secondary BAs via catalysis by a series of enzymes in the gut microbiota. Approximately 95% of all BAs (including primary and secondary BAs; conjugated and unconjugated BAs) are reabsorbed by the intestine to enter the liver through the portal vein, and the rest are excreted in feces [1]. Moreover, the metabolic characteristics enable the formation of a dynamic BA pool that facilitates enterohepatic circulation in the body [2]. These metabolic processes are under negative feedback control through activation of the nuclear receptor farnesoid X receptor in the ileum and liver [3].
Bile salt hydrolases (BSHs) in gut microbiota are responsible for cleaving the amide bonds in conjugated BAs and increasing the complexity of the BA pool [4]. The unconjugated BAs produced by BSHs could act as signaling molecules that not only regulate BA metabolism and transport but also facilitate various metabolic activities that are critical for balancing lipid and glucose metabolism [5, 6, 7, 8], insulin sensitivity [9, 10], and innate immunity [11, 12] in the body. Disruption of the hepatic BA pool homeostasis is likely to lead to the development of cholestasis [13] and several other liver diseases, including nonalcoholic fatty liver disease [14, 15], liver cancer [16], and cholangiocarcinoma [17, 18]. Impaired BA homeostasis can lead to gastrointestinal diseases, such as irritable bowel syndrome [19], inflammatory bowel disease [12], and colorectal cancer [20]. Earlier studies on BSHs in bacteria focused on the identification and purification of BSHs from different bacteria [21, 22], screening of strains showing BSH activity in vitro [23, 24], and discovery of novel BSHs [25]. Recently, due to technological advancements and the pursuit of precision therapeutics, research studies have begun to consider the segmentation of BSHs and the functional differences in host metabolism. Jia et al. [26] collected 5790 BSH homologs and classified these into seven clusters based on a sequence similarity network. In our previous study, BSH‐encoding strains were systematically identified and classified into eight phylotypes based on phylogenetic analyses, with different specific activities in vitro [27]. Parasar et al. [28] revealed through chemoproteomic analyses that the relative contributions of individual BSHs to fecal BA levels were varied in a murine model of inflammatory bowel disease.
Among BSH‐encoding bacteria, Lactobacillus has been reported to contribute to the majority of the total BSH activity in vivo [29]. Our previous work provided similar evidence that BSH‐T3, encoded only by Lactobacillus, had the highest specific activity. However, Lactobacillus also encodes BSHs that belong to other phylotypes, suggesting differences in activity [27]. A study on BSHs repertoire in lactobacilli across 170 different species also speculated that nonhomologous BSH genes would show differences with respect to activity in vivo [30]. Therefore, further studies on taxonomic classification and functional evaluation of BSH‐encoding lactobacilli are necessary. In addition, the genus Lactobacillus was reclassified into 25 genera based on a polyphasic approach, including the emended genus Lactobacillus [31].
Based on our previous findings that BSHs were distributed in 591 strains within 117 genera of the human microbiota [27], an in‐depth analysis of these BSH‐encoding bacteria was conducted to (1) reveal crucial BSH‐encoding genus in human gut microbiota; (2) classify the BSH‐encoding lactobacilli according to a phylogenetic‐based system and assess their deconjugation activity in vitro; and (3) investigate the effects of administration of representative lactobacilli strains on the structure of the gut microbiome, metabolome, and enterohepatic BA pools in mice.
RESULTS
Characteristics of bacteria encoding BSH
A phylogenetic tree of the eight BSH phylotypes (including 156 BSHs from 90 species) was constructed and the abundance in human gut microbiome based on previous results was determined (Supporting Information: Figure S1) [27]. The most abundant genera among the eight phylotypes included Enterococcus (18.32% of the total relative abundance of BSH‐T0), Eubacterium (18.53% of the total relative abundance of BSH‐T1), Streptococcus (43.96% of the total relative abundance of BSH‐T2), Lactobacillus (before the taxonomic reorganization of lactobacilli in 2020 [31]; 100% of the total relative abundance of BSH‐T3), Bifidobacterium (50.97% of the total relative abundance of BSH‐T4), Bacteroides (82.13% and 89.89% of the total relative abundance of BSH‐T5 and BSH‐T6, respectively), and Blautia (73.14% of the total relative abundance of BSH‐T7; Figure 1A, Supporting Information: Figure S1). A multivariate analysis was performed on the seven genera based on the following: abundance, diversity (Shannon index), deconjugation ability (the proportion of 100 μM conjugated bile salts hydrolyzed to unconjugated bile salt by BSHs after 48 h of reaction, detected by liquid chromatography triple quadrupole mass spectrometry), specific activity (the amount of BSHs that release 1 μmol glycine or taurine from 20 mM conjugated bile salts per minute in a ninhydrin assay), number of encoded BSH phylotypes, and number of related diseases (Figure 1B) [27]. The results showed that the BSH‐encoding lactobacilli strains had the highest average deconjugation (97.13%), specific activity (124 µM min−1 mg−1), Shannon index (1.4), and number of phylotypes (3 out of 7). The radar chart clearly showed that Lactobacillus was the most critical genus among the representative BSH‐encoding genera (Figure 1C, Supporting Information: Figure S2).
Figure 1.
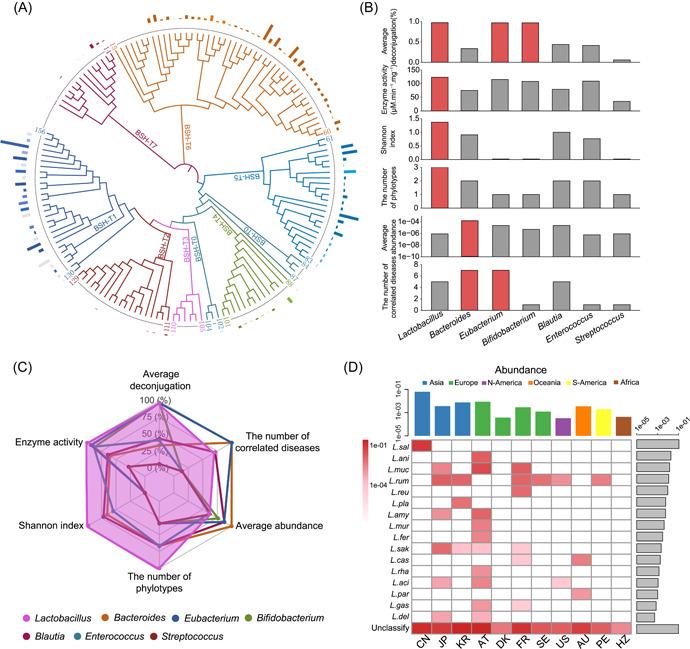
Comprehensive analysis of bile salt hydrolase (BSH)‐encoding bacteria. (A) Phylogenetic tree of 156 BSHs, accompanied by their relative abundance in the human microbiome. Columns with the same color represent BSHs from the same genus. In the same BSH phylotype, the lighter the color of the column, the lower the proportion of the total relative abundance of BSHs encoded by the genus. Genera with abundance of less than 5% are represented by gray columns. (B) Multiple factor analysis of representative BSH‐encoding genera. The diversity is represented by the Shannon index, the deconjugation ability is defined as the proportion of 100 μM conjugated bile salts hydrolyzed to unconjugated bile salt by BSHs after 48 h of reaction (detected by liquid chromatography triple quadrupole mass spectrometry), and the specific enzymatic activity is determined by the amount of BSHs that release 1 μmol glycine or taurine from 20 mM conjugated bile salts per minute in ninhydrin assay. The red columns represent the top genera during the analysis of the corresponding factor. (C) Radar analysis of representative BSH‐encoding genera; the data for each factor were normalized. (D) Relative abundance of BSH‐encoding lactobacilli strains in different populations.
Lactobacilli species encoding BSH in human gut microbiome
Genomic sequences of 581 strains from 166 species of lactobacilli were downloaded from the Ensembl database (Supporting Information: Table S1). Then, 25 human metagenome‐origin lactobacilli species were obtained based on the Human Metagenome Project (HMP) database (Supporting Information: Table S2). Further, 17 lactobacilli species were identified from gut microbiome data of 581 healthy individuals from 11 populations (Supporting Information: Table S3). Using 156 BSH sequences [27] and 6 representative BSH sequences in the KEGG database as a reference (Supporting Information: Table S4), a total of 16 BSH‐encoding lactobacilli species, including Ligilactobacillus salivarius, Ligilactobacillus animalis, Limosilactobacillus mucosae, Ligilactobacillus ruminis, Limosilactobacillus reuteri, Lactiplantibacillus plantarum, Lactobacillus amylovorus, Ligilactobacillus murinus, Limosilactobacillus fermentum, Latilactobacillus sakei, Lacticaseibacillus casei, Lacticaseibacillus rhamnosus, Lactobacillus acidophilus, Lacticaseibacillus paracasei, Lactobacillus gasseri, and Lactobacillus delbrueckii, were obtained from the gut microbiome of healthy individuals (Figure 1D, sorted in descending order of relative abundance). Of the species mentioned above, L. ruminis was present in the gut microbiota of most populations (6 out of 11, Supporting Information: Table S5). The most diverse lactobacilli species were observed in samples from Austria (AT; 10 out of 16, Supporting Information: Table S5).
Classification of lactobacilli species and comparison of deconjugation ability in vitro
The 16 representative BSH‐encoding strains of lactobacilli were classified according to the phylogenetic‐based system developed in previous studies [27]. These lactobacilli species mainly encoded three phylotypes of BSH: BSH‐T0, BSH‐T2, and BSH‐T3. L. fermentum, L. sakei, L. casei, L. rhamnosus, and L. paracasei encoded BSH‐T0. L. animalis, L. mucosae, L. ruminis, L. plantarum, L. murinus, and L. delbrueckii encoded BSH‐T2. L. reuteri, L. amylovorus, L. acidophilus, and L. gasseri encoded BSH‐T3. However, in particular, L. salivarius encoded both BSH‐T0 and BSH‐T3 (Figure 2A, Supporting Information: Table S6). Thus, the 16 strains of lactobacilli can be classified as Lac (BSH‐T0), Lac (BSH‐T2), Lac (BSH‐T3), and L. salivarius.
Figure 2.
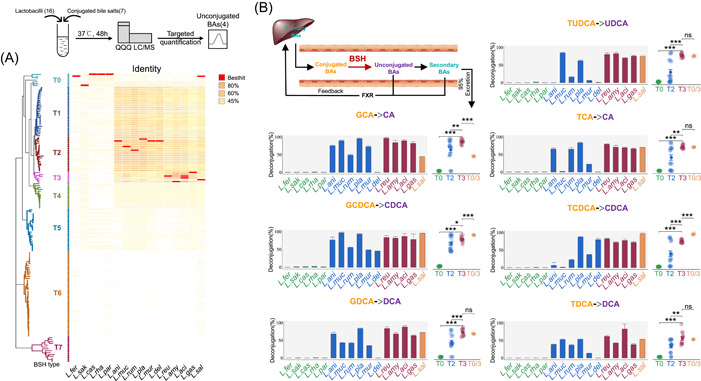
Deconjugation activity of bile salt hydrolase (BSH)‐encoding lactobacilli. (A) Taxonomic characteristics of representative BSH‐encoding lactobacilli strains. Details are shown in Supporting Information: Table S6. (B) In vitro deconjugation activity of representative BSH‐encoding lactobacilli strains. Details are shown in Supporting Information: Table S7. *p < 0.05, **p < 0.01, and ***p < 0.001. In this experiment, unconjugated BAs include CA, CDCA, DCA, and UDCA. DCA and UDCA belong to secondary BAs, which also could transfer from CA and CDCA. CA, Cholic acid; CDCA, Chenodeoxycholic acid; DCA, Deoxycholic acid; GCA, Sodium glycocholate hydrate; GCDCA, sodium glycochenodeoxycholate; GDCA, sodium glycodeoxycholate; TCA, sodium taurocholate hydrate; TCDCA, sodium taurochnodeoxycholate; TDCA, sodium taurodeoxycholate hydrate; TUDCA, sodium tauroursodeoxy cholate; UDCA, Ursodeoxycholic acid.
The deconjugation abilities of the lactobacilli strains were compared by determining the proportion of unconjugated BA product after incubation under anaerobic conditions with conjugated bile salts. Targeted quantitative detection of corresponding unconjugated BAs, including cholic acid (CA), chenodeoxycholic acid (CDCA), deoxycholic acid (DCA), and ursodeoxycholic acid (UDCA), was performed after 48 h hydrolysis (Supporting Information: Figure S3). Compared to other bile salts, the 16 lactobacilli strains generally showed weaker deconjugation ability during the hydrolysis of sodium taurodeoxycholate hydrate (TDCA). Deconjugation abilities of most strains against TDCA were less than 65%, except L. acidophilus ATCC 4796 (83.13%; Figure 2B, Supporting Information: Table S7). Apart from TDCA, approximately 80%–100% of the other conjugated bile salts could be converted into unconjugated BAs after incubation with Lac (BSH‐T3) strains, but less than 3% with Lac (BSH‐T0) strains. For the L. salivarius BNCC 138618 strain, which encoded both BSH‐T0 and BSH‐T3, only deconjugations of GCA, GCDCA, and TCDCA were significantly different from the Lac (BSH‐T3) strains (scatter plots of Figure 2B, Supporting Information: Table S7). In general, the deconjugation ability of the lactobacilli strains could be represented as follows: Lac (BSH‐T3) ≈ L. salivarius > Lac (BSH‐T2) > Lac (BSH‐T0) (scatter plots of Figure 2B).
Interestingly, strains classified as Lac (BSH‐T2) showed substrate preferences. For instance, L. delbrueckii subsp. bulgaricus ATCC 11842 could effectively hydrolyze sodium glycochenodeoxycholate (GCDCA; 45.64%) and sodium taurochnodeoxycholate (TCDCA; 79.85%), while the deconjugation abilities for other bile salts were less than 1% (bar plots in Figure 2B, Supporting Information: Table S7). L. mucosae DSM 13345 showed higher deconjugation ability for sodium glycocholate hydrate (GCA; 89.76%), GCDCA (97.34%), and sodium tauroursodeoxy cholate (TUDCA; 84.46%), but lower deconjugation ability for sodium taurocholate hydrate (TCA; 2.18%) and TCDCA (1.83%; bar plots in Figure 2B, Supporting Information: Table S7).
Administration of lactobacilli alters the gut microbiome of mice
In a bid to further explore the effect of lactobacilli in vivo, four lactobacilli strains including L. fermentum BNCC 194390 encoding BSH‐T0, L. animalis BNCC 134981 encoding BSH‐T2, L. reuteri ATCC 27755 encoding BSH‐T3, and L. salivarius BNCC 138618 encoding both BSH‐T0 and BSH‐T3 (species with the highest relative abundance in each lactobacilli category) were administered to male C57BL/6J mice for 2 weeks.
The 16S rDNA sequencing was performed using mouse fecal genomic DNA two weeks after administration. Compared with the control group, only the L. reuteri‐administered group showed a significantly higher level of alpha diversity (Wilcoxon rank‐sum test; p < 0.05, Figure 3A). Amplicon sequencing data also revealed distinct clusters of microbial structures in each group (PERMANOVA with Weighted Unifrac distance; R 2 = 0.2599, p = 0.001). Except for the L. animalis‐administered group, other lactobacilli‐administered groups were found to be significantly different from the control group (Figure 3B). Moreover, the ratio of Bacteroidetes to Firmicutes (B:F) was decreased in all the lactobacilli‐administered groups compared to the control group (B:F = 3.4), with the L. reuteri‐administered group showing the greatest decrease (B:F = 2.2, Supporting Information: Figure S4A).
Figure 3.
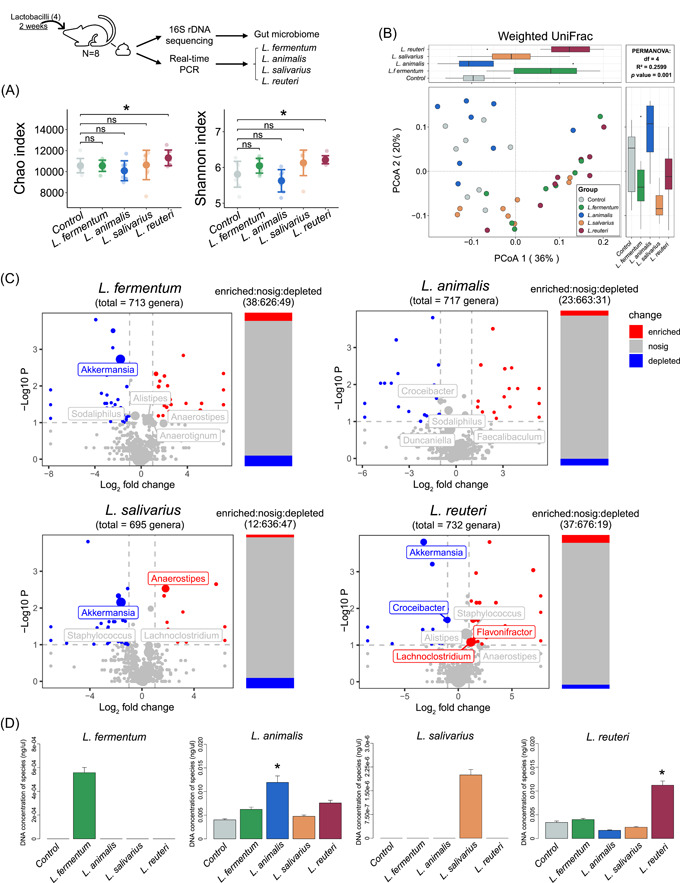
Treatment with lactobacilli alters the structure of the fecal microbiome in mice. (A) Alpha diversity (Chao richness and Shannon diversity index) of the fecal microbiome. (B) Two‐dimensional PCoA of the fecal microbiome based on WUniFrac. PERMANOVA was used for statistical significance of beta diversity; p < 0.05 was considered as statistically significant. (C) Volcano plots illustrate the genus enrichment analysis of the fecal microbiome. The Wilcoxon rank sum test was used for analysis. The labels represent the top 15 genera, and the sizes of labels and points were proportional to the average abundance of genera in each group. (D) Concentrations of four lactobacilli species (including Limosilactobacillus fermentum, Ligilactobacillus animalis, Ligilactobacillus salivarius, and Limosilactobacillus reuteri) in the fecal microbiota of mice in different groups. PCoA, principal coordinates analysis. *p < 0.05, **p < 0.01, and ***p < 0.001.
Through absolute quantitative analysis (described in the Materials and Methods section), the L. reuteri‐administered group was found to show the most highly enriched and the least depleted genera (|log2(fold change)| > 1, −log10(p value) > 1). Notably, among the top 15 genera, both Lachnoclostridium (average abundance = 0.0699; log2(fold change) = 1.17) and Flavonifractor (average abundance = 0.0180; log2(fold change) = 1.05) were found to be enriched in the L. reuteri‐administered group (Figure 3C). Also, a significant increase in the relative abundance of Alistipes and Staphylococcus was observed in the L. reuteri‐administered group (Supporting Information: Figure S4B). Furthermore, in comparison with the control group, a significant decrease in the abundance of Akkermansia was noted in all the lactobacilli‐administered groups, except for the L. animalis‐administered group. Thus, treatment with BSH‐encoding lactobacilli species, especially L. reuteri, altered the structure of the gut microbiome in mice.
The abundance of the Lactobacillus genus did not differ significantly among the groups in spite of lactobacilli administration (Supporting Information: Figure S4B). Therefore, specific primers of the four lactobacilli species were designed for targeted quantification in mice feces (Supporting Information: Figure S5, Table S8). Compared with the control group, the relative abundance of L. animalis and L. reuteri was significantly increased (Figure 3D). Since L. fermentum and L. salivarius are not indigenous to the gut microbiota of mice, no signal was observed in any of the groups, except for the group administered these two lactobacilli strains (Figure 3D). The above results showed that administration of the four lactobacilli strains significantly increased the concentrations of their respective species in mice.
Administration of lactobacilli alters serum and fecal metabolomes of mice
We then investigated the effects of the administration of lactobacilli on the metabolomes of mice. A total of 573 and 1630 features were detected in the serum and feces, respectively. Analysis of the total ion chromatograms obtained using serum samples showed that the L. reuteri‐administered group showed the highest number of differential features compared to the control group (Figure 4A, Supporting Information: Table S9). Principal component analysis of differential features in each group showed that the serum metabolites of mice in the L. fermentum and L. reuteri administration groups were substantially different from those in the control group (Figure 4B). Notably, lactobacilli treatment altered 50 metabolites (upregulated) in serum, while the administration of L. reuteri resulted in 49 metabolite changes (Figure 4C, Supporting Information: Table S10). The upregulated metabolites were mainly lipids and lipid‐like molecules, including 27−Norcholestanehexol (an intermediate of cholesterol metabolism), and some carnitine metabolites, such as L‐acetylcarnitine (Supporting Information: Table S10). In feces, again, the L. reuteri‐administered group still had the highest number of differential features and was the only group substantially different from the control group (Figure 4D,E, Supporting Information: Table S9). In addition, lactobacilli treatment altered 33 metabolites in feces (24 upregulated and 9 downregulated), while the L. reuteri‐administered group showed 22 significant metabolites (13 upregulated and 9 downregulated) (Figure 4F, Supporting Information: Table S10). The differential metabolites were mainly lipid molecules, organic acids, and derivatives. The downregulated metabolites included some steroid derivatives, such as 3‐oxo‐4, 6‐cholionic acid (Supporting Information: Table S10). These results suggest that L. reuteri administration had significant effects on the serum and fecal metabolomes of mice, especially in promoting lipid and cholesterol metabolism, which could have potentially played a role in preventing fat accumulation.
Figure 4.
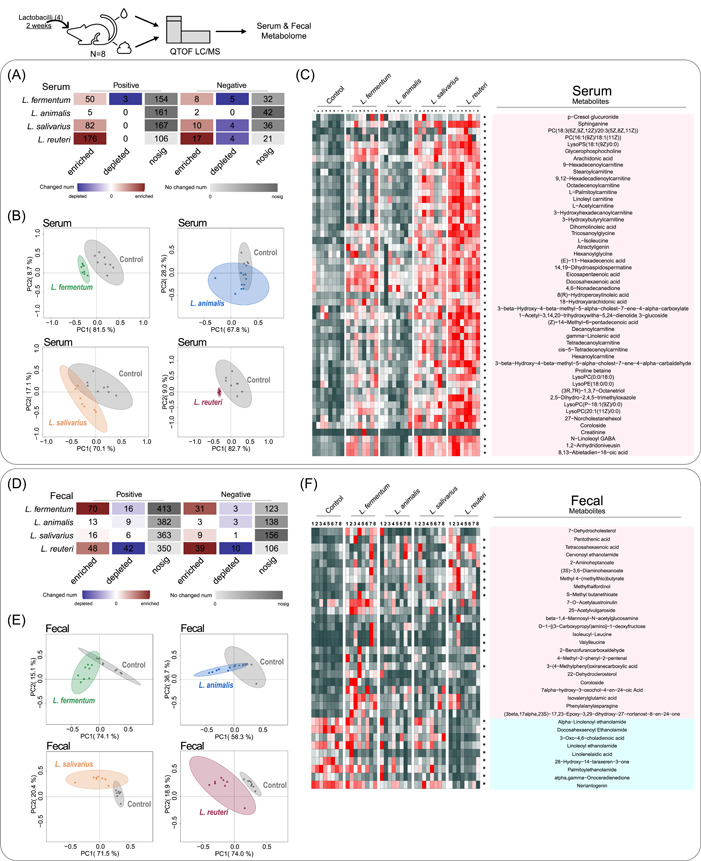
Treatment with lactobacilli alters the serum and fecal metabolomes of mice. (A) Heatmap of differential metabolic ion enrichment analysis in serum. The red color shows that the relative concentration of the feature was higher in the lactobacilli‐administered group, while the blue color shows that the relative concentration of the feature was higher in the control group; the gray color shows that the relative concentration of the feature did not differ between the two groups. (B) Score plots of principal component analysis based on the differential metabolites (VIP > 1, pFDR ≤ 0.05) in serum. (C) Heatmap of the differential metabolites (pFDR ≤ 0.05) in serum. (D) Heatmap of differential metabolic ion enrichment analysis in feces. (E) Score plots of principal component analysis based on the differential metabolites (VIP > 1, pFDR ≤ 0.05) in feces. (F) Heatmap of the differential metabolites (pFDR ≤ 0.05) in feces. Asterisks represent differential metabolites in the L. reuteri‐administered group. Positively charged ions are collected in ESI+ mode, and negatively charged ions are collected in ESI− mode.
Regulatory effect of lactobacilli species on enterohepatic BA pools in mice
To determine the effect of the lactobacilli species encoding different BSH phylotypes on enterohepatic BA profiles, the targeted quantification of BAs was performed in the liver, blood, ileum, and feces of mice (Supporting Information: Figures S6–S9, Table S11). The results showed that minor changes were observed in the hepatic BA pool, with only the L. fermentum‐administered group showing an increase in the concentration of β‐muricholic acid (β‐MCA) and CDCA (Figure 5A, Supporting Information: Figure S10A). Neither the total BA levels nor the unconjugated/conjugated BA ratio was found to be significantly different in the liver (Figure 5B,C). In serum, treatment with L. reuteri resulted in a significant increase in the concentrations of β‐MCA, CA, and DCA, indicating an upward trend in the total BA level and the percentage of unconjugated BA (Figure 5D–F). In the distal ileum and fecal excretion, both the BA profile and the total BA levels (Figure 5H,K) changed significantly after the administration of L. reuteri. Specifically, the concentrations of CA, DCA, and UDCA in the distal ileum and fecal excretion of β‐MCA, CDCA, DCA, and lithocholic acid (LCA) were all significantly increased in the L. reuteri‐administered group (Figure 5G,J). However, the unconjugated/conjugated BA ratio in the feces was increased (Figure 5L), but decreased in the distal ileum (Figure 5I) of the L. reuteri‐administered group, which might be attributed to the increased levels of conjugated BAs (Supporting Information: Figure S10). These results suggested that lactobacilli strains were pleiotropic regulators of enterohepatic BA metabolism. The significant increase of unconjugated BA levels and changes of the BA profile in L. reuteri‐administered mice further confirmed that the BSH‐T3‐encoding lactobacilli species is an important regulator of BA metabolism.
Figure 5.
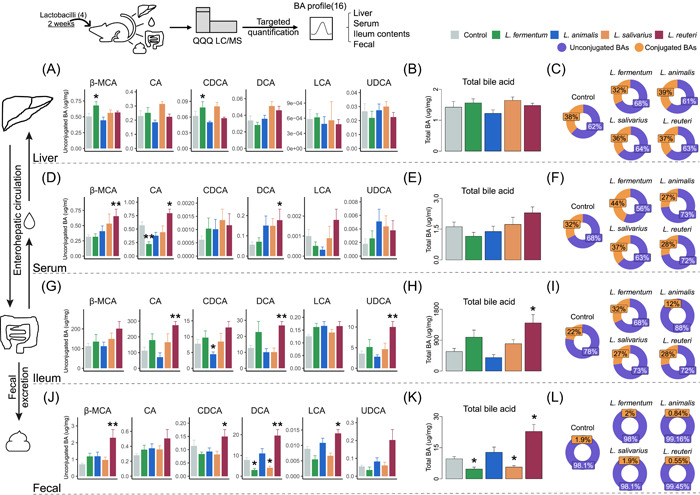
Treatment with lactobacilli alters the composition of the bile acid (BA) pool in mice. (A) Unconjugated BAs. (B) Total BA. (C) Proportion of unconjugated BAs and conjugated BAs in the liver of mice from different groups. (D) Unconjugated BAs. (E) Total BA. (F) Proportion of unconjugated BAs and conjugated BAs in the serum of mice from different groups. (G) Unconjugated BAs. (H) Total BA. (I) Proportion of unconjugated BAs and conjugated BAs in the distal ileum of mice from different groups. (J) Unconjugated BAs. (K) Total BA. (L) Proportion of unconjugated BAs and conjugated BAs in the fecal samples of mice from different groups. Statistically significant differences between the two groups were determined using a paired t test. *p < 0.05, **p < 0.01, and ***p < 0.001. Unconjugated BAs include CA, CDCA, DCA, and UDCA. Conjugated BAs include GCA, GCDCA, GDCA, TCA, TCDCA, TDCA, and TUDCA. Total BAs are the sum of all the detected BAs (including unconjugated BAs and conjugated BAs). CA, cholic acid; CDCA, chenodeoxycholic acid; DCA, deoxycholic acid; F, female; LCA, lithocholic acid; M, male; UDCA, ursodeoxycholic acid; β‐MCA, β‐Muricholic acid.
DISCUSSION
Since BSHs clearly play an important role in the regulation of host BA metabolism and physiological response, it is necessary to evaluate the distribution, abundance, and function of BSHs. A previous study used function‐driven metagenomics to identify BSHs in microbial communities for the first time and clustered them based on environmental origin, but the sample size was small [32]. Our previous work revealed the taxonomic and abundance profiling of BSHs based on large amount of human gut microbiome and assessed BSH activity by classifying the target sequence into specific phylotypes [27]. Based on previous work, this study, which comprehensively assessed BSH‐encoding gut bacteria through multivariate analysis and data mining of extensive metagenome data, discovered crucial BSH‐encoding lactobacilli species. Compared with other BSH‐encoding genera, lactobacilli was the most reported (Supporting Information: Figure S11, Table S12), including L. gasseri [22], L. reuteri [33], L. salivarius [34], and so on. A previous study reported about 39 BSH‐encoding lactobacilli species, but including some species that are not indigenous to the gut, such as L. agilis and L. vaginalis, which are typically found in the saliva and the vagina, respectively [30]. Using healthy human gut metagenomes, 16 BSH‐encoding lactobacilli species were systematically identified and classified according to the BSH phylotypes. As mentioned, the genus Lactobacillus was reclassified based on core genome phylogeny, pairwise average amino acid identity, clade‐specific signature genes, physiological criteria, and the ecology of the organisms [31]. The classification of lactobacilli based on BSH phylotype does not seem to be sufficiently relevant to the new taxonomy. Specifically, although three Lacticaseibacillus strains encoded BSH‐T0, Limosilactobacillus fermentum and L. reuteri encoded BSH‐T0 and BSH‐T3, respectively. Ligilactobacillus animalis, Ligilactobacillus ruminis, and Ligilactobacillus murinus belong to Lac (BSH‐T2), while L. salivarius does not encode BSH‐T2 (Figure 2A).
To examine the BSH activities of lactobacilli strains in vitro, Jimmy et al. [35] compared the deconjugation activities of five lactobacilli against four BAs and found that L. plantarum DGIA1 showed excellent deconjugation abilities. In contrast, our study systematically compared the deconjugation activities of 16 BSH‐phylotype classified lactobacilli strains against seven conjugated BAs and found that the lactobacilli strains that encoded BSH‐T3, including L. reuteri ATCC 27755, L. amylovorus BNCC 135321, L. acidophilus ATCC 4796, and L. gasseri BNCC 135057, had the highest deconjugation activities. However, it is noteworthy that some BSH‐T2‐encoding strains showed bile salt substrate preferences (Figure 2B, Supporting Information: Table S7). Similarly, Matthew et al. [36] also observed that BSHs encoded by Lactobacillus acidophilus NCK1909 and Lactobacillus gasseri NCK2253 showed substrate preferences, and might affect the growth of the strains. Then, they recently structurally identified a loop that predicts BSH preferences for either glycine or taurine substrates; specifically, taurine‐preferring enzymes exclusively contained Gly‐Val/Thr‐Gly motifs, while glycine‐preferring enzymes exclusively contained Ser‐Arg‐Gly/Ser motifs [37]. A review summarized the reported substrate‐specific BSHs and classified them according to substrate preference, and explored key residues and secondary structural elements that were potentially involved in determining substrate preferences [29]. Another study found that Lactobacillus salivarius showed a preference for substrates with a taurine head mainly because of the dehydroxylated sterol ring for hydrolysis and suggested the importance of Asp19, Asn79, Asn171, Arg224, Gln257, Asn262, and Glu270 for binding of the substrate amino acid head [38]. However, the substrate preference of BSH‐T2‐encoding lactobacilli in this study is more complex, which could not be completely divided into glycine‐preferring and taurine‐preferring lactobacilli. We speculate that these properties may be related to the structures of different BSH‐T2, and further in‐depth studies with structural analysis of BSH‐T2 with specific substrates along with comprehensive amino acid substitution mutagenesis are needed to understand the basis for the substrate preferences.
Compared with humans, the gut bacteria of mice can produce more diverse secondary BAs [39]. Moreover, glycine amidation is predominant in humans, while taurine amidation is predominant in mice [40], which corresponds to the low concentration of enterohepatic glycine‐BAs in our results (Figure 5, Supporting Information: Figure S10). Although the composition of gut microbiota and BAs varies greatly between the model animals and humans, in vivo research in mice remains indispensable in this field (Supporting Information: Figure S12, Table S13). However, most of the studies focused on demonstrating the regulation of a single lactobacilli strain on BA metabolism [41, 42]. For example, L. plantarum CCFM8661 has been reported to considerably increase hepatic BA synthesis, bile and biliary glutathione output, and fecal BA excretion in mice [43]. L. rhamnosus GG supplementation inhibits BA de novo synthesis, decreases hepatic BA, and increases BA excretion [42]. Our study examined the impact of four lactobacilli strains that encoded different BSH phylotypes on the enterohepatic BA profile in mice and found that administration of BSH‐T3‐encoding L. reuteri ATCC 27755 significantly changed the structure of gut microbiomes and metabolomes in mice, showing excellent ability to change the enterohepatic BA profile and increase BA excretion. In addition, several studies have shown that high fat intake may trigger chronic disease by altering the BA profile [44]. Analysis of the metabolome in mice revealed that administration of BSH‐encoding lactobacilli altered a number of metabolites associated with lipid and sterol metabolism (Figure 4), suggesting a possible beneficial effect in metabolic diseases associated with a high‐fat diet.
BSHs paralogs were reported in our previous study [27]; L. fermentum MTCC 8711 was reported to encode two bsh genes [45] and L. plantarum WCFS1 was reported to encode four bsh genes [46]. Some lactobacilli strains in this study also encoded more than one bsh gene, including L. acidophilus ATCC 4796, which encoded two genes belonging to BSH‐T3, L. amylovorus BNCC 135321, which encoded three genes belonging to BSH‐T3, L. paracasei BNCC 189800, which encoded two genes belonging to BSH‐T0, and L. salivarius BNCC 138618, which encoded genes belonging to BSH‐T0 and BSH‐T3, respectively (Supporting Information: Table S6). To the best of our knowledge, few studies have investigated the effect of bacteria with BSH paralogs on the BAs' metabolic function. Interestingly, our findings showed that though L. salivarius BNCC 138618 had a comparable deconjugation ability to Lac (BSH‐T3) strains in vitro, the treatment had no significant effect on enterohepatic BA pools in an in vivo study; thus, further mechanistic studies are needed.
The following are the main drawbacks of this study: (1) the significance of the lactobacilli genus and selected species might be biased by the public human gut metagenomic data used and (2) the mechanism(s) by which the lactobacilli strains regulate BA metabolism should be explored further using appropriate in vitro and in vivo models. Collection of metagenomic data will be continued to obtain superior data sets for further genomic analysis, and attempts will be made to construct bsh‐knockout lactobacilli and animal models of BA disorders to explore the clinical application possibilities of lactobacilli in disease therapeutics.
CONCLUSION
A phylogenetic‐based system to classify 156 BSHs into eight phylotypes was provided previously. In this study, we identified lactobacilli as the most important BSH‐encoding genus and evaluated the deconjugation abilities of 16 lactobacilli species on BAs in vitro and in vivo. BSH‐T3‐encoding lactobacilli were found to play an important role in modulating the enterohepatic BA profile. This study, combined with our previous work, showed the importance of BSHs' classification. While the exact mechanisms by which bacteria regulate BAs' metabolism in disease progression and clinical trials of lactobacilli as adjuvant therapy remain to be further explored, the discovery of BSH‐coding bacteria might still aid in identifying strains with therapeutic potential in related diseases.
MATERIALS AND METHODS
Sequence data collection
Lactobacilli genome sequences were downloaded from the Ensembl database (https://asia.ensembl.org/). Reference genomes were obtained from the HMP database (https://www.hmpdacc.org/) to predict and classify the genes and proteins in the lactobacilli genomes [27, 47]. The individual metagenomic sequence data refer to a data set constructed in previous studies that included the data of 581 healthy individuals [27] from 11 populations in six continents, including the Hadza ethnic group of Tanzania (HZ) [48] of Africa, China (CN) [49, 50], Japan (JP) [51], and South Korea (KR) [52] of Asia, Austria (AT) [53], Denmark (DK) [54], France (FR) [55], and Sweden (SE) [56] of Europe, Australia (AU, PRJEB6092) [57] of Oceania, the United States (US) [58] of North America (N‐America), and Peru (PE) [59]of South America (S‐America). Pairwise amino acid sequence alignments were performed using BLASTP (v 2.2.29+) [60].
Phylogenetic tree
BSH protein sequences were aligned using ClustalW, and phylogenetic trees were built using the maximum likelihood method (Jones–Taylor–Thornton model) in MEGA software (v7.0). Interactive Tree Of Life (iTOL) (https://itoL.embL.de/) was used to import the data on the abundance of 156 BSH sequences into the phylogenetic tree and fill in the colors as needed. A dendroscope (v3.4.7) was used to embellish the phylogenetic tree by adjusting of labels and filling of colors.
Materials and bacterial strains
Sodium glycocholate hydrate (CAS: 863‐57‐0), sodium glycochenodeoxycholate (CAS: 16564‐43‐5), sodium glycodeoxycholate (CAS: 16409‐34‐0), sodium taurocholate hydrate (CAS: 345909‐26‐4), sodium taurochnodeoxycholate (CAS: 6009‐98‐9), sodium taurodeoxycholate hydrate (CAS: 207737‐97‐1), and sodium tauroursodeoxy cholate (CAS: 35807‐85‐3) were purchased (Yuanye Bio‐Technology Co, Ltd) to perform the targeted quantification of deconjugated lactobacilli species in vitro. Standards of GCA, GCDCA, GDCA, GLCA, GUDCA, TCA, TCDCA, TDCA, TLCA, TUDCA, CA, CDCA, DCA, LCA, UDCA, and β‐MCA and their corresponding isotopic standards were purchased (ZZBIO Co, Ltd) for quantitative assays. 16 lactobacilli strains were used in BA deconjugation assays (Supporting Information: Table S6).
Conjugated bile salt deconjugation using lactobacilli strains
Lactobacilli strains were diluted to pre‐log phase (OD600nm = 0.1, 107 CFU) levels in a freshly prepared MRS medium. Stock solutions of conjugated bile salts were added to each culture to obtain a final concentration of 4 μM for each bile salt. In line with previous work [23], we monitored the growth of 16 lactobacilli strains and confirmed that all strains reached the stationary phase of growth after 48 h. Then, cultures were incubated in an anaerobic chamber at 37°C for 48 h.
Animal study
Eight‐week‐old C57BL/6J male mice (20–22 g) were obtained from GemPharmatech Co, Ltd. Mice were allowed to acclimatize to the environment and provided free access to food and water for at least 1 week before the experiment, and then randomly distributed into different groups and fed a standard chow diet (Jiangsu Xietong Medical Bioengineering Co, Ltd). Lactobacilli cultures were collected after an incubation period of 48 h, washed, and diluted with sterile phosphate‐buffered saline (PBS) to 5 × 10⁹ colony‐forming units/mL for gavage administration (200 μL per mice/day). There were initially 10 mice in each group. Given the considerable variations in the metabolism of individual mice, the mice with the highest and lowest total BA concentrations in each group were excluded, and these samples were also excluded from the analysis of the gut microbiome and metabolome. The group sizes were selected according to minimal experimental requirements.
16S rDNA amplicon sequencing and data analysis
Stool samples were collected from each mouse after 2 weeks of daily lactobacilli administration. Genomic DNA was extracted using a DNA kit (TIANGEN Biotech Co, Ltd). DNA (1%) from an exogenous strain (Sporosarcina pasteurii ATCC 11859) was added to perform the absolute quantification of bacterial changes. Then, a mixture of DNA (30 to 40 ng) was used to generate amplicons. The V3 and V4 hypervariable regions (F: 5′‐ACTCCTACGGGAGGCAGCA‐3′; R: 5′‐GGACTACHVGGGTWTCTAAT‐3′) of prokaryotic 16S rDNA were selected for the generation of amplicons and subsequent taxonomic analysis. DNA libraries were multiplexed and loaded onto an Illumina NovaSeq instrument according to the manufacturer's instructions (Illumina).
Sequencing was performed using a paired‐end configuration, external standard strains were identified, and absolute abundance levels were calculated. Sequence data analyses were mainly performed using the QIIME 2. Statistical analysis was performed using R software (v3.3.2). To compare the richness and evenness of the genera among samples, the alpha diversity values between different groups were visualized using the Chao [61] and Shannon index [62]. Beta diversity was measured based on weighted UniFrac (WUniFrac) distance matrices using principal coordinates analysis in the vegan package. Enrichment analysis of genera was conducted based on the absolute abundance of total genera. Enriched genera were screened using the following criterion: log2(fold change) > 1 and −log10(p value) > 1. Similarly, the depleted genera were screened using the following criterion: log2(fold change) < −1 and −log10(p value) > 1.
Quantification of lactobacilli species in mice
The AceQ qPCR SYBR Green Master Mix (Vazyme Biotech Co, Ltd) was used to determine the amounts of lactobacilli species by real‐time PCR. The set of primers used for the amplification of bacteria is shown in Supporting Information: Table S8. Standard curves were constructed using the diluted DNA of corresponding lactobacilli strains.
Measurement of BAs
An Agilent 1290 Infinity liquid chromatograph (LC) system coupled to an Agilent 6470 triple quadrupole (QQQ) mass spectrometer (MS) was used to quantify BAs in bacterial culture and the serum, liver, ileum content, and feces of mice. These included GCA, GCDCA, GDCA, GLCA, GUDCA, TCA, TCDCA, TDCA, TLCA, TUDCA, CA, CDCA, DCA, LCA, UDCA, and β‐MCA (only in mice). CA‐d4, GCDCA‐d4, GDCA‐d4, GLCA‐d4, GUDCA‐d4, TCA‐d4, TCDCA‐d4, TDCA‐d4, TLCA‐d4, TUDCA‐d4, CA‐d4, CDCA‐d4, DCA‐d4, LCA‐d4, UDCA‐d4, and β‐MCA‐d5 were used as internal standards. The detection of BAs was performed in the negative ion mode by multiple reaction monitoring modes. Agilent MassHunter software (version B.08.00) was used for instrumental control and data acquisition. It should be noted that quantification of GLCA was not performed in mouse serum and liver because its concentrations were below the detection limits. The methods for sample preparation and detailed chromatographic conditions are described in the Supporting Information.
Metabolomics
Untargeted analyses were performed using an Agilent 1290 Infinity LC system coupled to an Agilent 6545 quadrupole time‐of‐flight (Q‐TOF) MS equipped with an electrospray ionization source operating in both positive and negative ion modes. The serum and feces used for untargeted metabolomics analysis were processed in a manner similar to that for the targeted analysis, except that the isotope standard working solutions were replaced with 0.1 μg/mL L‐2‐chlorophenylalanine and 1 μg/mL ketoprofen and pooled. QC samples were obtained from the pooled aliquots of each serum and fecal homogenate liquid sample and pretreated using the same procedure. Agilent MassHunter software (version B.08.00) was used for instrumental control and data acquisition, and the XCMS package of the R program was run for data pretreatment, including peak detection discrimination, baseline correction, and nonlinear retention time alignment. Identification of differential metabolite signatures was performed based on the accurate mass and MS/MS fragments by searching through the Human Metabolome Database. Some of them were unambiguously confirmed with available reference compounds. The detailed chromatographic conditions are described in the Supporting Information.
Statistical analysis
All values were expressed as mean ± SEM. Statistically significant differences were detected between the two groups using the Wilcoxon rank‐sum test, followed by false discovery rate correction. The correlation analysis was done with Spearman rank correlations. Multiple comparisons were performed by multivariable‐adjusted analysis using the linear regression model. All analyses were performed using R (v3.3.2), and p < 0.05 was considered to be statistically significant. The data were visualized by ImageGP [63]. Supervised orthogonal partial least‐squares discriminant analysis (OPLS‐DA) was applied to identify the differences in the metabolic phenotypes between groups. Those metabolic features with an adjusted p value (pFDR) < 0.05 and variable importance in the projection (VIP) value > 1.0 in the OPLS‐DA model were defined as differential metabolites.
AUTHOR CONTRIBUTIONS
Ping Li and Jing Li conceived and designed the study. Ziwei Song performed experiments and analyzed the data. Shuo Feng collected the metagenome data and performed the analyses. Xingchen Zhou analyzed the 16S rDNA sequencing data. Zhengxing Song analyzed the untargeted metabolomics data. Ping Li, Jing Li, and Ziwei Song interpreted the data and wrote the manuscript. All authors read and approved the final manuscript.
CONFLICT OF INTEREST STATEMENT
The authors declare no conflict of interest.
ETHICS STATEMENT
Experiments involving animals were conducted in accordance with the Guidelines for Animal Experimentation at China Pharmaceutical University (Nanjing, China), and the protocols were approved by the Animal Ethics Committee (No. 2021‐09‐023).
Supporting information
Supporting information.
Supporting information.
ACKNOWLEDGMENTS
The authors are grateful to all members of the State Key Laboratory of Natural Medicines at China Pharmaceutical University. The authors would like to thank Raphael N. Alolga for his help with the language editing of this manuscript. The high‐performance computing resources and services used in this work were provided by the High‐Performance Computing Center of China Pharmaceutical University. The LC‐QTOF‐MS and LC‐QQQ‐MS/MS used in this work were provided by the Cellular and Molecular Biology Center of China Pharmaceutical University. This work was strategically funded by the National Natural Science Foundation of China (Grant nos. 82130114 and 32170062).
Ziwei Song, Feng Shuo, Zhou Xingchen, Song Zhengxing, Li Jing, and Li Ping. 2023. “Taxonomic Identification of Bile Salt Hydrolase‐Encoding Lactobacilli: Modulation of the Enterohepatic Bile Acid Profile.” iMeta 2, e128. 10.1002/imt2.128
Ziwei Song and Shuo Feng contributed equally to this study.
Contributor Information
Jing Li, Email: lj_cpu@126.com.
Ping Li, Email: liping2004@126.com.
DATA AVAILABILITY STATEMENT
(For all public metagenomic data used in this manuscript, the web links or references are provided in the Materials and Methods Section. Other data generated in this manuscript are included in additional files. For all public metagenomics data used in this manuscript, web links or references are provided. All codes used are saved in GitHub https://github.com/chaunceyZZ/iMeta2023TaxonomicIdentificationofBileSaltHydrolase-EncodingLactobacilli.git). Supporting Information (figures, tables, graphical abstract, and methods) may be found in the online DOI or iMeta Science http://www.imeta.science/.
REFERENCES
- 1. Foley, Matthew H. , O'Flaherty Sarah, Barrangou Rodolphe, and Theriot Casey M.. 2019. “Bile Salt Hydrolases: Gatekeepers Of Bile Acid Metabolism and Host‐Microbiome Crosstalk In the Gastrointestinal Tract.” PLOS Pathogens 15: e1007581. 10.1371/journal.ppat.1007581 [DOI] [PMC free article] [PubMed] [Google Scholar]
- 2. Li, Tiangang , and Chiang John Y. L.. 2014. “Bile Acid Signaling In Metabolic Disease and Drug Therapy.” Pharmacological Reviews 66: 948–83. 10.1124/pr.113.008201 [DOI] [PMC free article] [PubMed] [Google Scholar]
- 3. Sayin, Sama I. , Wahlström Annika, Felin Jenny, Jäntti Sirkku, Marschall Hanns Ulrich, Bamberg Krister, Angelin Bo, et al. 2013. “Gut Microbiota Regulates Bile Acid Metabolism By Reducing the Levels Of Tauro‐Beta‐Muricholic Acid, A Naturally Occurring FXR Antagonist.” Cell Metabolism 17: 225–35. 10.1016/j.cmet.2013.01.003 [DOI] [PubMed] [Google Scholar]
- 4. Ridlon, Jason M. , Kang Dae‐Joong, and Hylemon Phillip B.. 2006. “Bile Salt Biotransformations By Human Intestinal Bacteria.” Journal of Lipid Research 47: 241–59. 10.1194/jlr.R500013-JLR200 [DOI] [PubMed] [Google Scholar]
- 5. Di Ciaula, Agostino , Garruti Gabriella, Baccetto Raquel Lunardi, Molina‐Molina Emilio, Bonfrate Leonilde, Wang David Q. H., and Portincasa Piero. 2017. “Bile Acid Physiology.” Annals of Hepatology 16(Suppl 1): S4–14. 10.5604/01.3001.0010.5493 [DOI] [PubMed] [Google Scholar]
- 6. Thomas, Charles , Gioiello Antimo, Noriega Lilia, Strehle Axelle, Oury Julien, Rizzo Giovanni, Antonio Macchiarulo , et al. 2009. “TGR5‐Mediated Bile Acid Sensing Controls Glucose Homeostasis.” Cell Metabolism 10: 167–177. 10.1016/j.cmet.2009.08.001 [DOI] [PMC free article] [PubMed] [Google Scholar]
- 7. Shapiro, Hagit , Kolodziejczyk Aleksandra A., Halstuch Daniel, and Elinav Eran. 2018. “Bile Acids In Glucose Metabolism In Health and Disease.” Journal of Experimental Medicine 215: 383–396. 10.1084/jem.20171965 [DOI] [PMC free article] [PubMed] [Google Scholar]
- 8. Färkkilä, Martti , and Miettinen Tatu A.. 1990. “Lipid Metabolism In Bile Acid Malabsorption.” Annals of Medicine 22: 5–13. 10.3109/07853899009147233 [DOI] [PubMed] [Google Scholar]
- 9. Ahlin, S. , Cefalo C., Bondia‐Pons I., Capristo E., Marini L., Gastaldelli A., Mingrone G., and Nolan J. J.. 2019. “Bile Acid Changes After Metabolic Surgery Are Linked To Improvement In Insulin Sensitivity.” British Journal of Surgery 106: 1178–1186. 10.1002/bjs.11208 [DOI] [PMC free article] [PubMed] [Google Scholar]
- 10. Yang, Qin , Vijayakumar Archana, and Kahn Barbara B.. 2018. “Metabolites As Regulators Of Insulin Sensitivity and Metabolism.” Nature Reviews Molecular Cell Biology 19: 654–72. 10.1038/s41580-018-0044-8 [DOI] [PMC free article] [PubMed] [Google Scholar]
- 11. Wang, Daoming , Doestzada Marwah, Chen Lianmin, Andreu‐Sánchez Sergio, van den Munckhof Inge C. L., Augustijn Hannah E., Koehorst Martijn, et al. 2021. “Characterization Of Gut Microbial Structural Variations As Determinants Of Human Bile Acid Metabolism.” Cell Host & Microbe 29: 1802–14.e5. 10.1016/j.chom.2021.11.003 [DOI] [PubMed] [Google Scholar]
- 12. Fiorucci, Stefano , Carino Adriana, Baldoni Monia, Santucci Luca, Costanzi Emanuele, Graziosi Luigina, Distrutti Eleonora, and Biagioli Michele. 2021. “Bile Acid Signaling In Inflammatory Bowel Diseases.” Digestive Diseases and Sciences 66: 674–693. 10.1007/s10620-020-06715-3 [DOI] [PMC free article] [PubMed] [Google Scholar]
- 13. Pablo Arab, Juan , Cabrera Daniel, and Arrese Marco. 2017. “Bile Acids In Cholestasis and Its Treatment.” Annals of Hepatology 16: S53–S57. 10.5604/01.3001.0010.5497 [DOI] [PubMed] [Google Scholar]
- 14. Matsui, Masahiro , Fukunishi Shinya, Nakano Takashi, Ueno Takaaki, Higuchi Kazuhide, and Asai Akira. 2021. “Ileal Bile Acid Transporter Inhibitor Improves Hepatic Steatosis By Ameliorating Gut Microbiota Dysbiosis In NAFLD Model Mice.” mBio 12: e0115521. 10.1128/mBio.01155-21 [DOI] [PMC free article] [PubMed] [Google Scholar]
- 15. Jiao, Na , Baker Susan S., Chapa‐Rodriguez Adrian, Liu Wensheng, Nugent Colleen A., Tsompana Maria, Mastrandrea Lucy, et al. 2018. “Suppressed Hepatic Bile Acid Signalling Despite Elevated Production Of Primary and Secondary Bile Acids In NAFLD.” Gut 67: 1881–1891. 10.1136/gutjnl-2017-314307 [DOI] [PubMed] [Google Scholar]
- 16. Ji, Guofeng , Si Xinghui, Dong Si, Xu Yajun, Li Mingqiang, Yang Bo, Tang Zhaohui, et al. 2021. “Manipulating Liver Bile Acid Signaling By Nanodelivery Of Bile Acid Receptor Modulators for Liver Cancer Immunotherapy.” Nano Letters 21: 6781–6791. 10.1021/acs.nanolett.1c01360 [DOI] [PubMed] [Google Scholar]
- 17. Jia, Wei , Xie Guoxiang, Jia Weiping. 2018. “Bile Acid‐Microbiota Crosstalk In Gastrointestinal Inflammation and Carcinogenesis.” Nature Reviews Gastroenterology & Hepatology 15: 111–128. 10.1038/nrgastro.2017.119 [DOI] [PMC free article] [PubMed] [Google Scholar]
- 18. Jia, Xiaodong , Lu Shanshan, Zeng Zhen, Liu Qingyan, Dong Zheng, Chen Yan, Zhu Zhenyu, et al. 2020. “Characterization Of Gut Microbiota, Bile Acid Metabolism, and Cytokines In Intrahepatic Cholangiocarcinoma.” Hepatology 71: 893–906. 10.1002/hep.30852 [DOI] [PubMed] [Google Scholar]
- 19. Zhan, Kai , Zheng Huan, Li Jianqing, Wu Haomeng, Qin Shumin, Luo Lei, and Huang Shaogang. 2020. “Gut Microbiota‐Bile Acid Crosstalk In Diarrhea‐Irritable Bowel Syndrome.” BioMed Research International 2020: 3828249. 10.1155/2020/3828249 [DOI] [PMC free article] [PubMed] [Google Scholar]
- 20. Ridlon, Jason M. , Wolf Patricia G., and Gaskins H Rex. 2016. “Taurocholic Acid Metabolism By Gut Microbes and Colon Cancer.” Gut Microbes 7: 201–15. 10.1080/19490976.2016.1150414 [DOI] [PMC free article] [PubMed] [Google Scholar]
- 21. Stellwag, E. J. , and Hylemon P. B.. 1976. “Purification and Characterization Of Bile Salt Hydrolase From Bacteroides fragilis Subsp. Fragilis .” Biochimica et Biophysica Acta (BBA) – Enzymology 452: 165–176. 10.1016/0005-2744(76)90068-1 [DOI] [PubMed] [Google Scholar]
- 22. Kusada, Hiroyuki , Morinaga Kana, and Tamaki Hideyuki. 2021. “Identification Of Bile Salt Hydrolase and Bile Salt Resistance In a Probiotic Bacterium Lactobacillus gasseri JCM1131(T).” Microorganisms 9: 1011. 10.3390/microorganisms9051011 [DOI] [PMC free article] [PubMed] [Google Scholar]
- 23. Yao, Lina , Seaton Sarah Craven, Ndousse Fetter Sula, Adhikari Arijit A., DiBenedetto Nicholas, Mina Amir I., Banks Alexander S., Bry Lynn, and Devlin A Sloan. 2018. “A Selective Gut Bacterial Bile Salt Hydrolase Alters Host Metabolism.” Elife 7: e37182. 10.7554/eLife.37182 [DOI] [PMC free article] [PubMed] [Google Scholar]
- 24. Jarocki, Piotr , Podleśny Marcin, Glibowski Paweł, and Targoński Zdzisław. 2014. “A New Insight Into the Physiological Role Of Bile Salt Hydrolase Among Intestinal Bacteria From the Genus Bifidobacterium .” PLoS One 9: e114379. 10.1371/journal.pone.0114379 [DOI] [PMC free article] [PubMed] [Google Scholar]
- 25. Déjean, Guillaume , Tudela Héloïse, Bruno Lisa, Kissi Déborah, Rawadi Georges, Claus Sandrine P., and Claus Sandrine P.. 2021. “Identifying a Novel Bile Salt Hydrolase From the Keystone Gut Bacterium Christensenella minuta .” Microorganisms 9: 1252. 10.3390/microorganisms9061252 [DOI] [PMC free article] [PubMed] [Google Scholar]
- 26. Jia, Baolei , Park Dongbin, Hahn Yoonsoo, and Jeon Che Ok. 2020. “Metagenomic Analysis Of the Human Microbiome Reveals the Association Between the Abundance Of Gut Bile Salt Hydrolases and Host Health.” Gut Microbes 11: 1300–1313. 10.1080/19490976.2020.1748261 [DOI] [PMC free article] [PubMed] [Google Scholar]
- 27. Song, Ziwei , Cai Yuanyuan, Lao Xingzhen, Wang Xue, Lin Xiaoxuan, Cui Yingyun, Kalavagunta Praveen Kumar, et al. 2019. “Taxonomic Profiling and Populational Patterns Of Bacterial Bile Salt Hydrolase (BSH) Genes Based On Worldwide Human Gut Microbiome.” Microbiome 7: 9. 10.1186/s40168-019-0628-3 [DOI] [PMC free article] [PubMed] [Google Scholar]
- 28. Parasar, Bibudha , Zhou Hao, Xiao Xieyue, Shi Qiaojuan, Brito Ilana L., and Chang Pamela V.. 2019. “Chemoproteomic Profiling Of Gut Microbiota‐Associated Bile Salt Hydrolase Activity.” ACS Central Science 5: 867–873. 10.1021/acscentsci.9b00147 [DOI] [PMC free article] [PubMed] [Google Scholar]
- 29. Dong, Zixing , and Lee Byong H.. 2018. “Bile Salt Hydrolases: Structure and Function, Substrate Preference, and Inhibitor Development.” Protein Science 27: 1742–54. 10.1002/pro.3484 [DOI] [PMC free article] [PubMed] [Google Scholar]
- 30. O'Flaherty, Sarah , Briner Crawley Alexandra, Theriot Casey M., and Barrangou Rodolphe. 2018. “The Lactobacillus Bile Salt Hydrolase Repertoire Reveals Niche‐Specific Adaptation.” mSphere 3: e00140‐18. 10.1128/mSphere.00140-18 [DOI] [PMC free article] [PubMed] [Google Scholar]
- 31. Zheng, Jinshui , Wittouck Stijn, Salvetti Elisa, Franz Charles M. A. P., Harris Hugh M. B., Mattarelli Paola, O'Toole Paul W., et al. 2020. “A Taxonomic Note On the Genus Lactobacillus: Description Of 23 Novel Genera, Emended Description Of the Genus Lactobacillus Beijerinck 1901, and Union Of Lactobacillaceae and Leuconostocaceae .” International Journal of Systematic and Evolutionary Microbiology 70: 2782–2858. 10.1099/ijsem.0.004107 [DOI] [PubMed] [Google Scholar]
- 32. Jones, Brian V. , Begley Máire, Hill Colin, Gahan Cormac G. M., and Marchesi Julian R.. 2008. “Functional and Comparative Metagenomic Analysis Of Bile Salt Hydrolase Activity In the Human Gut Microbiome.” Proceedings of the National Academy of Sciences of the United States of America 105: 13580–85. 10.1073/pnas.0804437105 [DOI] [PMC free article] [PubMed] [Google Scholar]
- 33. Ledesma, Ana Estela , Taranto María Pía, and Bustos Ana Yanina. 2021. “Characterization Of Substrate Specificity and Inhibitory Mechanism Of Bile Salt Hydrolase From Lactobacillus reuteri CRL 1098 Using Molecular Docking Analysis.” Biotechnology Letters 43: 1063–1073. 10.1007/s10529-021-03097-y [DOI] [PubMed] [Google Scholar]
- 34. Xu, Fuzhou , Hu Xiao‐Jian, Singh Warispreet, Geng Wenjing, Tikhonova Irina G., and Lin Jun. 2019. “The Complex Structure Of Bile Salt Hydrolase From Lactobacillus salivarius Reveals the Structural Basis Of Substrate Specificity.” Scientific Reports 9: 12438. 10.1038/s41598-019-48850-6 [DOI] [PMC free article] [PubMed] [Google Scholar]
- 35. Hernández‐Gómez, Jimmy G. , López‐Bonilla Argelia, Trejo‐Tapia Gabriela, Ávila‐Reyes Sandra V., Jiménez‐Aparicio Antonio R., and Hernández‐Sánchez Humberto. 2021. “In Vitro Bile Salt Hydrolase (BSH) Activity Screening Of Different Probiotic Microorganisms.” Foods 10: 674. 10.3390/foods10030674 [DOI] [PMC free article] [PubMed] [Google Scholar]
- 36. Foley, Matthew H. , O'Flaherty Sarah, Allen Garrison, Rivera Alissa J., Stewart Allison K., Barrangou Rodolphe, and Theriot Casey M.. 2021. “ Lactobacillus bile salt hydrolase substrate specificity governs bacterial fitness and host colonization.” Proceedings of the National Academy of Sciences of the United States of America 118: e2017709118. 10.1073/pnas.2017709118 [DOI] [PMC free article] [PubMed] [Google Scholar]
- 37. Foley, Matthew H. , Walker Morgan E., Stewart Allison K., O'Flaherty Sarah, Gentry Emily C., Patel Shakshi, Beaty Violet V., et al. 2023. “Bile Salt Hydrolases Shape the Bile Acid Landscape and Restrict Clostridioides difficile Growth In the Murine Gut.” Nature Microbiology 8: 611–628. 10.1038/s41564-023-01337-7 [DOI] [PMC free article] [PubMed] [Google Scholar]
- 38. Karlov, Dmitry S. , Long Sarah L., Zeng Ximin, Xu Fuzhou, Lal Kanhaya, Cao Liu, Hayoun Karim, et al. 2023. “Characterization Of the Mechanism Of Bile Salt Hydrolase Substrate Specificity By Experimental and Computational Analyses.” Structure 31: 629–38.e5. 10.1016/j.str.2023.02.014 [DOI] [PubMed] [Google Scholar]
- 39. Collins, Stephanie L. , Stine Jonathan G., Bisanz Jordan E., Okafor C Denise, and Patterson Andrew D.. 2023. “Bile Acids and the Gut Microbiota: Metabolic Interactions and Impacts On Disease.” Nature Reviews Microbiology 21: 236–247. 10.1038/s41579-022-00805-x [DOI] [PMC free article] [PubMed] [Google Scholar]
- 40. Thakare, Rhishikesh , Alamoudi Jawaher Abdullah, Gautam Nagsen, Rodrigues A David, and Alnouti Yazen. 2018. “Species Differences In Bile Acids I. Plasma and Urine Bile Acid Composition.” Journal of Applied Toxicology 38: 1323–1335. 10.1002/jat.3644 [DOI] [PubMed] [Google Scholar]
- 41. Yamasaki, Masao , Minesaki Mikako, Iwakiri Asuka, Miyamoto Yuko, Ogawa Kenjiro, Nishiyama Kazuo, Tsend‐Ayush Chuluunbat, et al. 2020. “ Lactobacillus plantarum 06CC2 reduces hepatic cholesterol levels and modulates bile acid deconjugation in Balb/c mice fed a high‐cholesterol diet.” Food Science & Nutrition 8: 6164–6173. 10.1002/fsn3.1909 [DOI] [PMC free article] [PubMed] [Google Scholar]
- 42. Zhu, Huanjing , Zhao Fang, Zhang Wenjun, Xia Wenxu, Chen Ying, Liu Yanrong, Fan Zhiwen, Zhang Yumeng, and Yang Yao. 2022. “Cholesterol‐Lowering Effect Of Bile Salt Hydrolase From a Lactobacillus johnsonii Strain Mediated By FXR Pathway Regulation.” Food & Function Journal 13: 725–736. 10.1039/d1fo03143k [DOI] [PubMed] [Google Scholar]
- 43. Zhai, Qixiao , Liu Yang, Wang Chen, Qu Dingwu, Zhao Jianxin, Zhang Hao, Tian Fengwei, and Chen Wei. 2019. “ Lactobacillus plantarum CCFM8661 modulates bile acid enterohepatic circulation and increases lead excretion in mice.” Food & Function Journal 10: 1455–1464. 10.1039/c8fo02554a [DOI] [PubMed] [Google Scholar]
- 44. Chen, Jiali , Xiao Yuhang, Li Dongmei, Zhang Shiqing, Wu Yingzi, Zhang Qing, and Bai Weibin. 2023. “New Insights Into the Mechanisms Of High‐Fat Diet Mediated Gut Microbiota In Chronic Diseases.” iMeta 2: e69. 10.1002/imt2.69 [DOI] [PMC free article] [PubMed] [Google Scholar]
- 45. Jayashree, Sathyanarayanan , Pooja Sharma, Pushpanathan Muthuirulan, Rajendhran Jeyaprakash, and Gunasekaran Paramasamy. 2014. “Identification and Characterization Of Bile Salt Hydrolase Genes From the Genome Of Lactobacillus fermentum MTCC 8711.” Biotechnology and Applied Biochemistry 174: 855–866. 10.1007/s12010-014-1118-5 [DOI] [PubMed] [Google Scholar]
- 46. Lambert, Jolanda M. , Bongers Roger S., de Vos Willem M., and Kleerebezem Michiel. 2008. “Functional Analysis Of Four Bile Salt Hydrolase and Penicillin Acylase Family Members In Lactobacillus plantarum WCFS1.” Applied and Environmental Microbiology 74: 4719–4726. 10.1128/AEM.00137-08 [DOI] [PMC free article] [PubMed] [Google Scholar]
- 47. Zhu, Wenhan , Lomsadze Alexandre, and Borodovsky Mark. 2010. “Ab Initio Gene Identification In Metagenomic Sequences.” Nucleic Acids Research 38: e132. 10.1093/nar/gkq275 [DOI] [PMC free article] [PubMed] [Google Scholar]
- 48. Rampelli, Simone , Schnorr Stephanie L., Consolandi Clarissa, Turroni Silvia, Severgnini Marco, Peano Clelia, Brigidi Patrizia, et al. 2015. “Metagenome Sequencing Of the Hadza Hunter‐Gatherer Gut Microbiota.” Current Biology 25: 1682–1693. 10.1016/j.cub.2015.04.055 [DOI] [PubMed] [Google Scholar]
- 49. Jie, Zhuye , Xia Huihua, Zhong Shi‐Long, Feng Qiang, Li Shenghui, Liang Suisha, Zhong Huanzi, et al. 2017. “The Gut Microbiome In Atherosclerotic Cardiovascular Disease.” Nature Communications 8: 845. 10.1038/s41467-017-00900-1 [DOI] [PMC free article] [PubMed] [Google Scholar]
- 50. Qin, Junjie , Li Yingrui, Cai Zhiming, Li Shenghui, Zhu Jianfeng, Zhang Fan, Liang Suisha, et al. 2012. “A Metagenome‐Wide Association Study Of Gut Microbiota In Type 2 Diabetes.” Nature 490: 55–60. 10.1038/nature11450 [DOI] [PubMed] [Google Scholar]
- 51. Nishijima, Suguru , Suda Wataru, Oshima Kenshiro, Kim Seok‐Won, Hirose Yuu, Morita Hidetoshi, and Hattori Masahira. 2016. “The Gut Microbiome Of Healthy Japanese and Its Microbial and Functional Uniqueness.” DNA Research 23: 125–133. 10.1093/dnares/dsw002 [DOI] [PMC free article] [PubMed] [Google Scholar]
- 52. Lim, Mi Young , Rho Mina, Song Yun‐Mi, Lee Kayoung, Sung Joohon, and Ko GwangPyo. 2014. “Stability Of Gut Enterotypes In Korean Monozygotic Twins and Their Association With Biomarkers and Diet.” Scientific Reports 4: 7348. 10.1038/srep07348 [DOI] [PMC free article] [PubMed] [Google Scholar]
- 53. Feng, Qiang , Liang Suisha, Jia Huijue, Stadlmayr Andreas, Tang Longqing, Lan Zhou, Zhang Dongya, et al. 2015. “Gut Microbiome Development Along the Colorectal Adenoma‐Carcinoma Sequence.” Nature Communications 6: 6528. 10.1038/ncomms7528 [DOI] [PubMed] [Google Scholar]
- 54. Qin, Junjie , Li Ruiqiang, Raes Jeroen, Arumugam Manimozhiyan, Burgdorf Kristoffer Solvsten, Manichanh Chaysavanh, Nielsen Trine, et al. 2010. “A Human Gut Microbial Gene Catalogue Established By Metagenomic Sequencing.” Nature 464: 59–65. 10.1038/nature08821 [DOI] [PMC free article] [PubMed] [Google Scholar]
- 55. Zeller, Georg , Tap Julien, Voigt Anita Y., Sunagawa Shinichi, Kultima Jens Roat, Costea Paul I., Amiot Aurélien, et al. 2014. “Potential Of Fecal Microbiota for Early‐Stage Detection Of Colorectal Cancer.” Molecular Systems Biology 10: 766. 10.15252/msb.20145645 [DOI] [PMC free article] [PubMed] [Google Scholar]
- 56. Karlsson, Fredrik H. , Tremaroli Valentina, Nookaew Intawat, Bergström Göran, Behre Carl Johan, Fagerberg Björn, Nielsen Jens, and Bäckhed Fredrik. 2013. “Gut Metagenome In European Women With Normal, Impaired and Diabetic Glucose Control.” Nature 498: 99–103. 10.1038/nature12198 [DOI] [PubMed] [Google Scholar]
- 57. Human Microbiome Project, Consortium 2012. “Structure, Function and Diversity Of the Healthy Human Microbiome.” Nature 486: 207–214. 10.1038/nature11234 [DOI] [PMC free article] [PubMed] [Google Scholar]
- 58. Lloyd‐Price, Jason , Mahurkar Anup, Rahnavard Gholamali, Crabtree Jonathan, Orvis Joshua, Hall A Brantley, Brady Arthur, et al. 2017. “Strains, Functions and Dynamics In the Expanded Human Microbiome Project.” Nature 550: 61–66. 10.1038/nature23889 [DOI] [PMC free article] [PubMed] [Google Scholar]
- 59. Obregon‐Tito, Alexandra J. , Tito Raul Y., Metcalf Jessica, Sankaranarayanan Krithivasan, Clemente Jose C., Ursell Luke K., Xu Zhenjiang Zech, et al. 2015. “Subsistence Strategies In Traditional Societies Distinguish Gut Microbiomes.” Nature Communications 6: 6505. 10.1038/ncomms7505 [DOI] [PMC free article] [PubMed] [Google Scholar]
- 60. Camacho, Christiam , Coulouris George, Avagyan Vahram, Ma Ning, Papadopoulos Jason, Bealer Kevin, and Madden Thomas L.. 2009. “BLAST+: Architecture and Applications.” BMC Bioinformatics 10: 421. 10.1186/1471-2105-10-421 [DOI] [PMC free article] [PubMed] [Google Scholar]
- 61. Shen, Yujie , Li Luquan, Wei Lu, Zhang Xianhong, Zhao Wenjing, Liu Xiaochen, and Wu Liping. 2022. “[Influence Of Enteral Feeding Initiation Time On Intestinal Flora and Metabolites In Very Low Birth Weight Infants: A Prospective Study].” Zhongguo Dang Dai Er Ke Za Zhi 24: 433–439. 10.7499/j.issn.1008-8830.2111165 [DOI] [PMC free article] [PubMed] [Google Scholar]
- 62. Konopiński, Maciej K . 2020. “Shannon Diversity Index: a Call To Replace the Original Shannon's Formula With Unbiased Estimator In the Population Genetics Studies.” PeerJ 8: e9391. 10.7717/peerj.9391 [DOI] [PMC free article] [PubMed] [Google Scholar]
- 63. Chen, Tong , Liu Yong‐Xin, and Huang Luqi. 2022. “ImageGP: An Easy‐To‐Use Data Visualization Web Server for Scientific Researchers.” iMeta 1: e5. 10.1002/imt2.5 [DOI] [PMC free article] [PubMed] [Google Scholar]
Associated Data
This section collects any data citations, data availability statements, or supplementary materials included in this article.
Supplementary Materials
Supporting information.
Supporting information.
Data Availability Statement
(For all public metagenomic data used in this manuscript, the web links or references are provided in the Materials and Methods Section. Other data generated in this manuscript are included in additional files. For all public metagenomics data used in this manuscript, web links or references are provided. All codes used are saved in GitHub https://github.com/chaunceyZZ/iMeta2023TaxonomicIdentificationofBileSaltHydrolase-EncodingLactobacilli.git). Supporting Information (figures, tables, graphical abstract, and methods) may be found in the online DOI or iMeta Science http://www.imeta.science/.