Figure 1.

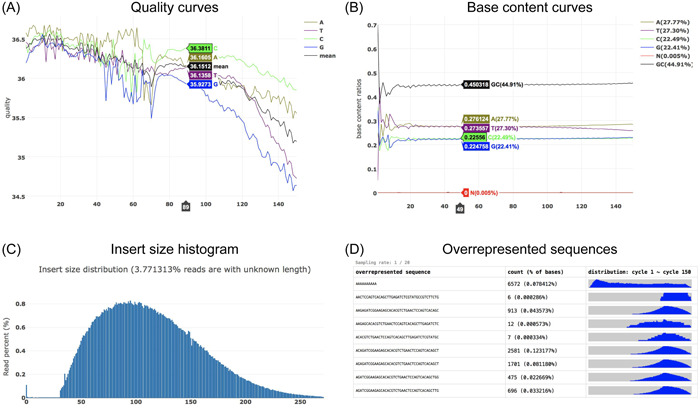
Part of interactive statistical plots of fastp. (A) The per‐cycle quality curves, and (B) the per‐cycle base content curves. (C) The distribution of evaluated insert size, with a small portion of reads remaining unknown due to their paired reads that are not overlapped, which is usually due to the fragments being too long. (D) The statistics of overrepresented sequences, including their per‐cycle distribution.
