

Significance
Changing climate and biodiversity modify the functioning of ecosystems. Yet, their interactions remain insufficiently understood, especially for decomposition, a key process for biosphere–atmosphere carbon feedbacks. We tested how drought and the diversity of soil organisms and plant leaf litter interactively drive decomposition in forest ecosystems across distinct climate zones. An increasingly complex decomposer community, and to a lesser degree, a richer mix of plant species in litter alleviated negative drought effects on decomposition. These findings suggest that fostering biodiversity is an important leverage for maintaining critical ecosystem functions under ongoing climate change.
Keywords: biodiversity, climate change, ecosystem functioning, forest carbon cycling, litter decomposition
Abstract
Multiple facets of global change affect the earth system interactively, with complex consequences for ecosystem functioning and stability. Simultaneous climate and biodiversity change are of particular concern, because biodiversity may contribute to ecosystem resistance and resilience and may mitigate climate change impacts. Yet, the extent and generality of how climate and biodiversity change interact remain insufficiently understood, especially for the decomposition of organic matter, a major determinant of the biosphere–atmosphere carbon feedbacks. With an inter-biome field experiment using large rainfall exclusion facilities, we tested how drought, a common prediction of climate change models for many parts of the world, and biodiversity in the decomposer system drive decomposition in forest ecosystems interactively. Decomposing leaf litter lost less carbon (C) and especially nitrogen (N) in five different forest biomes following partial rainfall exclusion compared to conditions without rainfall exclusion. An increasing complexity of the decomposer community alleviated drought effects, with full compensation when large-bodied invertebrates were present. Leaf litter mixing increased diversity effects, with increasing litter species richness, which contributed to counteracting drought effects on C and N loss, although to a much smaller degree than decomposer community complexity. Our results show at a relevant spatial scale covering distinct climate zones that both, the diversity of decomposer communities and plant litter in forest floors have a strong potential to mitigate drought effects on C and N dynamics during decomposition. Preserving biodiversity at multiple trophic levels contributes to ecosystem resistance and appears critical to maintain ecosystem processes under ongoing climate change.
Climate change profoundly affects ecosystem structure and function (1–3). Ecosystem processes with strong temperature and humidity dependence, such as litter decomposition (4–6) that drives much of the terrestrial carbon (C) and nutrient cycling, may be particularly sensitive (7–9). Decomposition is regulated by a high diversity of soil organisms ranging from prokaryotes to macro-invertebrates that are organized in highly complex food webs (10). Decomposition further depends on the characteristics and diversity of plant-produced organic matter as the primary energy source (11, 12). While all these components of the decomposer system are fundamental for the understanding of biodiversity effects on ecosystem functioning (13, 14), their complexity renders the prediction of the consequences of climate change challenging (15, 16). Biodiversity may alleviate adverse climatic conditions because of an increasing probability of more resistant species being present [known as the insurance hypothesis of biodiversity (17, 18)]. Such compensatory effects of biodiversity were reported for primary productivity of plant communities (19, 20), but it remains unclear how biodiversity changes across trophic levels affect other ecosystem processes, such as decomposition.
Beyond rising temperature, an increasing frequency and intensity of drought events are among the most common and likely predictions of the possible consequences of ongoing climate change, in particular for the Northern Hemisphere (21). Drought leads to water limitation in the activity and ultimately in the abundance and composition of decomposer communities (22–25). Climate change induced shifts in plant community composition and the loss of plant species (26) affect substrate availability to decomposers through altered plant litter production and composition, which can have additional indirect effects on decomposition (12, 27).
The limited number of existing studies indicate that increasing litter diversity may mitigate slower decomposition under drought (24, 28, 29), but these effects can be very small (28) and were not supported by others (22). Decomposers on the other hand show body size–dependent drought resistance (30) that can also vary among taxa (31). Detritivores of relatively large body size may be less drought-sensitive than microorganisms (27), and they can considerably increase overall decomposition either directly through litter consumption and fragmentation (32) or indirectly through cascading effects on microbial decomposers by the transformation of litter to faeces (33). Increasing litter diversity and decomposer community complexity can interactively change carbon (C) and nitrogen (N) fluxes during litter decomposition in a variety of ecosystems (12), but it is presently unknown how increasing drought intensity predicted for the near future modifies these interactions, which critically limits the understanding of the consequences of concomitantly changing climatic conditions and biodiversity for biogeochemical cycling.
We addressed this question in the present experimental field study across different forest biomes ranging from the temperate to the tropical climate zone across China. We manipulated forest floor humidity with a series of rainfall exclusion experiments and the complexity of decomposer communities and the richness of plant leaf litter (SI Appendix, Table S1 and Fig. S1 and Materials and Methods). We hypothesized that 1) reductions in the amount of rainfall, followed by lower soil moisture, will decrease C and N fluxes during decomposition and that 2) higher litter diversity and more complex decomposer communities alleviate the negative drought effects.
Results and Discussion
Partial rainfall exclusion reduced topsoil moisture by an average of 20.6 ± 4.1% across the five different forest biomes, but soil temperature did not change (SI Appendix, Table S1). As expected, total litter mass loss proceeded less rapidly under drought (46.8 ± 7.8% on average) compared to control conditions (57.8 ± 7.2% on average) (SI Appendix, Table S2). Accordingly, there was 17.9 ± 4.4% less C and 27.4 ± 4.2% less N lost from decomposing litter in drought compared to control plots (Fig. 1 and Table 1 and SI Appendix, Fig. S2). Slower decomposition under drought was reported in earlier studies, both including soil invertebrates (24) or solely microbial driven (34) and confirms the important role of climate control over decomposition (4–6). An increasing complexity of the decomposer communities, which is likely associated with higher functional diversity, increased C and N loss from decomposing litter, regardless of the treatment-induced differences in soil moisture (Table 1 and Fig. 1), underpinning the critical role of a diverse decomposer community in the C and N cycle (12). Across all sites, the presence of mesofauna (e.g., springtails and mites) in the decomposer community increased C and N loss on average by 15.4 ± 2.0% and 15.9 ± 12.9%, respectively (Fig. 1 and Table 1), and the complete decomposer community, additionally including macrofauna (e.g., millipedes and isopods), increased C and N loss by 35.2 ± 2.3% and 51.9 ± 17.1%, respectively (compared to the treatment without access of these two groups of organisms). These differences in C and N loss due to an increasing decomposer community complexity are comparable to previous studies (12, 35) and are within the range of a former global meta-analysis (36) that, however, showed some differences among biomes. They reported for example somewhat higher fauna effects in tropical wet forests than in deciduous forests on average (36). Our experimental design with replicated partial rainfall exclusion plots and control plots in one forest of each biome, does not allow to thoroughly test biome-specific differences (Materials and Methods). The effects of the complete decomposer community appeared to vary little among the distinct forest ecosystems in five different biomes but seemed to be comparatively larger in the temperate Korean pine mixed broadleaf forest (the climatically least favorable northernmost location) and the subtropical mixed pine forest (the second most southern and climatically rather favorable location) and lowest in the bamboo forest (intermediate latitudinal position) (SI Appendix, Tables S2–S4).
Fig. 1.

Litter C (A) and N (B) loss and drought effect size for C loss (C) and N loss (D) with increasing complexity of decomposer communities. Decomposer community complexity was manipulated by using litterbags of 0.05 mm mesh size [allowing the presence of microorganisms and microfauna (e.g., nematodes and protists) only], litterbags of 1 mm mesh size (allowing additionally the access by mesofauna (e.g., springtails and mites)), and litterbags of 5 mm mesh size [allowing access by the full complexity of decomposers communities including macrofauna (e.g., millipedes and isopods)]. Mean values of all litter treatments across the five locations are shown for control plots (white) and for partial rainfall exclusion plots (orange) in panels (A and B) [n = 15 litter combinations × 18 replicated plots per treatment (control vs. drought) for the five locations = 270, see Table 1 for statistics]. The numbers on top of each pair of columns show the relative difference between the mean values in the control and the drought treatment for each level of decomposer complexity. Dashed lines in panels (A and B) indicate average values of litter C or N loss in the control treatment with the simplest decomposer community. The drought effect size (lnR) of C loss (panel C) and N loss (Hedges d, panel D) are shown for each level of decomposer complexity, with different capital letters indicating significant decomposer complexity differences at P < 0.05 (no significant differences for drought effect size on N loss). Dashed lines in panels (C and D) indicate the zero line (negative effects sizes below and positive effect sizes above the zero line). Linear mixed models, where location was considered as random effect were used for statistical testing and comparisons were done by the least square significant (LSD) method.
Table 1.
Variance in C and N loss associated with drought treatment, diversity, and their interactions
| C loss | N loss | ||||
|---|---|---|---|---|---|
| Source of variance | df | F | P | F | P |
| Drought | 1 | 206.8 | <0.001 | 70.4 | <0.001 |
| Leaf litter type richness (LR) | 3 | 1.33 | 0.26 | 8.55 | <0.001 |
| Decomposers complexity (DC) | 2 | 112.8 | <0.001 | 41.2 | <0.001 |
| Drought * LR | 3 | 2.96 | 0.03 | 0.86 | 0.46 |
| Drought * DC | 2 | 1.27 | 0.28 | 0.22 | 0.80 |
| LR * DC | 6 | 0.44 | 0.86 | 0.45 | 0.84 |
| Drought * LR *DC | 6 | 0.49 | 0.82 | 0.45 | 0.85 |
ANOVA was conducted by linear mixed models (LMM), where location was considered as random effect. Bold values are used for P-values indicating statistically significant effects at P < 0.05.
The relative difference between the drought and the control treatment was smaller the more complex the decomposer community, in particular for C loss (Fig. 1A). In fact, the drought effect size on C loss was significantly smaller (less negative) when all decomposer organisms were present compared to when larger size invertebrates were absent (Fig. 1C). Marginally significant interactions between drought and decomposer complexity were also observed for net diversity effects of C and N loss (Table 2). Most importantly, the average C and N losses tended to be even higher (statistically not significantly different) under drought with the full decomposer complexity compared to the control treatment with the simplest decomposer community (excluding meso- and macrofauna, see dashed line in Fig. 1 A and B). These results indicate that larger invertebrates can fully compensate drought effects on microbial-dominated decomposition. Previous studies indeed showed much smaller effects of reduced precipitation on soil fauna activity (37, 38) than on microbial decomposers (37). As a consequence of such contrasting responses in the activity of these two important groups of decomposer organisms litter C loss may remain unaltered under drought when fauna is present but may be significantly reduced in the absence of fauna (27). Drought-mitigating effects on decomposition by soil fauna were reported during the extreme El Niño year in 2015 to 2016 in a Bornean tropical rainforest (32). Faunal effects could also have longer-lasting ecosystem consequences via changes in nutrient dynamics (32) and through fauna-induced translocation of organic matter into deeper and more humid soil layers (39), which could be particularly relevant in a future climate with less precipitation. However, in the longer term, potentially counteracting effects through changes in the abundance of certain groups of soil fauna are also possible (23, 24), which can lead to altered food web structure and indirect drought effects through modified trophic interactions (40).
Table 2.
Variance in net diversity effects, complementarity effects, and selection effects of litter mixtures on C and N loss associated with drought, litter type richness, decomposer community complexity, and their interactions
| Net diversity | Complementarity | Selection | |||||
|---|---|---|---|---|---|---|---|
| Source of variance | df | F | P | F | P | F | P |
| C loss | |||||||
| Drought | 1 | 23.0 | <0.001 | 12.8 | <0.001 | 1.01 | 0.314 |
| Leaf litter type richness (LR) | 2 | 330.2 | <0.001 | 260.1 | <0.001 | 0.73 | 0.482 |
| Decomposers complexity (DC) | 2 | 8.30 | <0.001 | 7.89 | <0.001 | 0.88 | 0.415 |
| Drought * LR | 2 | 7.28 | 0.001 | 4.35 | 0.013 | 0.29 | 0.744 |
| Drought * DC | 2 | 2.57 | 0.077 | 2.59 | 0.076 | 2.16 | 0.116 |
| LR * DC | 4 | 1.01 | 0.399 | 0.81 | 0.517 | 0.10 | 0.982 |
| Drought * LR * DC | 4 | 1.28 | 0.276 | 1.04 | 0.388 | 0.23 | 0.919 |
| N loss | |||||||
| Drought | 1 | 10.5 | 0.001 | 6.35 | 0.012 | 0.30 | 0.584 |
| LR | 2 | 52.5 | <0.001 | 35.8 | <0.001 | 1.99 | 0.137 |
| DC | 2 | 6.08 | 0.002 | 0.18 | 0.838 | 5.76 | 0.003 |
| Drought * LR | 2 | 2.69 | 0.068 | 2.24 | 0.107 | 0.96 | 0.384 |
| Drought * DC | 2 | 2.73 | 0.065 | 0.23 | 0.796 | 2.25 | 0.106 |
| LR * DC | 4 | 0.87 | 0.479 | 0.44 | 0.780 | 1.25 | 0.289 |
| Drought * LR * DC | 4 | 1.51 | 0.197 | 0.76 | 0.552 | 0.98 | 0.420 |
ANOVA was conducted using linear mixed models (LMM), where location was considered as random effect. Bold values are used for P-values indicating statistically significant effects at P < 0.05.
Nitrogen loss during decomposition increased with the number of litter types in the litter mixtures (SI Appendix, Fig. S2 and Table 1), showing that tree species diversity modifies N cycling via a mixed litter layer decomposing on the forest floor across substantially different forest types. While this positive litter richness effect is broadly in agreement with recent meta-analyses on litter diversity effects beyond two litter species (41, 42), they were comparatively modest, and the litter richness effects on C loss further depended on partial rainfall exclusion (significant drought × litter type richness effect, Table 1). This interaction with drought was mostly driven by smaller differences in C loss between drought and control conditions from two- and four-species mixtures (SI Appendix, Fig. S2). The litter-type richness effect on N loss was more consistent across treatments with overall increasing N losses with increasing litter species number. At the highest richness level of four litter species, for example, this resulted in 9.4% and 33.7% higher N loss compared to one-species litter treatments in control and drought conditions, respectively. This larger effect on N loss in drought than in control conditions was common for all litter mixtures compared to one-species litter treatments (SI Appendix, Fig. S2), indicating a stronger litter mixture effect under drought regardless of the species number (no significant drought × litter type richness effect, Table 1). During the initial stage of decomposition, N can also be immobilized possibly leading to net increases in litter N rather than net N losses (43). Although we measured net N loss across all treatment combinations, there was some apparent net N immobilization in the two northernmost sites of the temperate Korean pine and broadleaf mixed forest (KBF) and the warm-temperate oak forest (OF) (SI Appendix, Table S4). This N immobilization was driven entirely by the pine species at these two sites, Pinus koraiensis (at KBF) with an average net N increase of 113% and Pinus armandii (at OF) with an average net N increase of 19% across all treatment combinations.
For a more detailed evaluation of the litter diversity effects, we used the additive partitioning approach (44) based on the data of individual litter species C and N loss within all litter mixtures (Materials and Methods). Additive partitioning allows to separate the overall net diversity effect into complementarity and selection effects [the details of the applied formulae for these calculations are presented in Loreau and Hector’s paper (44)]. The complementarity effect quantifies the part of the diversity effect that is driven by interactions among species. For example, if decomposition mutually increases when species A and species B are mixed together [for example through nutrient transfer (12)] compared to when they decompose alone, a positive complementarity effect would result. On the other hand, if species C slows decomposition of admixed species, for example via inhibiting compounds, a negative complementarity effect would result. The selection effect quantifies the part of the net diversity effect that is driven by the presence of a particular species dominating the decomposition of the mixture as a whole, for example, a very slowly decomposing species. Our results showed that the overall mean positive net diversity effects on C and N loss were largely driven by complementarity effects (Fig. 2 and Table 2 and SI Appendix, Figs. S2 and S3), corroborating previous findings (12, 45). The fact that selection effects were overall unimportant is a noteworthy result, in particular, with the distinct functional litter types chosen here at all five locations. We expected that specific traits of some of the included litter types such as conifer needle litter or litter from N-fixing plant species could trigger negative or positive selection effects due to their presence within a litter mixture. The apparent net N immobilization observed in litter of the pine species at two sites, as discussed above, may indicate such potential selection effects on N loss under some conditions, but it was overall not strong enough to be detected across the different forest biomes. The dominant role of complementarity effects rather suggests that litter diversity effects were determined by interactions among distinct litter types, for example, by providing more diverse and complementary resources or more suitable habitats to decomposers possibly allowing the establishment of a more active, more diverse, or more abundant decomposer community (46, 47). These complementarity-driven interactions among litter types increased significantly with increasing litter type richness (Fig. 2 and Table 2 and SI Appendix, Fig. S3), clearly showing that a higher diversity of litter functional types within litter mixtures improve mixture decomposition with higher C and N turnover rates. This result, important for the understanding of the role of biodiversity in biogeochemical cycling, appeared to be robust across five distinct forest types from contrasting biomes (SI Appendix, Tables S5 and S6), but again, a thorough test for potential biome-specific responses would require multiple study sites within each biome.
Fig. 2.

Net diversity effects in two-, three-, and four-species litter mixtures on C loss (A) and N loss (B) and drought response ratios on C loss (C) and N loss (D). Mean values of all litter mixture treatments (single litter species treatments were used to calculate net diversity effects) across the five locations are shown for control plots (white) and for partial rainfall exclusion plots (orange) [n = 6, 4, and 1 litter combinations × 3 mesh sizes × 18 replicated plots per treatment (control vs. drought) for the five locations = 324, 216, and 54 for two, three, and four species mixtures, respectively., see Table 2 for statistics]. Asterisks indicate significant differences between control and drought treatments for each species richness level separately (*, **, and *** denote significant effects at P < 0.05, P < 0.01, and P < 0.001, and ns = not statistically significant). Panels (C) and (D) show the response ratios of the net diversity effects under drought in three- and four-species litter mixtures compared to the two-species mixtures under control conditions for C loss (C) and N loss (D).
Although drought reduced net diversity and complementarity effects overall, they remained significantly positive (Fig. 2 and Table 2 and SI Appendix, Fig. S3) and kept increasing with increasing litter-type richness, although at a somewhat lower rate (significant drought × litter type richness interaction, Table 2). This sustained increase in complementarity effects under drought with increasing litter type richness, indicates that higher litter diversity can counteract negative drought effects on litter C and N loss to some extent. For example, net diversity effects of three- and four-species mixtures under drought were up to two times higher compared to those of two-species mixtures under control conditions (Fig. 2 C and D). Maintaining similar diversity effects with the exclusion of substantial amounts of rainfall suggests that the mechanisms underlying complementarity effects are largely the same and remain operational under drought. Interestingly, the generally higher net diversity effects with increasing decomposer community complexity, tended to be stronger under drought (Fig. 3, marginally significant drought × decomposer complexity interaction for both C and N loss, Table 2). Accordingly, the negative drought effects were fully compensated by the most complex decomposer community (Fig. 3), suggesting that complementarity under drought became particularly important with a complete decomposer community, including litter-feeding macrofauna. This supports the critical importance of soil macrofauna for decomposition when conditions are becoming drier (27, 32, 37) as discussed above.
Fig. 3.
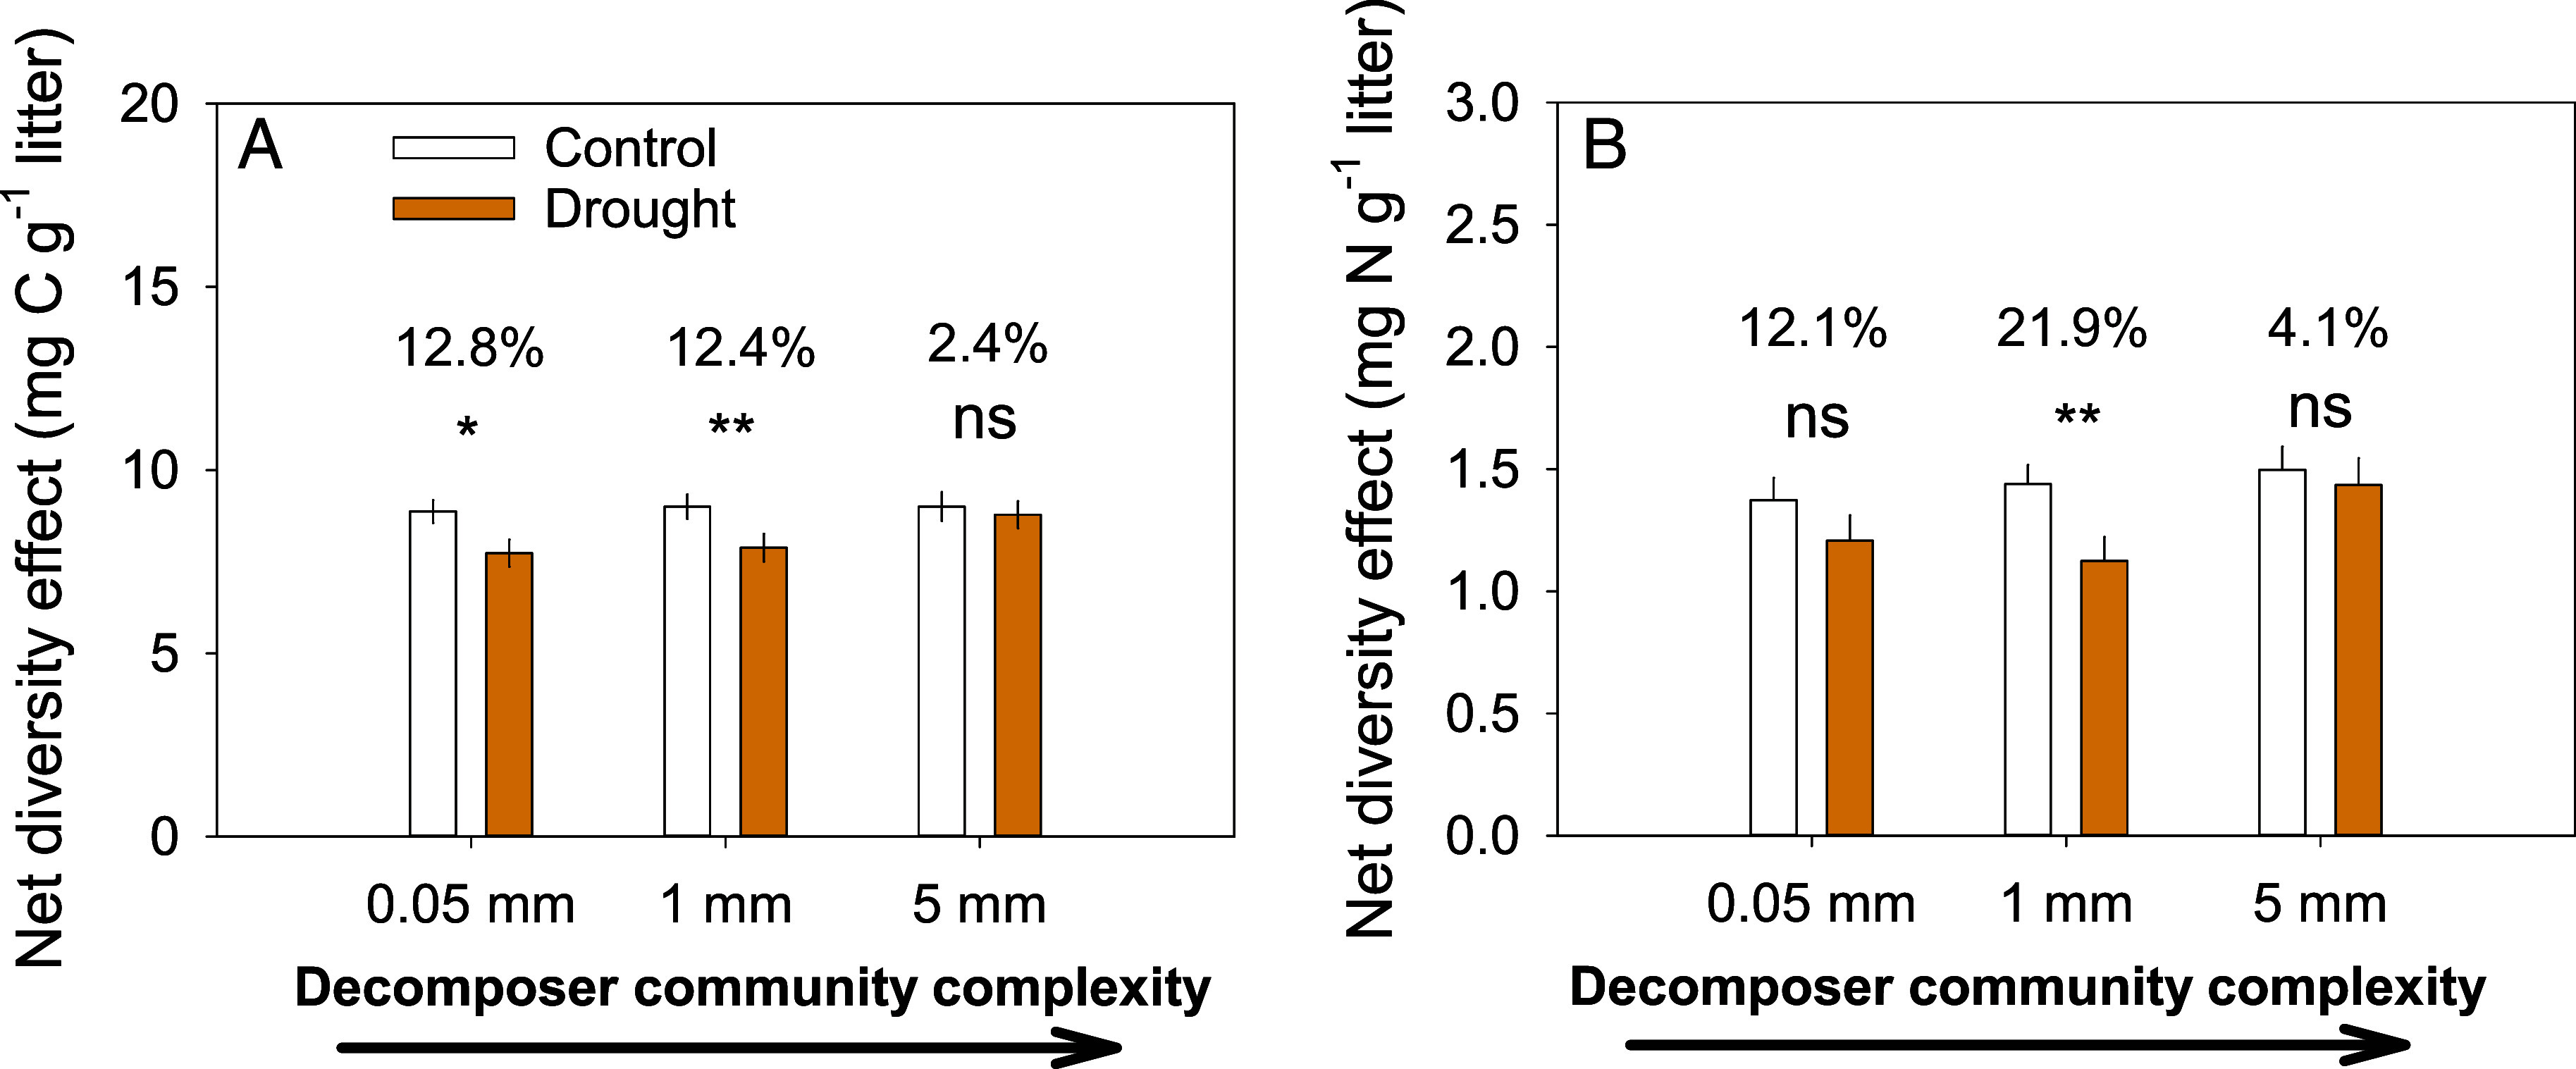
Net diversity effects with increasing decomposer community complexity [from left (0.05 mm mesh) to right (5 mm mesh)] on C loss (A) and N loss (B). Mean values of all litter mixture treatments (single litter species treatments were used to calculate net diversity effects) across the five locations are shown for control plots (white) and for partial rainfall exclusion plots (orange) [n = 11 litter mixtures × 18 replicated plots per treatment (control vs. drought) for the five locations = 198, see Table 2 for statistics]. The numbers on top of each pair of columns indicate the relative difference between the mean values in the control and the drought treatment followed by asterisks for statistical significance (* and ** denote significant effects at P < 0.05 and P < 0.01, and ns = not statistically significant) for each level of decomposer complexity.
It is important to note that despite the substantially higher net diversity effects with increasing litter richness, the differences in the absolute amounts of C and N loss are one to two orders of magnitude smaller than the total C and N loss reported in SI Appendix, Fig. S2. This means that the drought-counteracting litter diversity effects were not sufficiently large to fully compensate for negative drought effects, in contrast to the effects of decomposer complexity (Fig. 1). In other words, a diverse and complex decomposer community is more important than a diverse litter layer for the compensation of negative drought effects on C and N turnover in decomposing litter. These direct effects measured in our study, however, underestimate the importance of a structurally and chemically diverse litter layer by promoting decomposer complexity, richness, and/or abundance (48–50), with a potentially larger overall effect of litter diversity by indirectly determining the structure and complexity of decomposer communities.
Implications
Our study underscores the importance of functional tree diversity and decomposer community complexity, in particular, the presence of litter-feeding macrofauna, in maintaining ecosystem functioning under ongoing climate change. We provide strong evidence for drought-mitigation effects of litter diversity and decomposer community complexity on biogeochemical cycling across a wide variety of distinct forest types. However, in the longer term, species distribution and hence community composition and relative species abundances will be affected by climate change (51). The associated changes in litterfall composition and decomposer community complexity may then modify the drought-mitigation effects of litter diversity and detritivore macrofauna on C and N cycling we reported here. Depending on how litter functional diversity and decomposer communities are altered, the resulting changes may lead to stronger or weaker mitigation effects. This may also provide the possibility for potential management decisions in managed forests, for example, by fostering a functionally diverse litter layer and favoring litter detritivores and complex decomposer communities toward maintaining ecosystem functioning under more constraining future climatic conditions.
Materials and Methods
Experimental Sites and Design.
The experiments were set up in five distinct forest ecosystems across a broad latitudinal gradient spanning from the temperate to the tropical climatic zone (SI Appendix, Fig. S1 and Table S1). Accordingly, there were marked differences in climatic conditions with mean annual temperatures ranging between 3.8 °C and 22.5 °C and mean annual precipitation between 745 mm and 1,428 mm (SI Appendix, Table S1). At each of the five sites increased drought was simulated using partial rain exclusion beneath the tree canopy at about 1.5 to 2 m above the soil surface. Partial rain exclusion removed 50% of total precipitation except for the Korean pine and broadleaf mixed forest site with 30% removal (SI Appendix, Table S1 and Fig. S1). Detailed descriptions for the partial rain exclusion experiments at the different sites were published previously (52–56). At all sites, rainfall exclusion was applied using a pairwise design with three replicated pairs of 20 × 20 m plots, except for the bamboo forest with four replicated plot pairs, the Korean pine and broadleaf mixed forest with larger plots of 25 × 50 m, and the tropical rainforest with five replicated smaller plots of 10 × 10 m. The paired plots were separated by at least a 15 m wide buffer strip and with buried PVC boards (down to 100 cm of soil depth) along the circumference of each plot to avoid lateral water movement, except for the Korean pine and broadleaf mixed forest, where this additional plot separation was unnecessary with a rather flat topography. Partial rainfall exclusion was applied all year round, except for the two temperate sites (Korean pine and broadleaf mixed forest and oak forest) where the exclusion panels were removed during the winter to avoid snow damage. The precipitation received as snowfall in the partial exclusion plots during winter was less than 20% and 10% of the total annual rainfall at Korean pine and broadleaf mixed forest and oak forest, respectively. Partial rainfall exclusion significantly reduced moisture within the topsoil by an average of 20.6 ± 4.1% across all sites (SI Appendix, Table S1), but there were no significant differences in soil temperature.
At each location, the decomposition experiment included leaf litter from the most common site-specific native tree species from each of the same four distinct functional types, including different N acquisition strategies (N-fixer versus non-N-fixer), C allocation strategies (deciduous versus evergreen), leaf type of evergreen (broadleaved versus coniferous), and litter recalcitrance of deciduous non-N-fixers (rapidly decomposing versus slowly decomposing leaf litter). See SI Appendix, Fig. S1 for tree species selected from each site, their initial litter C to N ratio, and their C loss rate. Since there were no conifer tree species in the tropical rainforest, we used leaf litter from Castanopsis echidnocarpa instead, which shares similar traits with conifers (evergreen, slowly decomposing, and needle-shaped leaves). We used three different mesh sizes (0.05 mm, 1 mm, 5 mm) for litterbag construction. The different mesh sizes were chosen to allow access to an increasingly complex community of decomposer organisms. The smallest mesh width of 0.05 mm allowed access to microorganisms and microfauna (e.g., nematodes and protists), the intermediate mesh width of 1 mm additionally allowed access to mesofauna (e.g., collembolans and mites), and the largest mesh width of 5 mm also let pass macrofauna (e.g., isopods and smaller earthworms). The bottom side of all litterbags was made uniformly of 0.05 mm nylon mesh to prevent gravitational loss of small litter particles. All three types of litterbags (i.e., three different mesh sizes) contained litter from either of the four tree species individually or from the mixtures of all possible combinations of these four species (a total of 11 mixtures). Litterbags of all mesh sizes and all litter combinations were placed in each control plot and in each plot with rainfall exclusion at all five locations (n = 5 locations × 2 precipitation treatments × 15 litter combinations × 3 mesh sizes × 5 replicates for tropical rainforest and 4 replicates for bamboo forest and 3 replicates for the other sites = 1,620). In some of the locations, there were two litterbags per treatment combination and per plot, but we always used plot means for the statistical analysis.
Leaf Litter Collection and Field Incubations.
We collected the leaf litter from the four target species with litter traps underneath the trees (at least and often more than 10 individuals per species) at each site close to the experimental plots and created one common pool of litter for each litter species. We filled the 20 cm × 20 cm litterbags with a total of 8 g oven dried (at 65 °C) litter for each litter treatment with equal amounts of different species in mixed litterbags. The litterbags were placed at each plot avoiding edge effects of the rain-exclusion structures and with at least 0.5 m distance among individual litterbags. Each litterbag was held in place by fixing the corners of the litterbag with stings, while the bottom mesh was in close contact with the soil surface (natural litter layer removed before litterbag placement). The initial litter characteristics of each litter species were determined from five samples randomly taken from the well-mixed litter pool per species. The samples were oven-dried to constant mass at 65 °C and then ground with a ball mill to a fine homogeneous powder, with aliquots then analyzed for C, N, and P concentrations. Initial litter C and N concentrations were analyzed using an elemental analyzer (Costech ECS 4010, Valencia, Italy). Initial phosphorus (P) concentration was determined by an automatic chemical analyzer (Smartchem 300, AMS, Italy).
Mass, C and N Loss from Litterbags.
The litterbags were left in the field for 254 to 368 d depending on the site (SI Appendix, Table S1). After litterbag retrieval from the field, we dried samples to constant mass at 65 °C, then separating into individual species (for mixed species litterbags) by gently cleaning litter by brushing off any dirt without using water (to prevent nutrient leaching) before measuring dry mass for each constituent species. Mass loss and C and N concentrations (using the same method as described above for initial litter characteristics) of the litter were determined for each individual litter species sorted from each litterbag. Litter C and N loss (%) was calculated as , where Mi and Mf are the initial and final litter dry mass, respectively, and CNi and CNf are the initial and final C or N concentrations (% of litter dry mass).
Calculations and Statistical Analysis.
The separation of all individual litter types at the end of the decomposition experiment allowed us to use the additive partitioning approach to tease apart the two alternative mechanisms of the complementarity and the selection effect, which both contribute to the net diversity effect (44) for both C and N loss from litter mixtures. The complementarity effect refers to any biotic interactions among individual species within mixtures. These can be positive, for example, when transfer of elements such as N or C among litter types increase decomposition of the mixture compared to when individual litter types decompose singly. Complementarity effects can also be negative, although this is less frequently observed, when, for example, a specific species is rich in inhibiting compounds, such as phenolics, which slow decomposition of admixed litter types. The selection effect on the other hand quantifies a dominance effect of a particular species, for example, for a litter type that decomposes much less rapidly than others and may then dominate the decomposition of the mixture. The calculations are explained in detail in Loreau and Hector’s paper (44). Briefly, the net biodiversity effect was measured as the difference between the observed loss of the element in the mixture during the experiment and the expected loss in the mixture based on the measured element loss of individual litter types decomposing singly, that is ΔY = YO−YE, where YO =∑iYO,i is total observed element loss of the mixture, YO,i = observed element loss of species i in the mixture, YE = ∑i YE,i = ∑i RYE,i × Mi is the total expected element loss of the mixture, YE,i = RYE,i × Mi = expected element loss of species i in the mixture, Mi is the element loss of species i in single species litterbags, ΔRYi = RYO,i – RYE,i is the deviation from expected relative element loss of species i in the mixture, RYO,i = YO,i/Mi = observed relative element loss of species i in the mixture, and RYE,i = expected relative element loss of species i in the mixture.
The net biodiversity effect is the sum of the complementarity effect and the selection effect, that is:
with quantifying the complementarity effect, and quantifying the selection effect.
Ns is the number of species in the mixture.
To meet the assumptions for the ANOVA of net diversity, complementarity, and selection effects, all data of C and N loss were square-root transformed but the original negative and positive signs for the transformed values were kept.
We used the natural logarithm of the response ratio (R) as a metric of effect size (57) on C loss, a metric that reflects a relative change in the variable due to partial rainfall exclusion:
where XT is the treatment mean and XC is the control mean. If the treatment increased or decreased the target variable the effect size lnR was greater or smaller than zero, respectively.
In addition, we used Hedges d as a metric of effect size on N loss because there are negative values (58).
Ye and Yc are the treatment mean and control mean; Ne and Nc are the treatment sample number and control sample number, and Se and Sc are the variance for the treatment and control, respectively.
ANOVA was conducted to assess the effects of drought, the richness of plant litter functional types, the complexity of the decomposer community, and their interactions on litter C and N loss, and diversity effects (net diversity effect, complementarity effect, and selection effect) of plant litter mixtures on C and N loss. We included the location (the experimental site within each biome) as a random effect in the mixed models, because we had no a priori hypothesis for the drought effects among the different sites. Also, the sites were not replicated within biomes because of the very heavy workload to keep five rain exclusion facilities running simultaneously. Although the experiments were well replicated within each of the five biome-specific sites, each biome is represented by one single forest site, which does not allow to thoroughly test biome-specific responses. ANOVA was also performed to assess the effects of decomposer complexity or plant litter functional type richness on the response ratio (lnR) of litter C loss and multiple comparisons were conducted with the least significant difference (LSD) method. We further assessed the drought effect on net diversity effect of plant litter mixtures on C and N loss for each level of decomposer complexity or plant litter functional type richness, where location was considered as random effect using the same type of the mixed models mentioned above. All the statistical analyses were conducted using IBM SPSS Statistics 21.0 (IBM SPSS Statistics Inc.).
Supplementary Material
Appendix 01 (PDF)
Acknowledgments
We would like to thank Drs. Dapao Yu, Guanhua Dai, Xinwei Guo, and Jinglei Zhang for their help in experiment implementation and field sampling. Thanks go to Professor Joann K. Whalen for her valuable comments on the early stage of the manuscript. This study was jointly funded by the National Key R&D Program of China (2021YFD2200403 and 2021YFD2200405), Science and technology cooperation projects between governments of China and the European Union (2023YFE0105100), the National Natural Science Foundation of China (Nos. 31930078, 31971461, 31670450, 32101500, and 42073080), and the Fundamental Research Funds for ICBR (1632021023, 1632019006, and 1630032023002).
Author contributions
J.L. and S. Liu designed research; J.L., S. Li, S. Liu, Y.W., L.D., H.L., L.C., J.Z., W.Z., S. Han, and Y.Z. performed research; J.L. and S. Hättenschwiler analyzed data; and J.L., S. Liu, and S. Hättenschwiler wrote the paper.
Competing interests
The authors declare no competing interest.
Footnotes
This article is a PNAS Direct Submission.
Contributor Information
Junwei Luan, Email: junweiluan@icbr.ac.cn.
Shirong Liu, Email: liusr@caf.ac.cn.
Data, Materials, and Software Availability
Our derived data are provided in SI Appendix, Tables S1–S7. All raw data have been deposited in Dryad (59).
Supporting Information
References
- 1.Stige L. C., Kvile K. Ø., Climate warming drives large-scale changes in ecosystem function. Proc. Natl. Acad. Sci. U.S.A. 114, 12100–12102 (2017). [DOI] [PMC free article] [PubMed] [Google Scholar]
- 2.Reichstein M., et al. , Climate extremes and the carbon cycle. Nature 500, 287–295 (2013). [DOI] [PubMed] [Google Scholar]
- 3.Davidson E. A., Janssens I. A., Temperature sensitivity of soil carbon decomposition and feedbacks to climate change. Nature 440, 165–173 (2006). [DOI] [PubMed] [Google Scholar]
- 4.Coûteaux M.-M., Bottner P., Berg B., Litter decomposition, climate and liter quality. Trends Ecol. Evol. 10, 63–66 (1995). [DOI] [PubMed] [Google Scholar]
- 5.Aerts R., Climate, leaf litter chemistry and leaf litter decomposition in terrestrial ecosystems: A triangular relationship. Oikos 79, 439–449 (1997). [Google Scholar]
- 6.Joly F.-X., Scherer-Lorenzen M., Hättenschwiler S., Resolving the intricate role of climate in litter decomposition. Nat. Ecol. Evol. 7, 214–223 (2023). [DOI] [PubMed] [Google Scholar]
- 7.Adair E. C., et al. , Simple three-pool model accurately describes patterns of long-term litter decomposition in diverse climates. Global Change Biol. 14, 2636–2660 (2008). [Google Scholar]
- 8.Yahdjian L., Sala O. E., Austin A. T., Differential controls of water input on litter decomposition and nitrogen dynamics in the Patagonian steppe. Ecosystems 9, 128–141 (2006). [Google Scholar]
- 9.Yuste J. C., et al. , Drought-resistant fungi control soil organic matter decomposition and its response to temperature. Global Change Biol. 17, 1475–1486 (2011). [Google Scholar]
- 10.Bardgett R. D., van der Putten W. H., Belowground biodiversity and ecosystem functioning. Nature 515, 505–511 (2014). [DOI] [PubMed] [Google Scholar]
- 11.Cornwell W. K., et al. , Plant species traits are the predominant control on litter decomposition rates within biomes worldwide. Ecol. Lett. 11, 1065–1071 (2008). [DOI] [PubMed] [Google Scholar]
- 12.Handa I. T., et al. , Consequences of biodiversity loss for litter decomposition across biomes. Nature 509, 218–221 (2014). [DOI] [PubMed] [Google Scholar]
- 13.Gessner M. O., et al. , Diversity meets decomposition. Trends Ecol. Evol. 25, 372–380 (2010). [DOI] [PubMed] [Google Scholar]
- 14.Eisenhauer N., et al. , A multitrophic perspective on biodiversity–ecosystem functioning research. Adv. Ecol. Res. (Elsevier) 61, 1–54 (2019). [DOI] [PMC free article] [PubMed] [Google Scholar]
- 15.Pires A. P., et al. , Interactive effects of climate change and biodiversity loss on ecosystem functioning. Ecology 99, 1203–1213 (2018). [DOI] [PubMed] [Google Scholar]
- 16.Brose U., Hillebrand H., Biodiversity and ecosystem functioning in dynamic landscapes. Phil. Trans. R. Soc. B 371, 20150267 (2016). [DOI] [PMC free article] [PubMed] [Google Scholar]
- 17.Yachi S., Loreau M., Biodiversity and ecosystem productivity in a fluctuating environment: The insurance hypothesis. Proc. Natl. Acad. Sci. U.S.A. 96, 1463–1468 (1999). [DOI] [PMC free article] [PubMed] [Google Scholar]
- 18.Eklöf J. S., et al. , Experimental climate change weakens the insurance effect of biodiversity. Ecol. Lett. 15, 864–872 (2012). [DOI] [PubMed] [Google Scholar]
- 19.Isbell F., et al. , Biodiversity increases the resistance of ecosystem productivity to climate extremes. Nature 526, 574–577 (2015). [DOI] [PubMed] [Google Scholar]
- 20.Craven D., et al. , Plant diversity effects on grassland productivity are robust to both nutrient enrichment and drought. Philos. Trans. R Soc. B Biol. Sci. 371, 20150277 (2016). [DOI] [PMC free article] [PubMed] [Google Scholar]
- 21.IPCC, Climate Change 2021: The Physical Science Basis. Contribution of Working Group I to the Sixth Assessment Report of the Intergovernmental Panel on Climate Change (Cambridge University Press, Cambridge, United Kingdom and New York, NY, USA), 2021). [Google Scholar]
- 22.Vogel A., Eisenhauer N., Weigelt A., Scherer-Lorenzen M., Plant diversity does not buffer drought effects on early-stage litter mass loss rates and microbial properties. Global Change Biol. 19, 2795–2803 (2013). [DOI] [PubMed] [Google Scholar]
- 23.Kardol P., Cregger M. A., Campany C. E., Classen A. T., Soil ecosystem functioning under climate change: Plant species and community effects. Ecology 91, 767–781 (2010). [DOI] [PubMed] [Google Scholar]
- 24.Santonja M., et al. , Plant litter mixture partly mitigates the negative effects of extended drought on soil biota and litter decomposition in a Mediterranean oak forest. J. Ecol. 105, 801–815 (2017). [Google Scholar]
- 25.Coleman D. C., Callaham Mac A. Jr., Crossley D. A. Jr., Fundamentals of Soil Ecology (Elsevier Academic Press, San Diego, ed. 3, 2018). [Google Scholar]
- 26.Harrison S., LaForgia M., Seedling traits predict drought-induced mortality linked to diversity loss. Proc. Natl. Acad. Sci. U.S.A. 116, 5576–5581 (2019). [DOI] [PMC free article] [PubMed] [Google Scholar]
- 27.Joly F.-X., Weibel A. K., Coulis M., Throop H. L., Rainfall frequency, not quantity, controls isopod effect on litter decomposition. Soil Biol. Biochem. 135, 154–162 (2019). [Google Scholar]
- 28.Jourdan M., Hättenschwiler S., Decomposition in mixed beech forests in the south-western Alps under severe summer drought. Ecosystems 24, 2061–2078 (2021). [Google Scholar]
- 29.Makkonen M., Berg M. P., Van Logtestijn R. S. P., Van Hal J. R., Aerts R., Do physical plant litter traits explain non-additivity in litter mixtures? A test of the improved microenvironmental conditions theory. Oikos 122, 987–997 (2013). [Google Scholar]
- 30.Ellers J., et al. , Diversity in form and function: Vertical distribution of soil fauna mediates multidimensional trait variation. J. Animal Ecol. 87, 933–944 (2018). [DOI] [PubMed] [Google Scholar]
- 31.Siebert J., et al. , The effects of drought and nutrient addition on soil organisms vary across taxonomic groups, but are constant across seasons. Sci. Rep. 9, 639–639 (2019). [DOI] [PMC free article] [PubMed] [Google Scholar]
- 32.Ashton L. A., et al. , Termites mitigate the effects of drought in tropical rainforest. Science 363, 174–177 (2019). [DOI] [PubMed] [Google Scholar]
- 33.Joly F. X., Coq S., Coulis M., Nahmani J., Hättenschwiler S., Litter conversion into detritivore faeces reshuffles the quality control over C and N dynamics during decomposition. Funct. Ecol. 32, 2605–2614 (2018). [Google Scholar]
- 34.Allison S. D., et al. , Microbial abundance and composition influence litter decomposition response to environmental change. Ecology 94, 714–725 (2013). [DOI] [PubMed] [Google Scholar]
- 35.Luan J., et al. , Functional diversity of decomposers modulates litter decomposition affected by plant invasion along a climate gradient. J. Ecol. 109, 1236–1249 (2021). [Google Scholar]
- 36.García-Palacios P., Maestre F. T., Kattge J., Wall D. H., Climate and litter quality differently modulate the effects of soil fauna on litter decomposition across biomes. Ecol. Lett. 16, 1045–1053 (2013). [DOI] [PMC free article] [PubMed] [Google Scholar]
- 37.Coulis M., Hättenschwiler S., Fromin N., David J., Macroarthropod-microorganism interactions during the decomposition of Mediterranean shrub litter at different moisture levels. Soil Biol. Biochem. 64, 114–121 (2013). [Google Scholar]
- 38.Thakur M. P., et al. , Reduced feeding activity of soil detritivores under warmer and drier conditions. Nat. Climate Change 8, 75–78 (2018). [DOI] [PMC free article] [PubMed] [Google Scholar]
- 39.Coulis M., Hättenschwiler S., Coq S., David J.-F., Leaf litter consumption by macroarthropods and burial of their faeces enhance decomposition in a Mediterranean ecosystem. Ecosystems 19, 1104–1115 (2016). [Google Scholar]
- 40.Lensing J. R., Wise D. H., Predicted climate change alters the indirect effect of predators on an ecosystem process. Proc. Natl. Acad. Sci. U.S.A. 103, 15502 (2006). [DOI] [PMC free article] [PubMed] [Google Scholar]
- 41.Mori A. S., Cornelissen J. H. C., Fujii S., Okada K.-I., Isbell F., A meta-analysis on decomposition quantifies afterlife effects of plant diversity as a global change driver. Nat. Commun. 11, 1–9 (2020). [DOI] [PMC free article] [PubMed] [Google Scholar]
- 42.Kou L., et al. , Diversity-decomposition relationships in forests worldwide. eLife 9, e55813 (2020). [DOI] [PMC free article] [PubMed] [Google Scholar]
- 43.Parton W., et al. , Global-scale similarities in nitrogen release patterns during long-term decomposition. Science 315, 361–364 (2007). [DOI] [PubMed] [Google Scholar]
- 44.Loreau M., Hector A., Partitioning selection and complementarity in biodiversity experiments. Nature 412, 72–76 (2001). [DOI] [PubMed] [Google Scholar]
- 45.Grossman J. J., Cavender-Bares J., Hobbie S. E., Functional diversity of leaf litter mixtures slows decomposition of labile but not recalcitrant carbon over two years. Ecol. Monographs 90, e01407 (2020). [Google Scholar]
- 46.Wardle D. A., The influence of biotic interactions on soil biodiversity. Ecol. Lett. 9, 870–886 (2006). [DOI] [PubMed] [Google Scholar]
- 47.Santonja M., et al. , Plant litter diversity increases microbial abundance, fungal diversity, and carbon and nitrogen cycling in a Mediterranean shrubland. Soil Biol. Biochem. 111, 124–134 (2017). [Google Scholar]
- 48.Ganault P., et al. , Relative importance of tree species richness, tree functional type, and microenvironment for soil macrofauna communities in European forests. Oecologia 196, 455–468 (2021). [DOI] [PubMed] [Google Scholar]
- 49.Zhang Y., Peng S., Chen X., Chen H. Y., Plant diversity increases the abundance and diversity of soil fauna: A meta-analysis. Geoderma 411, 115694 (2022). [Google Scholar]
- 50.David J.-F., et al. , Influence of tree species richness and identity on saprophagous macroarthropod abundance and species richness in some European forest types. Forest Ecol. Manag. 534, 120862 (2023). [Google Scholar]
- 51.Reich P. B., et al. , Even modest climate change may lead to major transitions in boreal forests. Nature 608, 540–545 (2022). [DOI] [PubMed] [Google Scholar]
- 52.Zheng J.-Q., et al. , Effects of nitrogen deposition and drought on litter decomposition in a temperate forest. J. Beijing Forestry Univ. 38, 21–28 (2016). [Google Scholar]
- 53.Lu H., et al. , Experimental throughfall reduction barely affects soil carbon dynamics in a warm-temperate oak forest, central China. Sci. Rep. 7, 1–10 (2017). [DOI] [PMC free article] [PubMed] [Google Scholar]
- 54.Wu X.-P., Liu S., Luan J., Wang Y., Cai C., Responses of water use in Moso bamboo (Phyllostachys heterocycla) culms of different developmental stages to manipulative drought. Forest Ecosyst. 6, 31 (2019). [Google Scholar]
- 55.Yang Y. J., et al. , Reduction in throughfall reduces soil aggregate stability in two subtropical plantations. Eur. J. Soil Sci. 70, 301–310 (2019). [Google Scholar]
- 56.Zhang X., et al. , Effects of continuous drought stress on soil respiration in a tropical rainforest in southwest China. Plant Soil 394, 343–353 (2015). [Google Scholar]
- 57.Hedges L. V., Gurevitch J., Curtis P. S., The meta-analysis of response ratios in experimental ecology. Ecology 80, 1150–1156 (1999). [Google Scholar]
- 58.Gurevitch J., Curtis P. S., Jones M. H., Meta-analysis in ecology. Adv. Ecol. Res. 32, 199–247 (2001). [Google Scholar]
- 59.Luan J., et al. , Data for “Biodiversity mitigates drought effects in the decomposer system across biomes.” Dryad. 10.5061/dryad.d2547d88p. [DOI] [PMC free article] [PubMed]
Associated Data
This section collects any data citations, data availability statements, or supplementary materials included in this article.
Supplementary Materials
Appendix 01 (PDF)
Data Availability Statement
Our derived data are provided in SI Appendix, Tables S1–S7. All raw data have been deposited in Dryad (59).