

Significance
In this article, we introduce a concept that we name the “mosaic molecular clock.” We propose to leverage previous observations that bacterial genomes have a mosaic structure to estimate time divergences between pairs of bacteria. We show that the length distribution of exact sequence matches observed in whole-genome alignments of two bacterial species directly reflects their mosaic structure. We use this result to efficiently separate sequence similarities inherited from their common ancestors from those acquired via horizontal gene transfer. Based on this observation, we develop a mathematical framework to accurately calibrate bacterial phylogeny using solely genomic data, resolving a long-standing challenge in microbial genomics.
Keywords: bacterial evolution, molecular clock, mutation rate, maximal exact matches, horizontal gene transfer
Abstract
The chronology and phylogeny of bacterial evolution are difficult to reconstruct due to a scarce fossil record. The analysis of bacterial genomes remains challenging because of large sequence divergence, the plasticity of bacterial genomes due to frequent gene loss, horizontal gene transfer, and differences in selective pressure from one locus to another. Therefore, taking advantage of the rich and rapidly accumulating genomic data requires accurate modeling of genome evolution. An important technical consideration is that loci with high effective mutation rates may diverge beyond the detection limit of the alignment algorithms used, biasing the genome-wide divergence estimates toward smaller divergences. In this article, we propose a novel method to gain insight into bacterial evolution based on statistical properties of genome comparisons. We find that the length distribution of sequence matches is shaped by the effective mutation rates of different loci, by the horizontal transfers, and by the aligner sensitivity. Based on these inputs, we build a model and show that it accounts for the empirically observed distributions, taking the Enterobacteriaceae family as an example. Our method allows to distinguish segments of vertical and horizontal origins and to estimate the time divergence and exchange rate between any pair of taxa from genome-wide alignments. Based on the estimated time divergences, we construct a time-calibrated phylogenetic tree to demonstrate the accuracy of the method.
Reconstructing bacterial evolution is a challenging task. In contrast to multicellular organisms for which an abundant fossil record helps to date events on phylogenetic trees, bacteria leave very little trace of their existence (1). Despite the accumulation of genomic data in the last decades, divergence times of many bacterial taxa are yet to be reliably estimated. Such estimates may be very useful, especially when combined with host, habitat, or ecosystem data (2). Methods to estimate time divergences from genomic data rely on the “molecular clock” assumption (3–6), but applying it to date bacterial diversification events is often difficult. In particular, it is necessary to determine the rate at which nucleotides mutate over time, i.e., the speed at which the clock “ticks.” However, this effective mutation rate does not only depend on the background point mutation rate (associated with replication errors and repair) and on the generation time of the bacterium (7, 8) but also on different ecological parameters (9, 10), location along the chromosome (11–13), activity of nucleoid-associated proteins (14), fitness effects of the mutations (15–17) and other factors. All this, being difficult to assess in practice, prevents an accurate estimation of divergence times. Furthermore, the molecular clock is also obfuscated by horizontal gene transfers, especially when the clock is applied on a small number of genes (e.g., slow-evolving rRNA genes) (18–22), and some of those genes have taken part in horizontal transfer (23–27). Finally, loci with high effective mutation rates diverge rapidly such that alignment algorithms do not detect such homologous loci in distant bacteria. As a consequence, these regions are not considered in divergence time estimation, resulting in information loss and in biased divergence time estimates.
While the phylogenetic relationships between species can usually be inferred using the molecular clock, we lack reliable and scalable methods to infer the branching times on phylogenetic trees. Namely, for bacteria, the molecular clock cannot be satisfactorily calibrated in contrast to multicellular organisms (28): One has to relate to ecological events at known times to specific points in the phylogenetic tree (29), for instance, linking the evolution of bacteria and their hosts (30), see also ref. 6. However, this approach often leads to orders of magnitude discrepancies between estimates of the mutation rate on different timescales (6, 28, 31, 32). Such discrepancies led to the hypothesis of time-dependent mutation rate (33–36) and corresponding relaxed molecular clock models (37). Relaxed molecular clock models, however, require to fit many free parameters, which can be problematic when there is only limited amount of data available. Moreover, these models are mostly applied to a small number of marker genes such that large parts of the genomes are not considered in the time divergence estimations, discarding potentially useful information.
In sum, evolutionary reconstruction in bacteria is particularly difficult due to the mosaic structure of genomes: Different loci evolve with different effective mutation rates, while some loci are acquired via horizontal gene or allele transfer. The mosaic structure of bacterial genomes can be directly observed in the alignment of two bacterial genomes: The mutation densities significantly vary along the alignment from one locus to another (see SI Appendix, Figs. S1 and S2, for the example of the E. coli vs. S. enterica comparison). Here, we develop an approach that takes into account this mosaic structure to estimate time divergences between bacterial species. We do so by modeling the number of exact matches in alignments of pairs of genomes. In particular, we show that studying the distribution of exact matches allows to accurately distinguish homologous regions which have been vertically inherited from a common ancestor from those which have been acquired by horizontal transfer. Modeling match length distributions (MLDs) from the vertical part, we further demonstrate that time divergences between two species can be estimated directly from the MLD, using only a few simple assumptions on the mutation rate distribution. Predictions of the model, e.g., the total homologous region length, average similarity, and other statistical properties, agree well with the empirical results for taxa pairs over a wide range of time divergences.
The Model and Its Analytical Solution
The main goal of our study is to fit the length distribution of exact matches of pairwise whole-genome alignments of bacteria to estimate their time divergence. To do so, it is necessary to model the mosaic structure of bacterial genomes and their evolutionary dynamics.
The Mosaic Molecular Clock Model.
The main assumption of our model is that bacterial genomes have a mosaic structure, that is, each locus mutates with a different effective mutation rate and is inherited vertically. We refer to this part of the genome as vertical. By the “effective” mutation rate, we mean the rate of mutation and its fixation in the population. In addition, a taxa pair exchanges random loci via horizontal transfer with rate per base pair and per year. The part of the genome that comprises such loci is denoted as horizontal. One can see a schematic illustration of the model in Fig. 1A. Below we describe in more details our assumptions about the effective mutation rate distribution and how we model the detection limit of the aligner. All the definitions used in the model are summarized in SI Appendix, section A.
Fig. 1.
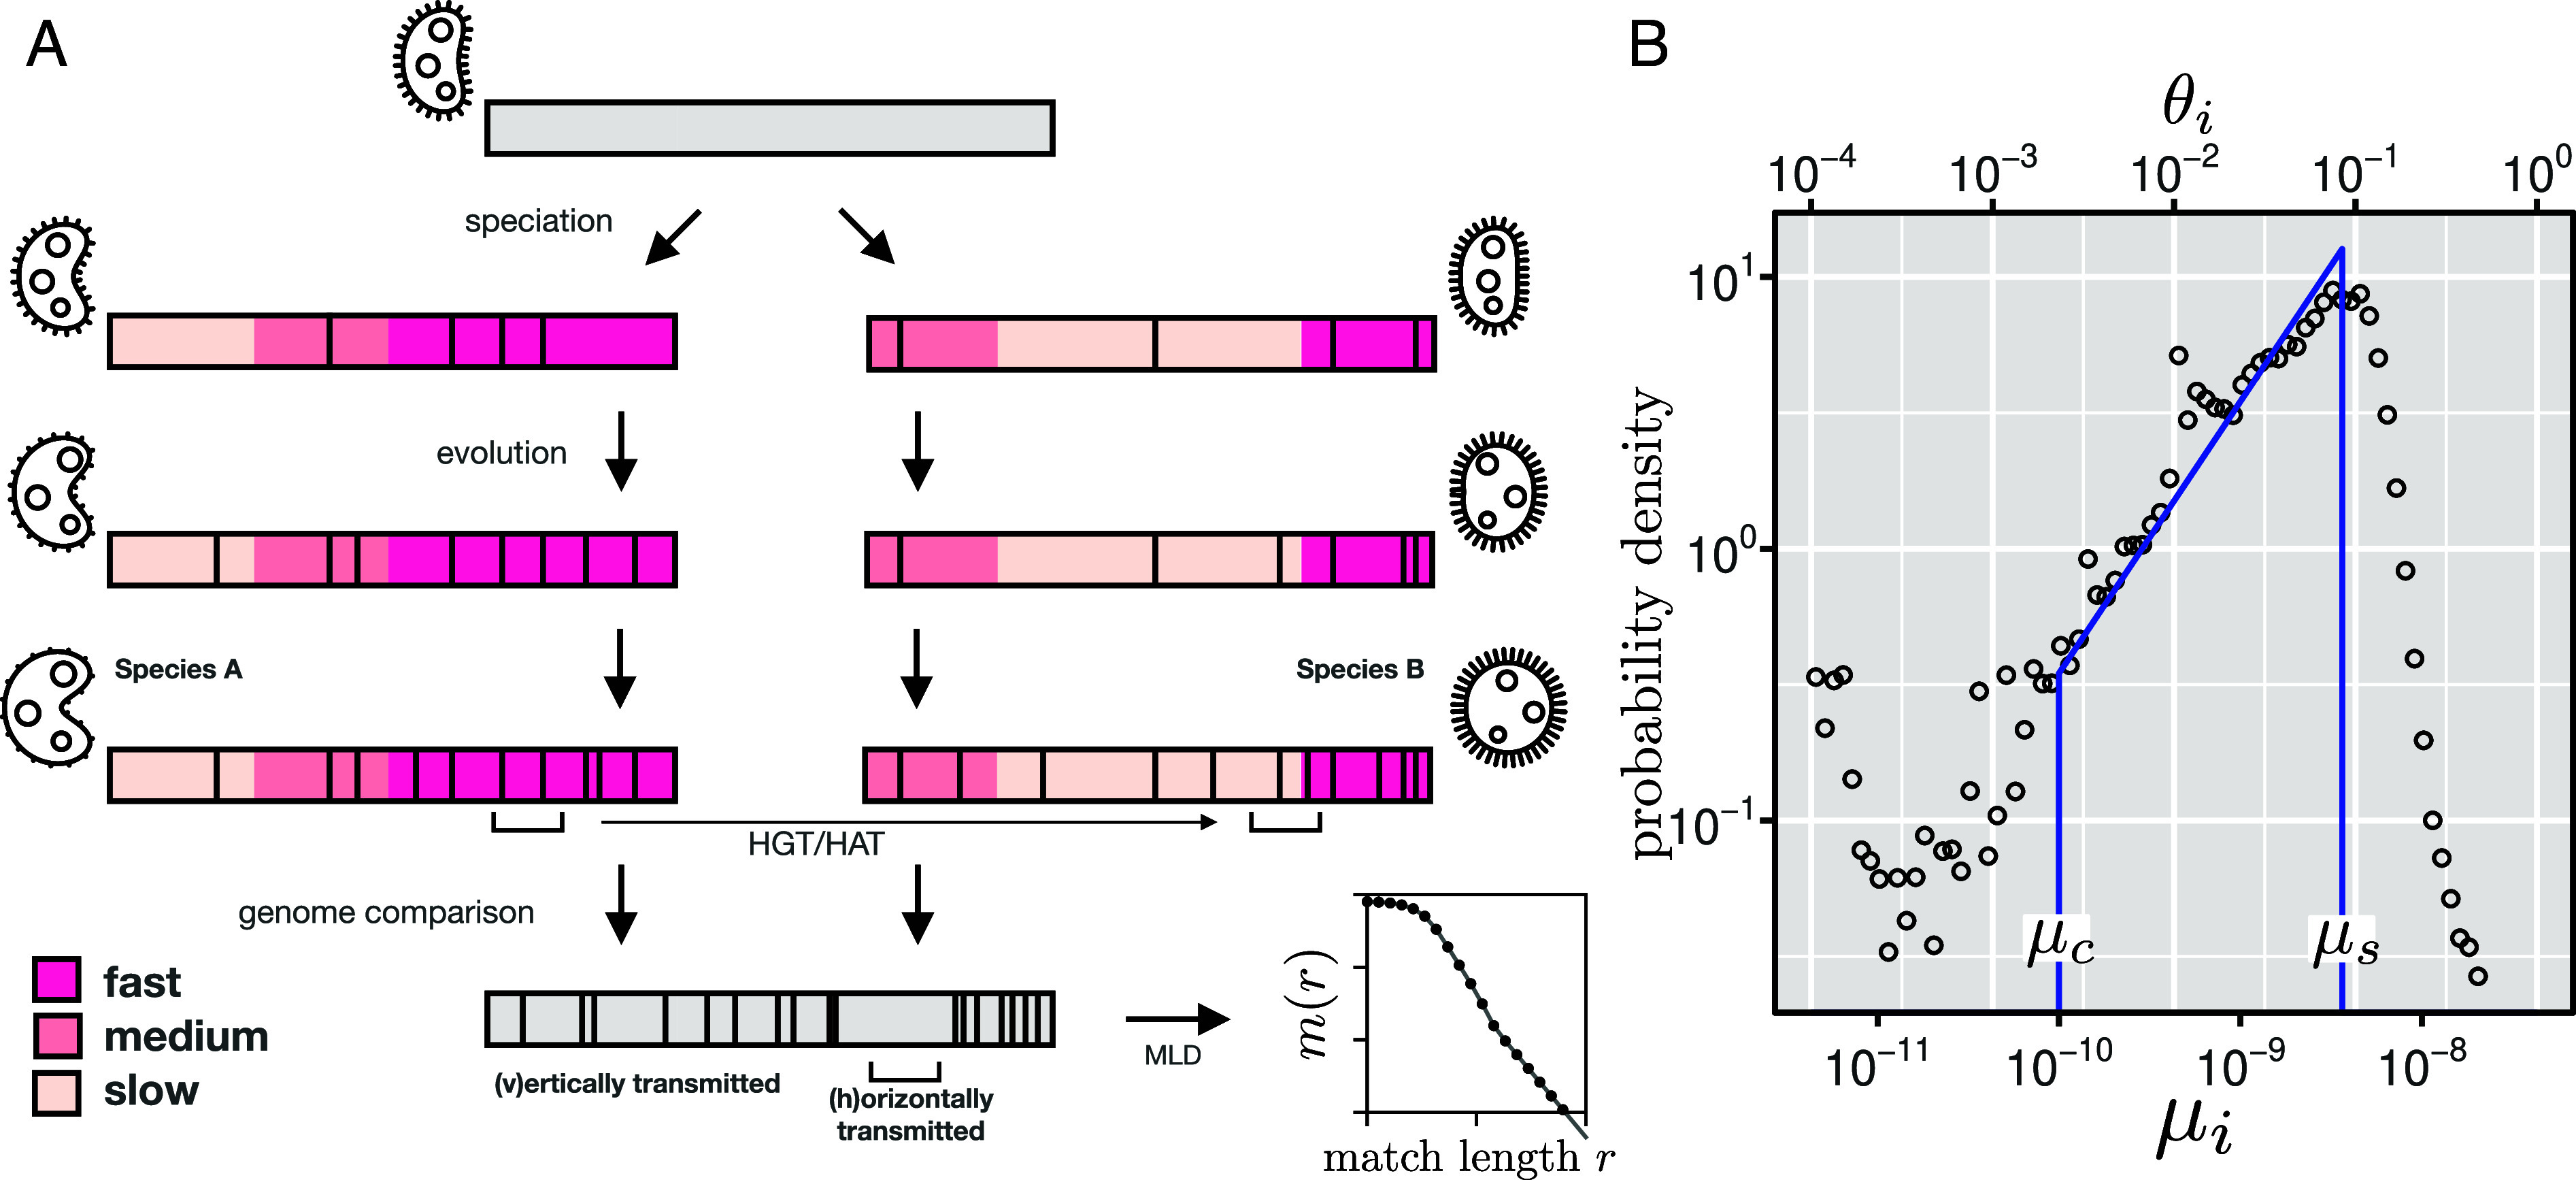
(A) Illustration of the model for the evolution of two taxa A and B. After speciation, different loci evolve with different effective mutation rates along their genomes (as indicated by the background color) and independently accumulate mutations over time (as indicated by black vertical lines). In addition to vertical evolution, loci are also transferred horizontally, resulting in shared mutations in both taxa. When comparing the genomes of both taxa, the number of accumulated mutations will vary between loci due to species-specific differences in mutation rates. In addition, horizontally transferred segments will show fewer differences than vertically transferred segments since some of their mutations are shared. (B) Distribution of genetic divergences obtained from segmented alignments of E. coli vs. E. albertii (circles). The distribution of the average mutation rate was obtained using with , as obtained in further analyses (Fig. 2A). The uptick of the distribution for small values of and is generated by recent HGT events (SI Appendix, section C.1). The solid line represents the assumed distribution of mutation rate, Eq. 1 with (29) and (38).
Mutation Rate Distribution.
In our model, the mutation rates are distributed between two values: The smallest one, , corresponds to the mutation rate of the most conserved regions, like rRNA genes, while the largest one, , corresponds to the spontaneous background point mutation rate. In this study, we consider and as fixed parameters and use the value estimated in the literature, i.e., per bp and year (29) and per bp and year (38). The mutation rate distribution is a crucial ingredient in the model that we infer using a combination of analytical arguments and empirical evidence.
Consider a homologous locus of length in two bacterial taxa A and B. The genomic divergence between the two bacteria along this locus is given by (in the regime), where is the average of the two effective mutation rates, and , at this locus for these two lineages, and is the time divergence between the two taxa (twice the time to their last common ancestor). We assume that for all loci , the mutation rates and in two bacterial lineages and are not correlated. Following this assumption, it can be demonstrated that the distribution of scales linearly for small values (39, 40) (SI Appendix, section B). It follows that the divergences of different loci (in the vertical part of the genome) follow the same linear distribution. We observe this linear regime empirically, as shown in Fig. 1B (see also SI Appendix, section C for additional examples). In sum, our assumption for the distribution of the effective mutation rate is given by
| [1] |
Further on, we omit the locus index to simplify the notation.
Alignment Software Detection Limit.
To accurately compute the MLD from the whole-genome alignment of a pair of bacteria, it is further required to take into account the alignment software detection limit. The ability of an alignment software to detect homology depends on the properties of the alignment algorithm used and on the properties of the considered sequences. Here, we summarize the properties of the aligner into one effective parameter , assuming that an aligner can detect homologous sequences as long as their divergence is smaller than a threshold . We will discuss the validity of this assumption and estimate below in Numerical Validation. The dependence of on the length is much weaker and is ignored. This aligner detection limit affects the analysis of vertical and horizontal parts of the genome in different ways.
If a given locus in the vertical part of the genome mutates with a mutation rate and the time divergence of this locus is , it is detected as homologous if and only if . Defining as the mutation rate of the least conserved vertical alignable region, for , we have . For , no homology of the vertical part of the genome can be detected. Therefore, in the following derivations for the vertical part, the upper limit of the integration over is , which is equal to only for . The same reasoning applies to the horizontal part, only with different values for the time divergence. In contrast to the vertical part where the time divergence is the same for all loci, in the horizontal part, time divergences vary from one locus to another because sequences have been transferred at different time points in history.
Analytical Solution.
How to relate the model to genomic data?
Inferring the parameters of our model from empirical genomic data is challenging. This is due to the fact that unlike artificial mosaics, the boundaries of the constituent pieces are not well recognizable and the pieces are often too small to be analyzed thoroughly and even identified. Here, we briefly discuss the validation procedure of our model using empirical data and demonstrate how to relate to an easily accessible empirical quantity.
To take into account the mosaic structure of the genomes, we consider a combination of clocks, one per locus—each clock ticking at a different pace due to the different mutation rates. In addition, some loci may also have undergone horizontal gene transfer and thus vary in their divergence times. In this paper, we combine these different molecular clocks into one “mosaic molecular clock.”
In practice, the mosaic structure of the genomes we study is not known a priori, that is, one has to infer the regions with constant mutation densities. To this end, we developed a simple method called segmut to partition the genomes into regions with constant mismatch densities using a approach (Materials and Methods, Fig. 1B and SI Appendix, Figs. S2 and S3). This method has several drawbacks since it is computationally intensive, and the results are difficult to verify on empirical data. To circumvent this difficulty, we decided to use another approach that was already efficiently applied in different contexts (refs. 39–43). The main idea, we employ here, is to study the length distribution of maximal exact matches between homologous sequences. Indeed, one can show (44), using the result derived in ref. 45 that studying match length distribution (MLD) allows to assess time divergence between DNA sequences. Namely, for a given and between two loci of length , the expected number of their exact sequence matches, , is given by
| [2] |
Therefore, if the mutation rate follows a certain distribution , the MLD for two genomes of length is given by
| [3] |
We note that the integral above can be represented as a Laplace transformation: , where is the Laplace transform of . Hence, there is a direct relationship between the MLD and the Laplace transform of the mutation rate distribution. As a consequence, studying —a quantity that can be easily computed for empirical data—allows reconstructing the evolutionary history of the genomes, in particular their mutation rate distribution. Below we further consider that is also distributed along genomes due to horizontal transfers, but the principle is the same: The distribution is easy to compute empirically, easy to calculate analytically, and contains information about the distributions of and . In SI Appendix, section D, we demonstrate the consistency between the genome segmentation results and the MLD.
In the following, we use our model to calculate analytically the MLD, compare it to the empirical one, and infer the model parameters and for all considered pairs of taxa. To simplify the analysis, below we consider separately the MLD from the vertical part of the genome, , and the MLD of the horizontally transferred part, . In the next section, we calculate analytically the shape of the MLD of the vertical and horizontal parts of the genomes. More detailed calculation can be found in SI Appendix, section E.
The vertically transferred part.
The MLD from the -detectable vertical part of the genome (homologous loci with , such that their divergences are smaller than ) with time divergence , using Eq. 1, is given by
| [4] |
One can see that the tail of the MLD from the vertical part scales as , as previously observed in eukaryotes (39, 40).
The total length of the -detectable homologous vertical part of the genome decreases with increasing time divergence and is given by
| [5] |
Along the vertical region with this length, the average divergence is given by
| [6] |
See SI Appendix, section E.3, for representative plots of these functions.
The horizontally transferred part.
Assuming that only a small fraction of the genome has been transferred (i.e., ), the MLD from the -detectable horizontal part of the genome can be written as
| [7] |
One can see that the tail of the MLD from the horizontally transferred part scales as , as was also derived and shown empirically in ref. 43.
In the same regime, the total length of the -detectable homologous part of the genome due to HGT is given by
| [8] |
Along the horizontally transferred region with this length the average divergence is given by
| [9] |
The total match length distribution.
Assuming that the total contribution of the homologous part due to HGT is much smaller than the contribution from the vertical part (i.e., , otherwise, the MLD is fully determined by the contribution from the horizontal part, as in ref. 43), the total MLD is given by
| [10] |
where and are given by Eqs. 4 and 7. The total -detectable homologous length is given by
| [11] |
where and are given by Eqs. 5 and 8. The average divergence is given by
| [12] |
where and are given by Eqs. 6 and 9.
Eqs. 10–12 are the main analytical results of the article, and we use them in the following to validate the model and to fit the parameters and for different pairs of taxa using Eq. 10, while we estimate the value of using numerical simulation.
Numerical validation.
To test our theory and estimate , we simulated the evolution of taxa under the assumptions of the model (Fig. 1A and Materials and Methods): Each locus mutates with a certain rate, distributed as Eq. 1, and horizontal transfer of loci occurs with rate . We aligned sequences obtained in these simulations using the nucmer software (46) with default parameters. Fitting all resulting MLDs with as a free parameter, we find that for the used aligner, results in good fits (SI Appendix, Fig. S4). Applying segmut to the alignments of the simulated sequences, we obtain distributions of mutation rates and divergences similar to the empirical ones (SI Appendix, Fig. S5). Using , we were able to fit the numerical MLDs, and to accurately estimate both the divergence times and the horizontal transfer rates values used to simulate the sequences, demonstrating the consistency of our approach (SI Appendix, Fig. S6). These results demonstrate that our method allows to reconstruct the evolutionary history of a taxa from genomic data. In the following, analyzing empirical data, we use , assuming that is the property of the aligner and does not depend strongly on the analyzed sequences.
Empirical Validation
Fitting the Two Regimes of the MLD.
To test our model on empirical data we downloaded 5,149 fully assembled genomes from 11 taxa of the Enterobacteriaceae family, as well as 759 genomes from two outgroups: Serratia and Vibrio genera (see SI Appendix, Table 1 for details). For each taxa pair, we computed the total MLD resulting from the whole-genome comparisons of all genomes of taxon 1 vs. all genomes of taxon 2 (normalized by the number of comparisons, see Materials and Methods). Obtained MLDs exhibit two different regimes, corresponding to short and long matches, in good agreements with the prediction of our model (see Fig. 2 for a few examples and SI Appendix, SI-ExtendedFigures.pdf for all taxa pairs).
Fig. 2.

Match length distributions of nine selected pairs of taxa in panels (A–I). Names of the taxa are indicated in the Bottom-Left corner of the panels. The numbers in the brackets indicate the number of genomes, and is the average divergence between the genomes of the two taxa. The empirical data (dots) are fitted with Eq. 10 (black solid lines) using the global parameters , , and . The values of and are fitted for each pair separately and are shown in the Top-Right corner. Using the obtained parameters, the vertical and the horizontal parts of the match length distributions are plotted using Eq. 4 (blue lines) and Eq. 7 (red lines), respectively.
Short matches follow a power-law with a exponent, as expected for the matches from the vertical part Eq. 4, while long matches are distributed according to a power-law, as predicted for horizontally transferred loci Eq. 7. The location of the transition between the two regimes depends on the time divergence between the taxa: The closer the two taxa are, the longer the matches of the vertical part. Analytical prediction for the combination of the vertically and horizontally transferred part from Eq. 10 fits well the empirical data for almost all taxa pairs. When many pairs of genomes are available for a taxa pair, our method has good statistical power, allowing to clearly separate the and regimes and to accurately estimate the values of and . Interestingly, estimating with only few or even one genome per taxon also results in good estimates (SI Appendix, section F.3).
Model Setbacks.
Our model failed to estimate the time divergence for two specific taxa pairs: 1. E. coli vs. E. fergusonii and 2. E. asburiae vs. E. hormaechei. In SI Appendix, Fig. S7, one can see the reason for this: The MLD of the first pair has a regime in the vertical part, implying that Eq. 1 is not valid and suggesting instead for this pair. One can observe similar behaviors for another closely related pair E. coli vs. E. albertii in Fig. 2A (for this pair, the time divergence estimate is nevertheless reasonable). For the other pair, E. asburiae vs. E. hormaechei (SI Appendix, Fig. S7B), the rate of horizontal transfer is so high that the horizontally transferred segments dominate over the vertical part. Since the time divergence estimation is based solely on the vertical part, the signal is obfuscated. In fact, this demonstrates another quality of our approach: Studying the MLD shape, one can easily diagnose pairs for which the assumptions of the model are not fulfilled, and therefore, the parameter estimation fails.
The Estimated Parameters Exhibit Predicted Trends.
Our model makes several predictions regarding the estimated parameters and their relationships. First, the model predicts that the total length of the homologous regions of the genomes of two taxa depends on their time divergence. For small time divergences, the full genome can be aligned, and after a certain time threshold (i.e., ), decreases with the divergence time as Eq. 5 and SI Appendix, section E.3. Indeed, this relationship is well reproduced on empirical data as shown in Fig. 3A. Our model further predicts that the average divergence between the two genomes depends on the time divergence in a nontrivial fashion Eq. 6 and SI Appendix, section E.3. As predicted, we observe on empirical data that the average genome-wide divergence scales linearly for closely related species, reaches of the aligner detection limit for , and then grows very slowly with (Fig. 3B). Finally, we find that the rate of horizontal transfer, , as presented in Fig. 3C, can vary by orders of magnitude (ref. 48) and exhibits a clear trend to decay as the divergence time grows, as previously observed (see, e.g., refs. 43, 49–51).
Fig. 3.
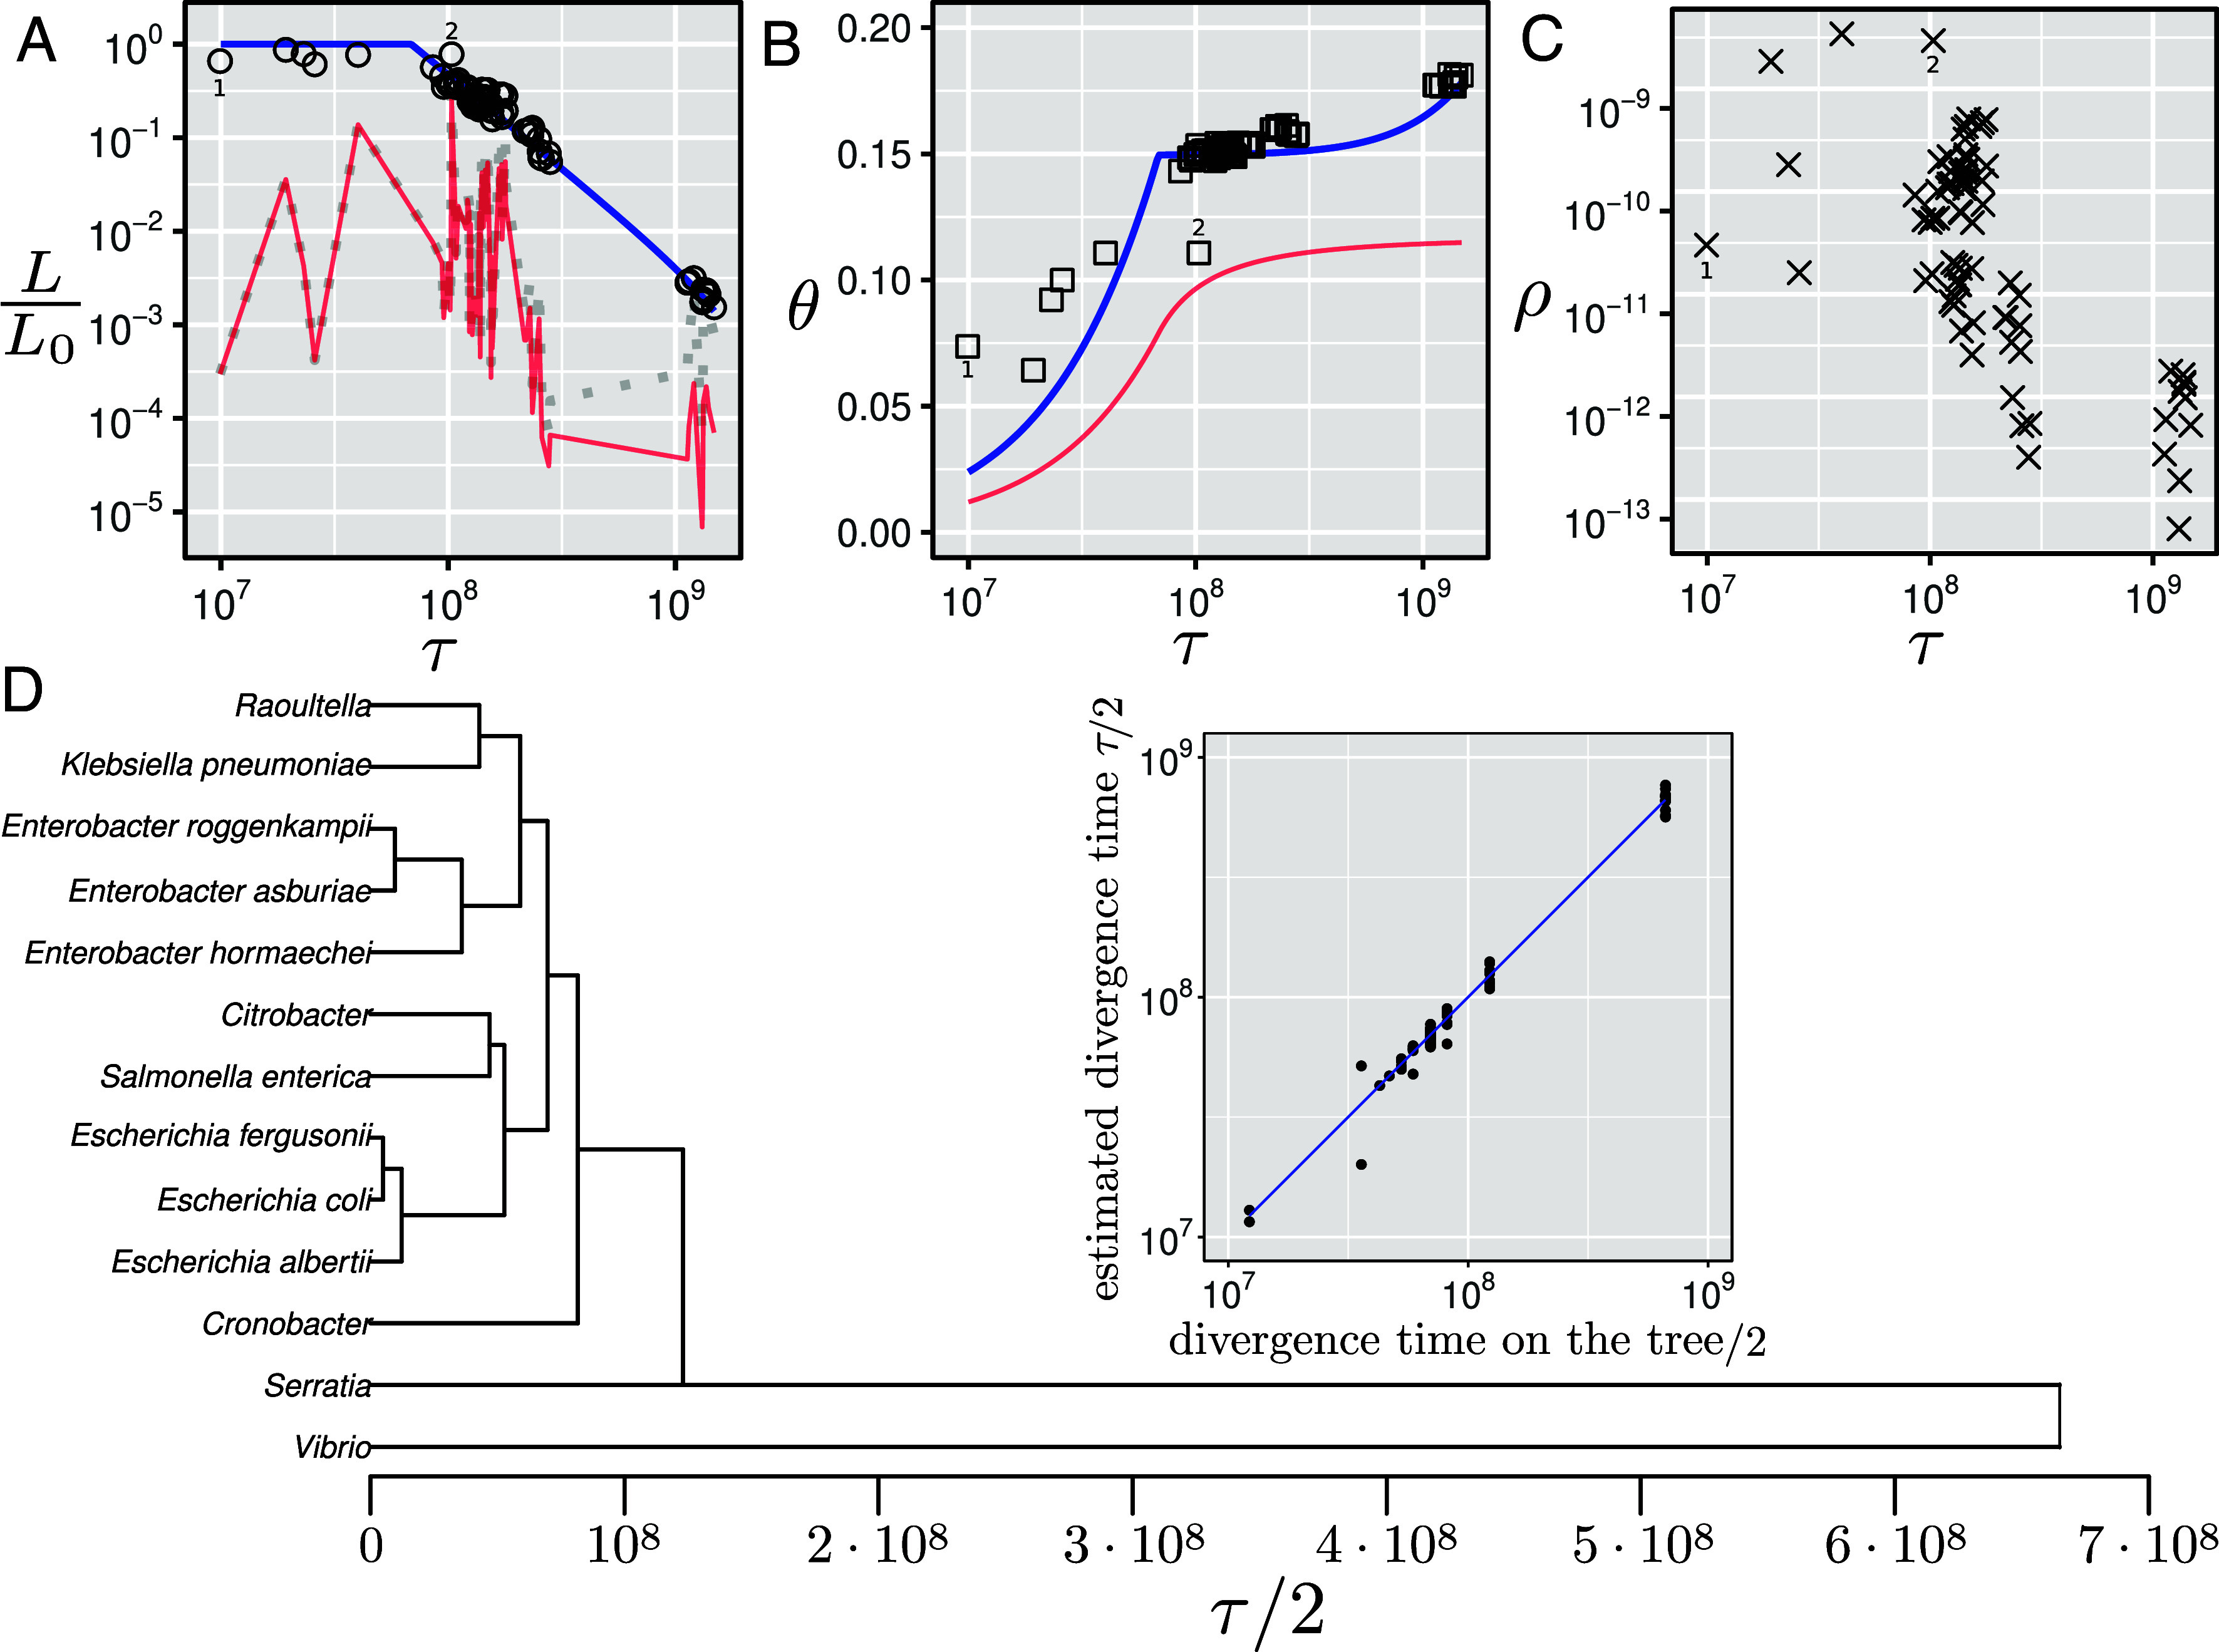
Relationships between the model parameters and the estimated time divergences for species of the Enterobacteriaceae family. (A) Ratio of the detectable homologous length and estimated value of the genome length of the common ancestor for all pairs of taxa as a function of the time divergence between the taxa. The blue line is , the predicted length ratio from the vertical part based on Eq. 5; the red line is , the predicted length ratio from the horizontally transferred and detectable part based on Eq. 8. The dotted gray line represents the full (detectable and nondetectable) length ratio of the horizontally transferred part, given by . The length ratio from both detectable parts (vertically and horizontally transferred) from Eq. 11 is indistinguishable from —the blue line—on this scale for these data. Detailed empirical data for each taxa pair are shown in SI Appendix, Fig. S9. (B) Empirical divergences for all taxa pairs after Jukes–Cantor distance correction (47) vs. fitted time divergence (squares). The blue line represents the predicted divergence along the vertical part Eq. 6, while the red line represents the predicted divergence along the horizontally transferred part Eq. 9. The total predicted divergence given by Eq. 12 is indistinguishable from for these data. Detailed empirical data for each taxa pair are shown in SI Appendix, Fig. S10. (C) Fitted HGT rate as a function of the fitted divergence time for all pairs of taxa. Data points labeled with digits 1 (E. coli vs. E. fergusonii) and 2 (E. asburiae vs. E. hormaechei) are further discussed in the main text, and their MLDs are shown in SI Appendix, Fig. S7. (D) UPGMA tree constructed using the estimated pairwise time distances . The inset plot compares the time distances on the resulting ultrametric tree with the estimated values (on a double-logarithmic scale).
Phylogenetic Analyses.
We next investigated whether the estimated divergence times were coherent and compatible. To do so, we computed a phylogenetic tree from our time estimates, forcing the ultrametricity of the tree (Materials and Methods). The resulting tree is shown in Fig. 3D. In the Inset of the figure, one can see that the pairwise distances in the obtained tree follow closely the estimated values. This result shows that our estimated time divergences have an inherent ultrametric structure, demonstrating that all considered lineages have similar mutation rate distributions. Moreover, the topology of the tree reproduces well what is expected based on the literature: For instance, Klebsiella pneumoniae is closely related to Raoultela (52), and S. enterica is closely related to Citrobacter (53).
In contrast, using a simple, nonmosaic molecular clock assumption, the topology of the tree and the value of the time estimates would be very different (SI Appendix, Fig. S8). Indeed, because segments with high divergence are not identified by the alignment software, the estimated divergence is greatly underestimated for distant pairs, and the resulting tree would have an unresolved star-like structure.
Discussion and Summary
In this paper, we studied the statistical properties of similarities between bacterial genomes. Those similarities are shaped by mutations, horizontal transfer of genes/alleles, gene losses, and selection during their evolution since their last common ancestor. In practice, the observed similarities are also shaped by the sensitivity of the used aligner: If two loci are too distant, the aligner cannot detect their homology, and such loci are disregarded. In this case, only more conserved loci (or recently transferred ones) are detected by the aligner, making the bacterial genomes appear more similar than they really are.
We combined all these factors and propose a mathematical framework to model and assess their contributions. We show that the analysis of match length distributions is a powerful tool that allows to uncover details of bacterial evolution. In our model, mutations are assumed to occur randomly, breaking long matches to shorter ones. Different loci mutate with different effective rates, , depending on their associated selective pressure. On the other hand, horizontal transfers between two genomes generate long matches with a given rate . Gene losses reduce the total length of homologous loci, scaling down the MLD prefactor . The sensitivity of the aligner is modeled by considering only homologous loci with an average divergence lower than a threshold .
By explicitly modeling the distribution of mutation rates along genomes, we can resolve the long-standing discrepancy between the mutation rate measured in short time-scale experiments and the one inferred from distant bacteria on the evolutionary time scales without the ad hoc assumption of time-dependent mutation rate. Indeed, our framework makes it possible to estimate the time divergence between bacterial species as well as their HGT rate using whole-genome sequence alignment alone. In our framework, reliable estimate of the HGT rate requires the comparison of many sequenced genomes. In contrast, by using whole-genome alignments, we can robustly estimate the time divergence between two taxa from a single comparison in most cases (SI Appendix, sections F.2 and F.3) such that our method could be applied even to species with few genomes available.
Selective Pressure and Distribution of Effective Mutation Rates.
The distribution of mutation rates along genomes reflects the variation of selective pressure. The selective pressure on a locus is affected by the fitness effect of a mutation at this locus and by the effective population size of the taxon (54, 55). The distribution of fitness effects can in principle be assessed (16), but these methods require in general to conduct complex experiments in controlled environments. In contrast, in this study, we directly model the mosaic distribution of effective mutation rates under simple assumptions.
If mutation rates along different lineages are not correlated, one expects that the mean effective mutation rates are linearly distributed Eq. 1 (39, 40). The validity of the no-correlation assumption is not obvious—More conserved loci in one lineage are expected to tend to be more conserved in another lineage. In this case, we would expect a different MLD shape SI Appendix, section B.
In fact, this linear behavior is not unique to bacteria, and the same principles also apply to eukaryotic genomes: Eukaryotes also have mosaic genomes with a distribution of mutation rates, the main difference being that horizontal transfer in eukaryotes is much rarer than in prokaryotes (56). Applying our method to the comparison of a few vertebrate genomes, we find that the resulting MLDs could be fitted with only the vertical part (see SI Appendix, Fig. S11 and refs. 39, 40, 57, 58).
Here, we propose a very simple model to explain the linear distribution of mutation rates. There might be other (more complex) models which lead to the same linear distribution of effective mutation rates that we observe empirically both in bacteria and vertebrates.
HGT Detection Based on MLD.
Detection of horizontal transfer of a locus is often based on its high similarity in two organisms, much higher than one would expect due to conservation (59). Long (almost) exact matches are often interpreted as horizontal transfers, (43, 50, 60, 61). However, in the absence of a model, it is not clear what is the threshold that discriminates horizontally transferred and well-conserved sequences, leading to false-negative or false-positive detection errors (62). Detailed analysis of the MLD can help to minimize those errors: The presence of two clear regimes in the MLD suggests that sequences with exact matches shorter than the cross-over between the two regimes are conserved, while longer ones most probably have been horizontally transferred. This way of classifying loci is nonparametric and can be applied to all pairs of taxa, which exhibit MLDs with two clear regimes.
Since the model proposed here clearly disentangles conservation and horizontal transfers, our estimate of horizontal transfer rates is expected to be more accurate than the one found in previous studies. Our results confirm that the rate decreases with the divergence time, as previously observed (43, 48–51). Note that in this study we filtered out plasmid sequences so that the estimated horizontal transfer rates are related only to the chromosomal part of the genome.
Phylogenetic Analysis.
Using the presented approach, we built an ultrametric tree of the Enterobacteriaceae family with Serratia and Vibrio as outgroups (Fig. 3D). Topologically, the tree reproduces known phylogenetic relationships.
While these relationships can also be found on a tree constructed using the average genome-wide divergences (SI Appendix, Fig. S8), we emphasize that this tree is not topologically identical to the one built using our method. For instance, the average divergence tree suggests that Salmonella is closer to Klebsiella () than to Escherichia (). The tree based on the time divergences estimated using our method suggests the opposite ( and , respectively), in agreement with the 16S rRNA result (63, 64) although 16S rRNA phylogeny cannot be taken as a ground truth (27, 65).
Overall, for closely related taxa where the molecular clock still holds, the two methods yield very similar trees. In contrast, for distantly related taxa where many homologous sequences are too divergent to be detected by the aligner, the branch lengths estimated by our method are very different from those found by the average divergence method. As a consequence, the average divergence tree has a star-like shape, while our method can better resolve deep branching patterns.
Interestingly, we estimate that Escherichia and Salmonella branched y ago. This is smaller than the currently accepted estimate of y based on the appearance of mammals (29). This suggests that our assumptions about the values of the mutation rates and are higher than the real ones or that the branching of the two taxa occurred significantly after the appearance of mammals.
Model Setbacks.
For two taxa pairs (labeled as 1 and 2 in Fig. 3 and SI Appendix, Fig. S7), the time divergence estimates are not accurate. Possible reasons for this may be that the recombination rate between the two species is so high that the vast majority of the observed matches result from horizontally transferred loci rather than from evolutionary conserved ones, such that one cannot reliably estimate the time divergence using our approach. Another possible reason might be that the mutation rate distribution does not follow the linear distribution assumed in our model. Although the assumption of linear mutation rate distribution is very general and is fulfilled in most cases, it might be violated for closely related pairs in at least two scenarios: i) if the effective mutation rates of the homologous loci are well correlated or ii) if mutations occur mostly at loci with high effective mutation rates for which the asymptotic scaling considerations in Mutation Rate Distribution do not apply.
Improvement of the Method.
To resolve the described limitations of our model, several research avenues could be explored. First, for simplicity, in this article, we used a strict molecular clock, meaning that the mutation rate distribution is the same along all branches, and we assumed that the mutation rate varies only along the genome in a mosaic form. The presented approach could further be extended, relaxing the clock also along the lineages. Another potential theoretical extension of our model would be to relax the assumption about the independence of the mutation rates in two taxa. As we show in SI Appendix, section B.3, correlated mutation rates would lead to a power-law tail in the vertical part with a different exponent, which, in principle, can be taken as another fitting parameter. Note, however, that the current model results in good fits for many pairs of species and its simplicity makes it very easy to apply in practice. The proposed extensions have the potential to improve the quality of the parameter estimations, but would come at the cost of more ad hoc assumptions and a larger number of free parameters to fit.
On the technical side, in this paper, we used the nucmer software to construct all alignments because this method is computationally very efficient. However, our framework could easily be adapted to other algorithms with improved sensitivity, e.g., lastz (66) to align more distantly related genomes and measure horizontal transfer rates and time divergences. The exact same theoretical framework could be used, just changing the effective parameter to account for the difference in sensitivity.
Summary.
We demonstrated that a method embracing the complex mosaic structure of bacterial genomes and explicitly accounting for the technical limitations of sequence homology detection can improve the estimation of deep phylogenetic branches and their timing. The main advantage of our method is that it can leverage genome-wide alignment data, resulting in robust time divergence estimates that are not dependent on a few specific marker genes. Our results have implications that go beyond bacterial evolution as we have shown that our model applies to the mosaic structure of many more genomes, including vertebrates.
Materials and Methods
Throughout this article, the time () units are years, length () units are bp, while the rates (mutation and horizontal transfer ) are in units of y−1 bp−1. The used scripts are located on the github repository (67).
Data.
We used taxa from the Enterobacteriaceae family and two outgroups: the Serratia and Vibrio genera. We considered only the chromosomal part of the genome. To filter out plasmids, we used only complete genome and chromosome level assemblies in refseq (68) database using the NCBI (69). Plasmids were filtered based on the header in the fasta files. We considered only species with at least 20 available assemblies. For species with smaller number of full assemblies, we grouped the species to corresponding genera. To mitigate sampling biases, we removed samples obtained from large multi-isolate projects, as they are indicated in the NCBI site.
Aligning the Genomes.
To align pairs of genomes, we used nucmer (46) with the default settings, using only unique matches in both genomes (--mum option). To estimate the divergence, we calculated the number of differences per alignment, normalized by the alignment length. Insertions and deletions were considered as single differences.
Plotting MLDs—Logarithmic Binning.
To plot the MLD, we used a linear 3 bp binning up to 35 bp and logarithmic binning with 10 points per decade for larger matches. Namely, our breaks of the histogram are In the plots, centers of the bins are geometric mean of their boundaries. Within each bin, we count the number of matches and normalize it by the size of the bin. In addition, we normalize the MLD by the total number of alignments we do for the two considered taxa. If we analyze two taxa with and genomes, respectively, we do alignments, collect all the exact matches, and, therefore, divide the total MLD by .
Simulating the Genomes.
To simulate bacterial evolution, we started from the 5,005,213 bp-long E. coli chromosome NZ_CP092647.1 and divided it to segments with different lengths, distributed exponentially with an average of bp. Each segment was evolved with a mutation rate drawn from the uniform distribution between and . We assume that transversions and transitions occur with the same probability and back mutations are allowed. We used this framework to evolve pairs of genomes with a wide range of divergence times, from to . Horizontal transfer is implemented by transferring a random segment of length from one branch to another with rate per bp to mimic the relationship between the horizontal transfer rate and the divergence time observed in real data (Fig. 3C). The HGT rate was assumed to be constant in time from the beginning of the simulation, which does not affect the results significantly because only very recent HGT events contribute to the MLD tail. For each value of , we simulated 12,800 pairs with different random seeds. The resulting sequences were aligned and analyzed using the same procedure used for empirical genomes.
Segmenting the Genomes (Segmut Package).
We segmented the alignments of the bacterial genomes with respect to the density of mutations following the ideas in refs. 70–72, maximizing the statistic of the mutations density of the segments. The developed segmut R package can be found in the github repository (73).
Fitting Procedure.
To fit the empirical MLD using Eq. 10 for each pair of taxa, we used two free parameters: and . Genome length of the common ancestor of the pair of taxa, , is taken as the length of the smallest genome of the pair. The fitting is performed by minimizing the mean square relative difference between the theoretical and the empirical binned MLDs using the Nelder–Mead algorithm (74), see also SI Appendix, section F.1. To find the starting point, we used Harmony Search heuristic (75) with starting points.
Building the Tree.
We build the ultrametric tree using hierarchical clustering of the taxa based on their estimated pairwise time divergences . We use average linkage clustering (hclust function from the stats R package), which is equivalent to the UPGMA method (76). To get the pairwise distances from the resulting tree, we use cophenetic function from the stats R package.
Supplementary Material
Appendix 01 (PDF)
Acknowledgments
We thank M.S. Gelfand, P. Etheimer, and anonymous reviewers for useful comments and discussions. The numeric analysis was carried out using the supercomputer cluster “Afalina” at Sevastopol State University. M.S. work was made within the program “Prioritet-2030” of Sevastopol State University (strategic project No 3, No 121121700318-1).
Author contributions
M.S., P.F.A., and F.M. designed research; M.S. performed research; M.S. analyzed data; and M.S., P.F.A., and F.M. wrote the paper.
Competing interests
The authors declare no competing interest.
Footnotes
This article is a PNAS Direct Submission.
Data, Materials, and Software Availability
Software is available in Github (67) and segmut (73). All other data are included in the manuscript and/or SI Appendix.
Supporting Information
References
- 1.Arning N., Wilson D. J., The past, present and future of ancient bacterial DNA. Microbial. Genom. 6 (2020). [DOI] [PMC free article] [PubMed] [Google Scholar]
- 2.Didelot X., Walker A. S., Peto T. E., Crook D. W., Wilson D. J., Within-host evolution of bacterial pathogens. Nat. Rev. Microbiol. 14, 150–162 (2016). [DOI] [PMC free article] [PubMed] [Google Scholar]
- 3.Zuckerkandl E., Pauling L., Evolutionary divergence and convergence in proteins in Evolving Genes and Proteins, Bryson V., Vogel H. J., Eds. (Academic Press, 1965), pp. 97–166. [Google Scholar]
- 4.Kimura M., Evolutionary rate at the molecular level. Nature 217, 624–626 (1968). [DOI] [PubMed] [Google Scholar]
- 5.Delsuc F., Brinkmann H., Philippe H., Phylogenomics and the reconstruction of the tree of life. Nat. Rev. Genet. 6, 361–375 (2005). [DOI] [PubMed] [Google Scholar]
- 6.Kuo C. H., Ochman H., Inferring clocks when lacking rocks: The variable rates of molecular evolution in bacteria. Biol. Direct 4, 1–10 (2009). [DOI] [PMC free article] [PubMed] [Google Scholar]
- 7.Weller C., Wu M., A generation-time effect on the rate of molecular evolution in bacteria. Evolution 69, 643–652 (2015). [DOI] [PubMed] [Google Scholar]
- 8.Gibson B., Wilson D. J., Feil E., Eyre-Walker A., The distribution of bacterial doubling times in the wild. Proc. R. Soc. B 285, 20180789 (2018). [DOI] [PMC free article] [PubMed] [Google Scholar]
- 9.Bromham L., Why do species vary in their rate of molecular evolution? Biol. Lett. 5, 401–404 (2009). [DOI] [PMC free article] [PubMed] [Google Scholar]
- 10.Lynch M., et al. , Genetic drift, selection and the evolution of the mutation rate. Nat. Rev. Genet. 17, 704–714 (2016). [DOI] [PubMed] [Google Scholar]
- 11.Benzer S., On the topography of the genetic fine structure. Proc. Natl. Acad. Sci. U.S.A. 47, 403–415 (1961). [DOI] [PMC free article] [PubMed] [Google Scholar]
- 12.Hudson R. E., Bergthorsson U., Roth J. R., Ochman H., Effect of chromosome location on bacterial mutation rates. Mol. Biol. Evol. 19, 85–92 (2002). [DOI] [PubMed] [Google Scholar]
- 13.Kivisaar M., Mutation and recombination rates vary across bacterial chromosome. Microorganisms 8, 25 (2019). [DOI] [PMC free article] [PubMed] [Google Scholar]
- 14.Warnecke T., Supek F., Lehner B., Nucleoid-associated proteins affect mutation dynamics in E. coli in a growth phase-specific manner. PLoS Comput. Biol. 8, e1002846 (2012). [DOI] [PMC free article] [PubMed] [Google Scholar]
- 15.Nei M., Chakraborty R., Fuerst P. A., Infinite allele model with varying mutation rate. Proc. Natl. Acad. Sci. U.S.A. 73, 4164–4168 (1976). [DOI] [PMC free article] [PubMed] [Google Scholar]
- 16.Eyre-Walker A., Keightley P. D., The distribution of fitness effects of new mutations. Nat. Rev. Genet. 8, 610–618 (2007). [DOI] [PubMed] [Google Scholar]
- 17.Nosil P., Funk D. J., Ortiz-Barrientos D., Divergent selection and heterogeneous genomic divergence. Mole. Ecol. 18, 375–402 (2009). [DOI] [PubMed] [Google Scholar]
- 18.Woese C., Stackebrandt E., Macke T., Fox G., A phylogenetic definition of the major eubacterial taxa. Syst. Appl. Microbiol. 6, 143–151 (1985). [DOI] [PubMed] [Google Scholar]
- 19.Battistuzzi F. U., Feijao A., Hedges S. B., A genomic timescale of prokaryote evolution: insights into the origin of methanogenesis, phototrophy, and the colonization of land. BMC Evol. Biol. 4, 1–14 (2004). [DOI] [PMC free article] [PubMed] [Google Scholar]
- 20.Parks D. H., et al. , A standardized bacterial taxonomy based on genome phylogeny substantially revises the tree of life. Nat. Biotechnol. 36, 996–1004 (2018). [DOI] [PubMed] [Google Scholar]
- 21.Nhung P. H., et al. , Phylogeny and species identification of the family Enterobacteriaceae based on dnaJ sequences. Diagnost. Microbiol. Infect. Dis. 58, 153–161 (2007). [DOI] [PubMed] [Google Scholar]
- 22.Zhu Q., et al. , Phylogenomics of 10,575 genomes reveals evolutionary proximity between domains Bacteria and Archaea. Nat. Commun. 10, 5477 (2019). [DOI] [PMC free article] [PubMed] [Google Scholar]
- 23.Syvanen M., Molecular clocks and evolutionary relationships: Possible distortions due to horizontal gene flow. J. Mol. Evol. 26, 16–23 (1987). [DOI] [PubMed] [Google Scholar]
- 24.Novichkov P. S., et al. , Genome-wide molecular clock and horizontal gene transfer in bacterial evolution. J. Bacteriol. 186, 6575–6585 (2004). [DOI] [PMC free article] [PubMed] [Google Scholar]
- 25.Dixit P. D., Pang T. Y., Studier F. W., Maslov S., Recombinant transfer in the basic genome of Escherichia coli. Proc. Natl. Acad. Sci. U.S.A. 112, 9070–9075 (2015). [DOI] [PMC free article] [PubMed] [Google Scholar]
- 26.Hassler H. B., et al. , Phylogenies of the 16S rRNA gene and its hypervariable regions lack concordance with core genome phylogenies. Microbiome 10, 104 (2022). [DOI] [PMC free article] [PubMed] [Google Scholar]
- 27.Naum M., Brown E. W., Mason-Gamer R. J., Is 16S rDNA a reliable phylogenetic marker to characterize relationships below the family level in the Enterobacteriaceae? J. Mol. Evol. 66, 630–642 (2008). [DOI] [PubMed] [Google Scholar]
- 28.Ochman H., Elwyn S., Moran N. A., Calibrating bacterial evolution. Proc. Natl. Acad. Sci. U.S.A. 96, 12638–12643 (1999). [DOI] [PMC free article] [PubMed] [Google Scholar]
- 29.Ochman H., Wilson A. C., Evolution in bacteria: Evidence for a universal substitution rate in cellular genomes. J. Mol. Evol. 26, 74–86 (1987). [DOI] [PubMed] [Google Scholar]
- 30.Moran N. A., Munson M. A., Baumann P., Ishikawa H., A molecular clock in endosymbiotic bacteria is calibrated using the insect hosts. Proc. R. Soc. London. Ser. B: Biol. Sci. 253, 167–171 (1993). [Google Scholar]
- 31.Feng L., et al. , A recalibrated molecular clock and independent origins for the cholera pandemic clones. PloS One 3, e4053 (2008). [DOI] [PMC free article] [PubMed] [Google Scholar]
- 32.Menardo F., Duchêne S., Brites D., Gagneux S., The molecular clock of Mycobacterium tuberculosis. PLoS Pathogens 15, e1008067 (2019). [DOI] [PMC free article] [PubMed] [Google Scholar]
- 33.Philippe H., Lopez P., On the conservation of protein sequences in evolution. Trends Biochem. Sci. 26, 414–416 (2001). [DOI] [PubMed] [Google Scholar]
- 34.Ho S. Y., Phillips M. J., Cooper A., Drummond A. J., Time dependency of molecular rate estimates and systematic overestimation of recent divergence times. Mol. Biol. Evol. 22, 1561–1568 (2005). [DOI] [PubMed] [Google Scholar]
- 35.Ho S. Y., Shapiro B., Phillips M. J., Cooper A., Drummond A. J., Evidence for time dependency of molecular rate estimates. Syst. Biol. 56, 515–522 (2007). [DOI] [PubMed] [Google Scholar]
- 36.Ho S. Y., et al. , Time-dependent rates of molecular evolution. Mol. Ecol. 20, 3087–3101 (2011). [DOI] [PubMed] [Google Scholar]
- 37.Ho S. Y., Duchêne S., Molecular-clock methods for estimating evolutionary rates and timescales. Mol. Ecol. 23, 5947–5965 (2014). [DOI] [PubMed] [Google Scholar]
- 38.Wielgoss S., et al. , Mutation rate inferred from synonymous substitutions in a long-term evolution experiment with Escherichia coli. G3: Genes. Genom. Genet. 1, 183–186 (2011). [DOI] [PMC free article] [PubMed] [Google Scholar]
- 39.Massip F., Sheinman M., Schbath S., Arndt P. F., How evolution of genomes is reflected in exact DNA sequence match statistics. Mol. Biol. Evol. 32, 524–535 (2015). [DOI] [PMC free article] [PubMed] [Google Scholar]
- 40.Massip F., Sheinman M., Schbath S., Arndt P. F., Comparing the statistical fate of paralogous and orthologous sequences. Genetic 204, 475–482 (2016). [DOI] [PMC free article] [PubMed] [Google Scholar]
- 41.Harris K., Nielsen R., Inferring demographic history from a spectrum of shared haplotype lengths. PLoS Genet. 9, e1003521 (2013). [DOI] [PMC free article] [PubMed] [Google Scholar]
- 42.Massip F., Arndt P. F., Neutral evolution of duplicated DNA: An evolutionary stick-breaking process causes scale-invariant behavior. Phys. Rev. Lett. 110, 148101 (2013). [DOI] [PubMed] [Google Scholar]
- 43.Sheinman M., et al. , Identical sequences found in distant genomes reveal frequent horizontal transfer across the bacterial domain. Elife 10, e62719 (2021). [DOI] [PMC free article] [PubMed] [Google Scholar]
- 44.Arndt P. F., Sequential and continuous time stick-breaking. J. Stat. Mech.: Theory Exp. 2019, 064003 (2019). [Google Scholar]
- 45.Ziff R. M., McGrady E., The kinetics of cluster fragmentation and depolymerisation. J. Phys. A: Math. General 18, 3027 (1985). [Google Scholar]
- 46.Marçais G., et al. , Mummer4: A fast and versatile genome alignment system. PLoS Comput. Biol. 14, e1005944 (2018). [DOI] [PMC free article] [PubMed] [Google Scholar]
- 47.Jukes T. H., et al. , Evolution of protein molecules. Mammalian Protein Metab. 3, 21–132 (1969). [Google Scholar]
- 48.Vos M., Didelot X., A comparison of homologous recombination rates in bacteria and archaea. ISME J. 3, 199–208 (2009). [DOI] [PubMed] [Google Scholar]
- 49.Fraser C., Hanage W. P., Spratt B. G., Recombination and the nature of bacterial speciation. Science 315, 476–480 (2007). [DOI] [PMC free article] [PubMed] [Google Scholar]
- 50.Smillie C. S., et al. , Ecology drives a global network of gene exchange connecting the human microbiome. Nature 480, 241–244 (2011). [DOI] [PubMed] [Google Scholar]
- 51.Greenlon A., et al. , Global-level population genomics reveals differential effects of geography and phylogeny on horizontal gene transfer in soil bacteria. Proc. Natl. Acad. Sci. U.S.A. 116, 15200–15209 (2019). [DOI] [PMC free article] [PubMed] [Google Scholar]
- 52.Ma Y., et al. , Proposal for reunification of the genus Raoultella with the genus Klebsiella and reclassification of Raoultella electrica as Klebsiella electrica comb. nov. Res. Microbiol. 172, 103851 (2021). [DOI] [PubMed] [Google Scholar]
- 53.Pilar A. V. C., et al. , Similar yet different: Phylogenomic analysis to delineate Salmonella and Citrobacter species boundaries. BMC Genom. 21, 1–13 (2020). [DOI] [PMC free article] [PubMed] [Google Scholar]
- 54.Sturtevant A., Essays on evolution. I. On the effects of selection on mutation rate. Quart. Rev. Biol. 12, 464–467 (1937). [Google Scholar]
- 55.Silander O. K., Tenaillon O., Chao L., Understanding the evolutionary fate of finite populations: The dynamics of mutational effects. PLoS Biol. 5, e94 (2007). [DOI] [PMC free article] [PubMed] [Google Scholar]
- 56.Ku C., Martin W. F., A natural barrier to lateral gene transfer from prokaryotes to eukaryotes revealed from genomes: The 70% rule. BMC Biol. 14, 1–12 (2016). [DOI] [PMC free article] [PubMed] [Google Scholar]
- 57.Salerno W., Havlak P., Miller J., Scale-invariant structure of strongly conserved sequence in genomic intersections and alignments. Proc. Natl. Acad. Sci. U.S.A. 103, 13121–13125 (2006). [DOI] [PMC free article] [PubMed] [Google Scholar]
- 58.Polychronopoulos D., Sellis D., Almirantis Y., Conserved noncoding elements follow power-law-like distributions in several genomes as a result of genome dynamics. PloS One 9, e95437 (2014). [DOI] [PMC free article] [PubMed] [Google Scholar]
- 59.Ravenhall M., Škunca N., Lassalle F., Dessimoz C., Inferring horizontal gene transfer. PLoS Comput. Biol. 11, e1004095 (2015). [DOI] [PMC free article] [PubMed] [Google Scholar]
- 60.Groussin M., et al. , Elevated rates of horizontal gene transfer in the industrialized human microbiome. Cell 184, 2053–2067 (2021). [DOI] [PubMed] [Google Scholar]
- 61.Zhou H., Beltrán J. F., Brito I. L., Functions predict horizontal gene transfer and the emergence of antibiotic resistance. Sci. Adv. 7, eabj5056 (2021). [DOI] [PMC free article] [PubMed] [Google Scholar]
- 62.Dmitrijeva M., et al. , A global survey of eco-evolutionary pressures acting on horizontal gene transfer (2023). [DOI] [PMC free article] [PubMed]
- 63.Adams B. J., et al. , Reprint of biodiversity and systematics of nematode–bacterium entomopathogens. Biol. Control 38, 4–21 (2006). [Biol. Control 37, 32–49 (2006)]. [Google Scholar]
- 64.Francino M., Santos S., Ochman H., Phylogenetic relationships of bacteria with special reference to endosymbionts and enteric species. Prokaryotes 6, 41–59 (2006). [Google Scholar]
- 65.Lan Y., Rosen G., Hershberg R., Marker genes that are less conserved in their sequences are useful for predicting genome-wide similarity levels between closely related prokaryotic strains. Microbiome 4, 1–13 (2016). [DOI] [PMC free article] [PubMed] [Google Scholar]
- 66.Harris R. S., Improved Pairwise Alignment of Genomic DNA (The Pennsylvania State University, 2007). [Google Scholar]
- 67.Sheinman M., Arndt P. F., Massip F., Bacteriatworegimes (2023). Github. https://github.com/mishashe/BacteriaTwoRegimes/. Accessed 4 February 2024.
- 68.O’Leary N. A., et al. , Reference sequence (RefSeq) database at NCBI: Current status, taxonomic expansion, and functional annotation. Nucleic Acids Res. 44, D733–D745 (2016). [DOI] [PMC free article] [PubMed] [Google Scholar]
- 69.Sayers E. W., et al. , Database resources of the national center for biotechnology information in 2023. Nucleic Acids Res. 51, D29–D38 (2023). [DOI] [PMC free article] [PubMed] [Google Scholar]
- 70.Maynard Smith J., Analyzing the mosaic structure of genes. J. Mol. Evol. 34, 126–129 (1992). [DOI] [PubMed] [Google Scholar]
- 71.Inglot T., Janic-Wróblewska A., Data driven chi-square test for uniformity with unequal cells. J. Stat. Comput. Simul. 73, 545–561 (2003). [Google Scholar]
- 72.Olshen A. B., Venkatraman E. S., Lucito R., Wigler M., Circular binary segmentation for the analysis of array-based DNA copy number data. Biostatistics 5, 557–572 (2004). [DOI] [PubMed] [Google Scholar]
- 73.Sheinman M., Arndt P. F., Massip F., Segmut (2023). Github. https://github.com/mishashe/segmut. Accessed 4 February 2024.
- 74.Nelder J. A., Mead R., A simplex method for function minimization. Comput. J. 7, 308–313 (1965). [Google Scholar]
- 75.Geem Z. W., Kim J. H., Loganathan G. V., A new heuristic optimization algorithm: Harmony search. Simulation 76, 60–68 (2001). [Google Scholar]
- 76.Sokal R., Michener C., A statistical method for evaluating systematic relationships. Univ. Kansas Sci. Bull. 38, 1409–1438 (1958). [Google Scholar]
Associated Data
This section collects any data citations, data availability statements, or supplementary materials included in this article.
Supplementary Materials
Appendix 01 (PDF)
Data Availability Statement
Software is available in Github (67) and segmut (73). All other data are included in the manuscript and/or SI Appendix.