

Abstract
Iron deficiency anaemia (IDA) and diabetes mellitus (DM) are most prevalent disease, that diabetic patients are more prone to IDA. Therefore, the main aim of this study was to investigate the relationship between patients with diabetes and IDA in relation to taking iron pills daily and every other day to reduce the effects related to it. Ninety-one participants were enroled and randomly divided into two groups, with a final analysis cohort of 72 patients. The primary focus was on changes in serum Hb and Ferritin levels. The screening phase lasted 24 weeks, leading to 72 eligible participants meeting the criteria for entry into the study. Additionally, the study examined alternations in Hb and Hb A1C levels after treating patients with iron deficiency. The Hb and ferritin level contrasts between groups were not significant (P = 0.096 and P = 0.500, respectively). The relationship between Hb A1C and Hb levels before and after treatment was positive and significant (r 2 = 0.187). The results of the present study show that although the effectiveness of using oral iron supplements did not have a significant difference in terms of increasing haemoglobin and ferritin, the use of oral iron once every other day was more effective than the use of oral iron every day, and also in this study Like other studies, this result concluded that there is a negative correlation between Hb A1C and Hb, and to check the status of Hb A1C in diabetics, the level of Hb should be considered first.
Keywords: diabetes, ferritin, haemoglobin, iron deficiency anaemia, Iron supplements
Introduction
Highlights
Diabetes and iron deficiency anaemia are two significant and interconnected health concerns.
Treating iron deficiency anaemia every other day may prove more effective than daily treatment, not only for healthy individuals but also for diabetic patients.
Additionally, there exists a direct correlation between changes in haemoglobin A1C levels and the treatment of iron deficiency anaemia.
Iron deficiency anaemia (IDA) is the most prevalent type of anaemia, impacting over 2 billion individuals worldwide to varying extents1–3. One of the primary challenges in public health today is the increasing global trend of longer life expectancy and changing lifestyle patterns, which has resulted in a simultaneous increase in the prevalence of diabetes4. Moreover, among diabetic patients, the coexistence of IDA exacerbates the condition, making it more pronounced and severe in individuals with different levels of glomerular filtration rate compared to those without diabetes1,3. Among the cases of anaemia worldwide, a significant 50% can be attributed to inadequate iron levels. This deficiency in iron reserves is closely associated with the increased glycation process involving haemoglobin A1C (Hb A1C). IDA can have severe implications for health and overall well-being, leading to symptoms such as fatigue, weakness, pale skin, shortness of breath, chest pain, headache, and more. It is worth noting that there is a significant prevalence of IDA among individuals with type 2 diabetes mellitus, particularly those affected by nephropathy. The coexistence of IDA and diabetes can have a synergistic effect, leading to worsened health outcomes for patients. Diabetes can contribute to the exacerbation of anaemia by reducing iron absorption and causing gastrointestinal bleeding. Additionally, IDA can impair insulin secretion by the pancreatic beta cells responsible for producing insulin. Meanwhile, IDA can be associated with oxidative stress and disruptions in glucose regulation, which can potentially compromise glycemic control and increase the risk of complications in individuals with diabetes5–8. The oral administration of iron supplementation using ferrous sulfate (FeSO4) is a widely endorsed strategy for treating IDA. Despite its recommendation, the absorption of iron from supplemental sources in individuals with IDA remains limited. To overcome this suboptimal absorption, higher doses of iron are commonly prescribed. However, this practice raises concerns regarding the exacerbation of gastrointestinal symptoms and potential challenges in patient adherence. Remarkably, oral administration of supplementary iron leads to acute escalations in serum hepcidin levels, plays a crucial role in iron metabolism9–11.
Hepcidin plays a critical role in maintaining iron balance in mammals. As a hormone produced by the liver, it regulates the expression and function of ferroportin, the primary iron exporter in cells. Hepcidin binds to ferroportin, leading to its internalization and degradation, thereby reducing the amount of iron that can be transported from the duodenum to the bloodstream10,11. This mechanism has a significant impact on the absorption of dietary iron in the intestines, as enterocytes express ferroportin on their basolateral membrane to facilitate the transfer of iron from the intestinal lumen to the blood. High levels of hepcidin inhibit ferroportin function in enterocytes and decrease iron absorption, whereas low levels of hepcidin stimulate ferroportin function and increase iron absorption. Hepcidin regulation is essential for maintaining iron balance and preventing iron deficiency or overload, as well as for controlling iron availability during infection and inflammation11,12. Therefore, owing to its convenient availability, cost-effectiveness, and enhanced safety profile, oral iron stands as the primary therapeutic choice for addressing iron deficiency anaemia. For optimal patient outcomes, the prescribed dosage necessitates the division of the total amount into multiple administrations across the course of a day13. The administration of high doses of oral iron can lead to an increase in the production of serum hepcidin (Shep) 2 by the liver and maintains its level for at least 24 h. Notably, this response is directly proportional to the iron dose, indicating that higher iron dosages result in greater stability of serum hepcidin levels14–16. Accordingly, research has illuminated a unique pattern observed in the consumption of 60 mg of oral iron twice daily and a single 120 mg dose per day among women. Dividing the dosage into two daily administrations led to a more pronounced presence of serum Hepcidin compared to the once-daily intake. The implications drawn from this study indicate that among women with iron deficiency, the strategy of administering iron supplements as divided doses on a daily basis heightens serum hepcidin levels while curbing iron absorption. Alternatively, adopting an approach of administering iron supplements every other day and in singular doses seems to optimize iron absorption and may present a more favourable dosing regimen9,14. An additional study conducted on women with IDA found that administering oral iron supplements in daily divided doses leads to increased serum Hepcidin levels while concurrently reducing iron absorption. Derived from prior research involving a daily 60 mg dosage in iron-deficient, non-anaemic women, these findings indicate that higher doses (100–200 mg) administered every other day to women with IDA exhibited increased Fractional Iron Absorption (FIA) and potentially fewer gastrointestinal side effects in contrast to daily administration9. In the context of patients afflicted with diabetes and IDA, a research gap exists concerning the comparison between daily and alternate-day intake of iron pills as a means to mitigate Hepcidin-associated effects. Therefore, the primary aim of this study was to evaluate the comparative efficacy of daily versus alternate-day oral iron supplementation in individuals diagnosed with both diabetes and IDA. The study aims to investigate the therapeutic effects of ferrous sulfate in patients diagnosed with iron deficiency anaemia. Specifically, it assesses the comprehensive impacts of daily versus alternate-day iron supplementation on serum Hb and ferritin levels. This examination seeks to pinpoint the most effective method for oral iron administration, addressing hepcidin-induced negative feedback. This approach targets the improvement of hepcidin-induced negative feedback, potentially this approach is intended to ameliorate hepcidin-induced negative feedback, potentially optimizing the ability to absorb iron supplements in patients dealing with both diabetes and IDA.
Method
Study design and participants
The study was carried out at the Diabetes Clinic of Golestan Hospital, Ahvaz, from 19 February 2019, to 9 March 2020. It was designed as a controlled clinical trial, utilizing a single-blinded, phase II, parallel design with two groups: an intervention group (16 weeks) and a control group (8 weeks). Inclusion criteria encompassed individuals aged 18–65 with type 2 diabetes, haemoglobin levels between 9 and 12 for women and 9 and 13 for men, no requirement for blood transfusion or iron injection, exclusive presence of iron deficiency anaemia without other anemias, and Hb A1C levels below 9. Exclusion criteria encompassed lack of satisfaction with participation, transition from oral diabetes treatment to insulin, and the presence of liver disorders indicated by AST and ALT levels exceeding three times the upper normal limit (AST, ALT>3NL); due to a disorder in the production of Hepcidin and a history of gastric surgery. All inclusion criteria were considered according to the lack of urgency of the patients for the treatment of iron deficiency anaemia until the end of the evaluation of the sample size.
In this study, the informed consent form was completed by the patients, and all costs, including blood tests and iron tablets, were borne by the project manager, and this study was conducted after obtaining the code of ethics from the research vice-chancellor of the university and receiving a financial grant in the IRTC with the code: IRCT20190202042591N1 was registered. Additionally, the clinical pharmacy pharmacist worked with the project manager to understand and explain to patients how to take the drugs accurately. The patients included in the study were divided into 2 intervention and control groups in the ratio (1:1) in permutation blocks that were designed on the web by the graghpad website.
The intervention group received 100 mg of elemental ferrous sulfate (2 tablets of 50 mg from Rouz Daro Company) every other day in a morning in and the control group received 100 mg of elemental ferrous sulfate (2 tablets of 50 mg from Rouz Daro Company) every day the form of a morning dose. To prevent disruptions in the allocation of patients to the intervention and control groups and to better implement random allocation, the patients were assigned to each group according to the randomised sequence under the supervision of the project manager. For more accuracy in the study evaluation, the statistical data collector and analyst was blinded in this study. The research has been meticulously registered on www.researchregistry.com and its unique identifying number (UIN) is researchregistry9801. For comprehensive verification and access to the registration details, utilize the following link: https://www.researchregistry.com/browse-the-registry#home/.
Procedures
Initially, the screening process of patients lasted for 24 weeks, and after checking the entry and exit criteria, 72 people were selected to enter the study. The selected patients were assigned to two intervention (A) and control (B) groups according to the sequence of permutation blocks. Patients in the intervention group consumed 100 mg of ferrous sulfate every other day for 16 weeks, and patients in the control group consumed 100 mg of ferrous sulfate every day for 8 weeks.
The final tests to check the results of the study were performed two weeks after the last dose of treatment (7) and at the end of the obtained data, codes A (intervention) and B (control) the person in charge of data collection and analysis was sent to indicate which treatment group each code belonged to.
Outcomes
The expected primary outcome was changes in the serum level of Hb and Ferritin up to two weeks after treatment, as well as the secondary outcome according to studies conducted in the past investigating the relationship between Hb and Hb A1C changes after treatment of iron deficiency patients.
Statistical analysis
Considering that no before similar study on conducted the difference in response to treatment of diabetic patients suffering from iron deficiency every day and every other had been day, this study was started as a pilot with 91 patients evaluated in Golestan Hospital of Ahvaz. Out of these 91 people, 72 people were screened and finally allocated into two groups of 36 people, intervention and control, in the form of randomised permutation blocks. Mean and standard deviation were used to describe the data in quantitative variables, and frequency and percentage were used to describe the data in qualitative variables. The normality of the data was checked using the Golmogorov–Smirnov test. Analysis of covariance was used to analyze the data. A significance level of 0.05 was considered. All analyses were done with SPSS software version 22.
Results
The study was conducted from in February 2019 to 9 March 2020 the Diabetes Clinic of Golestan Hospital in Ahvaz. Out of the initial 91 patients included in the study, 19 were subsequently excluded due to various reasons. These exclusions comprised three individuals who did not sign the ethical consent form, two who changed their residence, one who had passed away, three with a Hb A1C level exceeding nine, one with a history of iron injection, two over the age of 65, two requiring iron injections, two with a history of surgery and stomach bleeding, and finally, three with unbalanced liver enzymes levels. Seventy-two people were screened and two groups of thirty-six people entered the follow-up phase. From the intervention group of thirty-six people, three were excluded from the study in the follow-up phase, and five were excluded from the control group of thirty-six people. Additionally, due to the spread of the COVID-19 pandemic, nine patients refused to cooperate (four people from the control group and five people from the intervention group). The patients included in the study were divided into two intervention and control groups in a ratio of 1:1 in permutation blocks that were designed online using the GraphPad website. The intervention group received 100 mg of ferrous sulfate (2 tablets of 50 mg from Rouz Daro Company) every other day in the morning, and the control group received 100 mg of ferrous sulfate (2 tablets of 50 mg from Rouz Daro Company) every day in the morning (Fig. 1). The details pertaining to specific treatment groups are separately outlined, and for additional investigation, Tables 1 to 7 offer relevant information.
Figure 1.

Trial profile.
Table 1.
Demographic information
| No. intervention group A, n (%) | No. control group B, n (%) | Total, n (%) | |
|---|---|---|---|
| AGE | |||
| 40–18 | 6 (11) | 7 (12/7) | 13 (23/63) |
| 65–40 | 22 (40) | 20 (36/3) | 42 (76/36) |
| Sex | |||
| Male | 9 (16/3) | 7 (12/7) | 16 (29/09) |
| Female | 19 (34/5) | 20 (36/3) | 39 (70/9) |
| Occupation | |||
| Jobless | 7 (12/7) | 10 (18/18) | 17 (30/9) |
| Housewife | 12 (21/81) | 9 (16/3) | 21 (38/18) |
| Worker | 5 (9) | 3 (5/4) | 8 (14/54) |
| Clark | 4 (7/2) | 5 (9) | 9 (16/36) |
| Education | |||
| Illiterate | 11(20) | 12 (21/81) | 23 (41/81) |
| Under diploma | 12 (21/81) | 10 (18/18) | 22 (40) |
| Diploma | 5 (9) | 5 (9) | 10 (18/18) |
| Language | |||
| Persian | 23 (41/81) | 18 (32/72) | 41 (74/54) |
| Arab | 5 (9) | 9 (16/3) | 14 (25/45) |
| Tea consumption | |||
| Yes | 14 (25/45) | 16 (29) | 30 (54/54) |
| No | 14 (25/45) | 11 (20) | 25 (45/45) |
| Smoking | |||
| Yes | 3 (5/4) | 5 (9) | 8 (14/54) |
| No | 25 (45/45) | 22 (40) | 47 (85/45) |
| History of gastritis | |||
| Yes | 16 (29/09) | 15 (27/27) | 31 (56/36) |
| No | 12 (21/81) | 12 (21/81) | 24 (43/63) |
Table 7.
Adjusted averages and comparison of ferritin (mg/dl) of treatment groups
| Type of treatment | Adjusted mean | Standard error | Difference of means | Standard error | P |
|---|---|---|---|---|---|
| Treatment A | 19.147 | 1.312 | −1.217 | 1.784 | 0.500 |
| Treatment B | 20.364 | 1.137 |
In this research, people were placed in two separate categories in terms of age: the lowest frequency (13 people, equal to 23.63%) was assigned to those aged 18–40, and the highest frequency (42 people, equal to 76.36%) was allocated to those aged 40-65. Of the participants, 39 were women and 16 were men, and the distribution of the subjects was random in terms of gender. In terms of job status, people were placed in four separate classes. The lowest frequency (8 people, equal to 14.54%) was assigned to the worker group, and the highest frequency (21 people, equal to 38.18%) was assigned to the housewives. The educational status is divided into three classes. The lowest frequency, with ten people is assigned to the diploma group, which is equivalent to 18%. The highest frequency, with 23 people, is assigned the illiterate group, which is equivalent to 42%. This study involved participants fluent in two distinct languages, Persian and Arabic. Among the participants, the Arab group, comprising 14 individuals, represents the lowest frequency at 26%, while the Persian speakers, totalling 41 individuals, account for the highest frequency at 74.5%. Remarkably, these groups are situated separately from one another based on their respective tea consumption patterns. Concerning smoking habits, these groups are categorized into two distinct groups. The lowest frequency, with eight people, is assigned to the group of cigarette users, equal to 14.54%. The highest frequency, with 44 people, equal to 85.45%, is assigned to those who do not smoke. In relation to gastritis disease, the participants are divided into two distinct groups: those diagnosed with gastritis and those without the disease. The lowest frequency, with 24 people, is assigned to the group without gastritis, equal to 43.63%. The highest frequency, with 31 people, equal to 56.36%, is assigned to those with gastritis. Table 1 showcased detailed analyses of the entirety of the data utilized in this study. It is important to highlight that the distribution of the data within the groups is randomised.
The fasting blood sugar (FBS) levels of the participants underwent evaluation, and a comprehensive overview of the findings is outlined in Table 2, sorted by group. In group A, the average FBS level was recorded at 180 mg/dl. Statistical analysis revealed consistency in the FBS data within this group, with readings consistently at 140 mg/dl both before and after the test. Similarly, group B also demonstrated uniformity. These results emphasize a persistent and unchanging FBS level, irrespective of when the measurements were taken whether before or after the test.
Table 2.
Description of fasting blood sugar (FBS) amount by treatment group
| Treatment A | Treatment B | |||
|---|---|---|---|---|
| Type of treatment | Before treatment | After treatment | Before treatment | After treatment |
| Mean | 180.73 | 148.60 | 147.09 | 152.82 |
| Standard deviation | 56.99 | 38.10 | 38.19 | 56.65 |
| Minimum | 111.00 | 84.00 | 101.00 | 101.00 |
| Maximum | 320.00 | 203.00 | 244.00 | 302.00 |
| Variation range | 209.00 | 119.00 | 143.00 | 201.00 |
| Frequency | 28 | 28 | 27 | 27 |
Hb A1C test purpose is to diagnose prediabetes and diabetes, along with the ongoing monitoring of blood sugar levels in diabetic individuals. Typically, a healthy A1C level rests below 5.7%, while a range from 5.7 to 6.4% indicates the presence of prediabetes, and a measurement of 6.5% or higher confirms diabetes. Furthermore, an A1C levels within the range of 5.7–6.4% recognize as an elevated risk for diabetes, complementing impaired fasting glucose (IFG) and impaired glucose tolerance (IGT)17,18. Haemoglobin levels in blood, measured in grams per decilitre (g/dl), typically range from 14 to 18 g/dl for males and 12 to 16 g/dl for females. Using the latest American Diabetes Association criteria, participants’ glucose tolerance was categorized based on baseline l fasting plasma glucose (FPG) values: normal fasting glucose (NFG) at 5.6 mmol/l (100 mg/dl), impaired fasting glucose (IFG) between 5.6 and 6.9 mmol/l (100–125 mg/dl), and IFG or diabetes starting at greater than or equal to 7 mmol/l (126 mg/dl)19,20. Tables 3 and 4 present the A1C and Hb levels across separate treatment groups, respectively, offering a detailed depiction of the variations and correlations observed within each group. Additionally, Table 5 provides a comprehensive overview of Ferritin level variations across treatments. Collectively, these findings underscore the consistent patterns observed in both primary and secondary outcomes (Tables 3 and 5 - Fig. 2).
Table 3.
Description of A1C (%) levels by treatment group
| Treatment A | Treatment B | |||
|---|---|---|---|---|
| Type of treatment | Before treatment | After treatment | Before treatment | After treatment |
| Mean | 8.123 | 7.989 | 7.122 | 7.311 |
| Standard deviation | 1.791 | 2.201 | 1.612 | 2.106 |
| Minimum | 6.00 | 6.00 | 5.60 | 5.00 |
| Maximum | 12.10 | 11.90 | 10.80 | 10.80 |
| Variation range | 6.10 | 5.90 | 5.20 | 5.80 |
| Frequency | 28 | 28 | 27 | 27 |
Table 4.
Description of Hb (g/dl) levels by treatment group
| Treatment A | Treatment B | |||
|---|---|---|---|---|
| Type of treatment | Before treatment | After treatment | Before treatment | After treatment |
| Mean | 11.270 | 12.383 | 11.582 | 11.732 |
| Standard deviation | 0.920 | 1.371 | 1.658 | 1.361 |
| Minimum | 9.50 | 10.75 | 9.60 | 10.20 |
| Maximum | 12.90 | 15.40 | 15.90 | 14.90 |
| Variation range | 3.40 | 4.65 | 6.30 | 4.70 |
| Frequency | 28 | 28 | 27 | 27 |
Hb, haemoglobin.
Table 5.
Description of the level of ferritin (mg/dl) by treatment group
| Treatment A | Treatment B | |||
|---|---|---|---|---|
| Type of treatment | Before treatment | After treatment | Before treatment | After treatment |
| Mean | 11.732 | 20.333 | 17.875 | 19.188 |
| Standard deviation | 1.361 | 5.199 | 5.572 | 4.736 |
| Minimum | 10.20 | 9.00 | 12.00 | 8.00 |
| Maximum | 14.90 | 31.00 | 28.00 | 26.00 |
| Variation range | 4.70 | 22.00 | 16.00 | 18.00 |
| Frequency | 28 | 28 | 27 | 27 |
Figure 2.
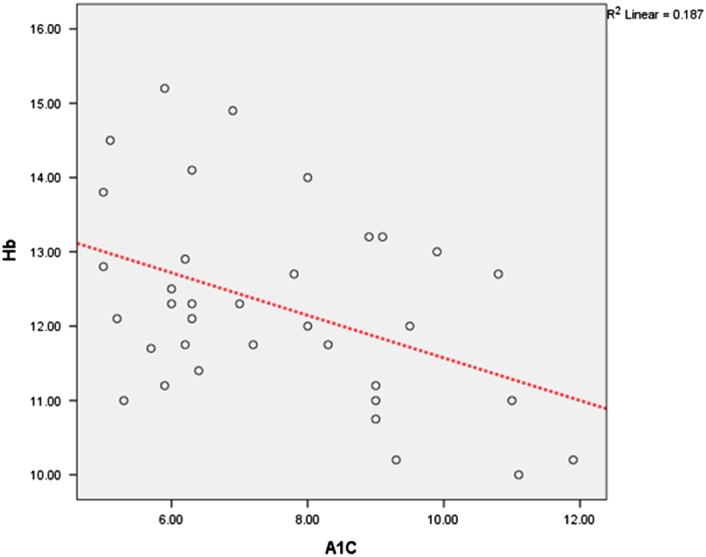
Hemoglobin (Hb) and A1C relationship graph. The relationship between A1C and Hb before treatment is positive and significant. In the following, the scatter diagram of the points of these correlations is reported.
To evaluate and compare the efficacy of treatment A versus treatment B, we meticulously examined the adjusted averages and performed a comparative analysis of Hb and ferritin levels across both treatment groups. Haemoglobin, serving as a pivotal variable of this investigation, is one of the primary outcomes. Based on the findings presented in Table 6, the p value = 0.096 indicates a lack of a statistically significant difference between treatments A and B. Examining Table 7, where the impact on ferritin levels was assessed for both treatments, the obtained p value = 0.5 further supports the absence of a significant distinction between these treatment groups. In essence, while the data from Tables 6 and 7 hint at a potential efficiency advantage for the one-day treatment regimen, it’s crucial to note that this observed difference doesn’t achieve statistical significance as anticipated.
Table 6.
Adjusted averages and Hb (g/dl) comparison of treatment groups
| Type of treatment | Adjusted mean | Standard error | Difference of means | Standard error | P |
|---|---|---|---|---|---|
| Treatment A | 11.696 | 0.286 | −0.731 | 0.428 | 0.096 |
| Treatment B | 12.427 | 0.316 |
Hb, haemoglobin.
Discussion
Diabetes causes significant changes in most of the body’s systems and can immediate or onset delayed of the disease, which can ultimately cause lead to death, disability and high medical costs21. This disease can lead to complications such as cardiovascular complications, nephropathy, neurological complications, ischaemic heart diseases, hypertension, retinopathy, neuropathy, and cataracts. In general, the complications associated with diabetes originate from extended periods of elevated glucose levels, impacting blood vessels and causing constriction in both small and large vessels. This constriction leads to issues such as diminished foot circulation, and an increased risk of amputation as well as kidney dysfunction. Furthermore, diabetes amplifies the probability of developing cardiovascular conditions like coronary artery disease and heart failure22. In a 10-year cohort study in America, it was observed that a low level of education is associated with a decrease in physical activity, and the higher the level of education, the more physical activity increases significantly. Additionally, the relationship between literacy, health awareness, and the prevalence of type 2 diabetes is a complex issue. Evidence indicates that heightened health literacy correlates with enhanced understanding of diabetes and improved self-care behaviours. This association may potentially result in better glycemic control, contributing to a potential decline in the prevalence of type 2 diabetes23.
The current guidelines for treating iron deficiency recommend a daily iron supply divided throughout the day to enhance absorption. However, daily dosing might elevate serum hepcidin levels and subsequently reduce iron absorption. In a clinical trial study, iron absorption from oral supplements was compared between doses administered on consecutive days versus alternate days, delivered either as a morning dose once daily or as an experimental divided dose, among women aged 18–40 years. Switzerland was the site of the study. In this study, one group was given ~60 mg of iron on consecutive days for 14 days, and the other group was given similar doses on alternate days for 28 days. Fourteen days after the final dose, each group was transferred to another diet. Within-person comparisons were made. The results of the bioavailability study were the availability of iron, which was evaluated by measuring the abundance of isotopic labels in red blood cells Fourteen days after administration and serum hepcidin. The results of the study showed that divided doses twice a day resulted in a higher serum hepcidin concentration than the once-a-day dose, and no Grade 3 or 4 side effects were reported. Therefore, the authors concluded that in women suffering from iron deficiency, daily iron supplements in the form of divided doses increase serum hepcidin and decrease iron absorption. Providing iron supplements on alternate days and in a single dose optimizes iron absorption and may be a therapeutic regimen with an optimal dose24.
Ferritin plays an important role in maintaining intracellular iron balance. In a steady state, the serum ferritin level is related to the total body iron sources. Therefore, the measurement of serum ferritin level is the most suitable laboratory test for estimating iron storage25. An insufficiency of iron commonly leads to anaemia, particularly among adolescents. This condition during adolescence results in decreased physical and mental abilities, leading to reduced focus and performance in both work and education26–29. Consequently, along with serum ferritin, the measurement of haemoglobin level is considered a suitable laboratory test for evaluating iron reserves and sources in the body. The body needs iron for cell growth and function. Iron participates in many enzyme systems in the body30. The main form of glyco haemoglobin is Hb A1C; the lack of this type of haemoglobin in chronic diabetic patients causes an abnormal increase in blood sugar and, therefore has a positive relationship with blood sugar control. Previous studies indicate that iron deficiency anaemia affects the level of Hb A1C31.
In the study of Coban and colleagues, the effect of iron deficiency anaemia on Hb A1C was determined. Fifty patients with iron deficiency anaemia and fifty healthy individuals, matched in terms of age and sex, were studies. Haematology measurements, fasting and postprandial glucose levels, and Hb A1C were performed in all subjects before iron therapy. All patients with iron deficiency anaemia were treated with 100 mg per day for three months and the laboratory tests were repeated after iron therapy. The results showed that the average level of Hb A1C in patients with iron deficiency anaemia was higher than of the healthy group. In patients with iron deficiency anaemia, haemoglobin A1c decreased after iron treatment. Their results showed that iron deficiency anaemia is associated with higher concentrations of Hb A1C, and replacement with iron leads to a decrease in Hb A1C31. Iron concentration should be considered when interpreting of Hb A1C concentration in diabetes mellitus. Therefore, iron replacement is especially important in diabetic patients with iron deficiency, because it increases the reliability of Hb A1C determination. Similarly, Brooks et al.32 showed higher haemoglobin A1c concentration in non-diabetic adults with iron deficiency, which has decreased to normal after iron replacement.
Hansen et al. showed normal Hb A1C concentrations in iron deficiency, which decreased to abnormal levels after iron supplementation33. On the contrary, Van Heiningen and Dalton reported no change in Hb A1C concentration in non-diabetic patients with iron deficiency anaemia before and after iron treatment. They pointed out that the reported differences in Hb A1C concentration before and after iron supplementation are due to differences in the laboratory methods used to measure Hb A1C. The cause of high Hb A1C in iron deficiency anaemia is still unclear34. El Aguza and colleagues explained it in terms of the mechanism of Hb A1C production. The level of Hb A1C reflects the balanced relationship between the concentration of Hb A1C and serum glucose. Therefore, if serum glucose is allowed to remain constant, a decrease in haemoglobin concentration may lead to an increase in the glycemic deficit35.
Tarem and colleagues speculated that the appearance of red blood cells in the circulation after iron therapy could lead to the dilution and reduction of the concentration of Hb A1C already formed36. Future studies may reveal the mechanism of increased Hb A1C level in iron deficiency anaemia. Therefore, iron deficiency must be corrected before any diagnostic or therapeutic decision based on Hb A1C. Additionally, Hb A1C is usually used to measure long-term blood sugar control in patients with diabetes, as it has been shown that the amount of Hb A1c predicts the risk of many chronic complications in diabetes37. Kuban and colleagues’ study shows that iron deficiency is associated with a higher proportion of Hb A1C, which can cause problems in the diagnosis of uncontrolled diabetes in patients with iron deficiency. Iron status should be considered during the interpretation of Hb A1C concentration in diabetes mellitus. Therefore, iron mellitus, and replacement is especially important in diabetic patients with iron deficiency, as it increases the reliability in determining Hb A1C23. In the current study, fasting blood sugar did not change significantly with the increase in haemoglobin during the treatment, so the relationship between Hb A1C and haemoglobin was such that the higher the haemoglobin after the treatment; the lower the level of Hb A1C.
Conclusion
The results of the present study show that, although the effectiveness of using oral iron supplements did not have a significant difference in terms of increasing haemoglobin and ferritin, the use of oral iron once every other day was more effective than the use of oral iron every day. Like other studies, this result concluded that there is a negative correlation between Hb A1C and Hb, and to check the status of Hb A1C in diabetics, the level of Hb should be considered first.
Ethical approval
Design number: D-9711.
Ethics approval code: IR.AJUMS.REC.1397.924.
Dr. Majid Karandish.
Director of Research Development and Evaluation Signed by the Research Director of Jundishapur University of Medical Sciences, Ahvaz.
Consent
Written informed consent was obtained from the patient for publication and any accompanying images. A copy of the written consent is available for review by the Editor-in-Chief of this journal on request.
Sources of funding
There was no external financial sponsorship; the research was exclusively funded through a university grant.
Author contribution
B.T. performed the experiments, analyzed the data, and wrote the manuscript; R.G. conceived and supervised the project, designed the studies; T.V. and L.M. participated in designing the studies, supervising the data collection, and verifying the patients’ entry and exit criteria; A.G. revised and helped to write the manuscript.
Conflicts of interest disclosure
The authors declare that they have no conflict of interest.
Research registration unique identifying number (UIN)
It is registered with IRCT IRCTID: IRCT20190202042591N1 From the Iranian Registry of Clinical Trials https://www.irct.ir/trial/39529.
Guarantor
We assure the precision and reliability of all data.
Data availability statement
Available upon reasonable request.
Provenance and peer review
Not commissioned, externally peer-reviewed.
Footnotes
Sponsorships or competing interests that may be relevant to content are disclosed at the end of this article.
Contributor Information
Bahareh Taati, Email: bahareh_taati@yahoo.com.
Reza Ganji, Email: Ganji-r@ajums.ac.ir.
Leila Moradi, Email: Moradi-l@ajums.ac.ir.
Tina Vosoughi, Email: vosoughi-t@ajums.ac.ir.
Amir Gisouei, Email: amirgisuee@gmail.com.
References
- 1.Demieger E. Preventing and controlling iron through primary health care 1989, a guide for health deficiency administrators and program anemia managers. WHO; 1995:13–43. [Google Scholar]
- 2.Organization, U.N.W.H . Iron Deficiency Anaemia: Assesment, Prevention and Control: a Guide for Programme Managers 2001World Health Organization. [Google Scholar]
- 3.Thomas MC, MacIsaac RJ, Tsalamandris C, et al. Unrecognized anaemia in patients with diabetes: a cross-sectional survey. Diabetes care 2003;26:1164–1169. [DOI] [PubMed] [Google Scholar]
- 4.Karami M, Hosseini SM. Prevalence of chronic complications and related risk factors of diabetes in patients referred to the diabetes center of Hamedan Province. Avicenna J Nursing Midwifery Care 2017;25:69–74. [Google Scholar]
- 5.Soliman AT, De Sanctis V, Yassin M, et al. Iron deficiency anaemia and glucose metabolism. Acta Bio Med Atenei Parmensis 2017;88:112. [DOI] [PMC free article] [PubMed] [Google Scholar]
- 6.Sawada T, Konomi A, Yokoi K. Iron deficiency without anaemia is associated with anger and fatigue in young Japanese women. Biol Trace Element Research 2014;159:22–31. [DOI] [PubMed] [Google Scholar]
- 7.Santos MCF, Anderson CP, Neschen S, et al. Irp2 regulates insulin production through iron-mediated Cdkal1-catalyzed tRNA modification. Nature Communications 2020;11:296. [DOI] [PMC free article] [PubMed] [Google Scholar]
- 8.Christy AL, Manjrekar PA, Babu RP, et al. Influence of iron deficiency anaemia on hemoglobin A1c levels in diabetic individuals with controlled plasma glucose levels. Iranian Biomedical Journal 2014;18:88. [DOI] [PMC free article] [PubMed] [Google Scholar]
- 9.Stoffel NU, Cercamondi CI, Brittenham G, et al. Iron absorption from oral iron supplements given on consecutive versus alternate days and as single morning doses versus twice-daily split dosing in iron-depleted women: two open-label, randomised controlled trials. The Lancet Haematology 2017;4:e524–e533. [DOI] [PubMed] [Google Scholar]
- 10.Ganz T. Hepcidin and iron regulation, 10 years later. Blood The Journal of the American Society of Hematology 2011;117:4425–4433. [DOI] [PMC free article] [PubMed] [Google Scholar]
- 11.Rossi E. Hepcidin-the iron regulatory hormone. Clinical Biochemist Reviews 2005;26:47. [PMC free article] [PubMed] [Google Scholar]
- 12.Wang C-Y, Babitt JL. Hepcidin regulation in the anaemia of inflammation. Current Opinion In Hematology 2016;23:189. [DOI] [PMC free article] [PubMed] [Google Scholar]
- 13.Gori F, Tirelli AS, Piontini A, et al. Metabolic Syndrome, homocysteine and uric acid in patients with obesity; experience from obesity and work centre. Mediterranean Journal of Nutrition and Metabolism 2021;14:277–288. [Google Scholar]
- 14.Moretti D, Goede JS, Zeder C, et al. Oral iron supplements increase hepcidin and decrease iron absorption from daily or twice-daily doses in iron-depleted young women. Blood The Journal of the American Society of Hematology 2015;126:1981–1989. [DOI] [PubMed] [Google Scholar]
- 15.Lin L, Valore EV, Nemeth E, et al. Iron transferrin regulates hepcidin synthesis in primary hepatocyte culture through hemojuvelin and BMP2/4. Blood The Journal of the American Society of Hematology 2007;110:2182–2189. [DOI] [PMC free article] [PubMed] [Google Scholar]
- 16.Zimmermann MB, Troesch B, Biebinger R, et al. Plasma hepcidin is a modest predictor of dietary iron bioavailability in humans, whereas oral iron loading, measured by stable-isotope appearance curves, increases plasma hepcidin. The American Journal Of Clinical Nutrition 2009;90:1280–1287. [DOI] [PubMed] [Google Scholar]
- 17.Evron JM, Herman WH, McEwen LN. Changes in screening practices for prediabetes and diabetes since the recommendation for hemoglobin A1c testing. Diabetes Care 2019;42:576–584. [DOI] [PMC free article] [PubMed] [Google Scholar]
- 18.Lorenzo C, Wagenknecht LE, Hanley AJG, et al. A1C between 5.7 and 6.4% as a marker for identifying pre-diabetes, insulin sensitivity and secretion, and cardiovascular risk factors: the Insulin Resistance Atherosclerosis Study (IRAS). Diabetes Care 2010;33:2104–2109. [DOI] [PMC free article] [PubMed] [Google Scholar]
- 19.de Andrade Mesquita L, Pavan Antoniolli L, Cittolin-Santos GF, et al. Distinct metabolic profile according to the shape of the oral glucose tolerance test curve is related to whole glucose excursion: a cross-sectional study. BMC Endocrine Disorders 2018;18:1–8. [DOI] [PMC free article] [PubMed] [Google Scholar]
- 20.Hutchinson MS, Joakimsen RM, Njølstad I, et al. Glycated hemoglobin in diagnosis of diabetes mellitus and pre-diabetes; validation by oral glucose tolerance test. The Tromsø OGTT Study. Journal of Endocrinological Investigation 2012;35:835–840. [DOI] [PubMed] [Google Scholar]
- 21.Ahmadi A, Hasanzadeh J, Rahimi M, et al. , Effective factors in the quality of life in patients with type 2 diabetes in Chaharmahal & Bakhteyari Province. 2011:3;7–13. [Google Scholar]
- 22.Pálsson R, Patel UD. Cardiovascular complications of diabetic kidney disease. Advances in Chronic Kidney Disease 2014;21:273–280. [DOI] [PMC free article] [PubMed] [Google Scholar]
- 23.Barceló A, Aedo C, Rajpathak S, et al. The cost of diabetes in Latin America and the Caribbean. Bulletin of the World Health Organization 2003;81:19–27. [PMC free article] [PubMed] [Google Scholar]
- 24.Ganz T, Nemeth E. Hepcidin and iron homeostasis. Biochimica et Biophysica Acta (BBA)-Molecular Cell Research 2012;1823:1434–1443. [DOI] [PMC free article] [PubMed] [Google Scholar]
- 25.Orino K, Lehman L, Tsuji Y, et al. Ferritin and the response to oxidative stress. Biochemical Journal 2001;357:241–247. [DOI] [PMC free article] [PubMed] [Google Scholar]
- 26.De‐Regil LM, Jefferds ME, Sylvetsky AC, et al. Intermittent iron supplementation for improving nutrition and development in children under 12 years of age. Cochrane Database of Sys. Rev 2011;712:CD009085. [DOI] [PMC free article] [PubMed] [Google Scholar]
- 27.Silla LMR, Zelmanowicz A, Mito I, et al. High prevalence of anaemia in children and adult women in an urban population in southern Brazil. PloS one 2013;8:e68805. [DOI] [PMC free article] [PubMed] [Google Scholar]
- 28.Duque X, Martinez H, Vilchis-Gil J, et al. Effect of supplementation with ferrous sulfate or iron bis-glycinate chelate on ferritin concentration in Mexican schoolchildren: a randomized controlled trial. Nutrition Journal 2014;13:1–10. [DOI] [PMC free article] [PubMed] [Google Scholar]
- 29.Leonard AJ, Chalmers KA, Collins CE, et al. The effect of nutrition knowledge and dietary iron intake on iron status in young women. Appetite 2014;81:225–231. [DOI] [PubMed] [Google Scholar]
- 30.Lieu PT, Heiskala M, Peterson PA, et al. The roles of iron in health and disease. Molecular Aspects Of Medicine 2001;22:1–87. [DOI] [PubMed] [Google Scholar]
- 31.Coban E, Ozdogan M, Timuragaoglu A. Effect of iron deficiency anaemia on the levels of hemoglobin A1c in nondiabetic patients. Acta Haematologica 2004;112:126–128. [DOI] [PubMed] [Google Scholar]
- 32.Brooks AP, Metcalfe J, Day JL, et al. Iron deficiency and glycosylated haemoglobin. Lancet 1980;316:141. [DOI] [PubMed] [Google Scholar]
- 33.Gram‐Hansen P, Eriksen J, Mourits‐Andersen T, et al. Glycosylated haemoglobin (HbA1c) in iron‐and vitamin B12 deficiency. Journal of Internal Medicine 1990;227:133–136. [DOI] [PubMed] [Google Scholar]
- 34.Van Heyningen C, Dalton RG. Glycosylated haemoglobin in iron-deficiency anaemia. Lancet 1985;325:874. [DOI] [PubMed] [Google Scholar]
- 35.El-Agouza I, Abu Shahla A, Sirdah M. The effect of iron deficiency anaemia on the levels of haemoglobin subtypes: possible consequences for clinical diagnosis. Clinical & Laboratory Haematology 2002;24:285–289. [DOI] [PubMed] [Google Scholar]
- 36.Tarim O, Kucukerdogan A, Gunay U, et al. Effects of iron deficiency anaemia on hemoglobin A1c in type 1 diabetes mellitus. Pediatrics International 1999;41:357–362. [DOI] [PubMed] [Google Scholar]
- 37.Edelman SV. Importance of glucose control. Medical Clinics of North America 1998;82:665–687. [DOI] [PubMed] [Google Scholar]
Associated Data
This section collects any data citations, data availability statements, or supplementary materials included in this article.
Data Availability Statement
Available upon reasonable request.