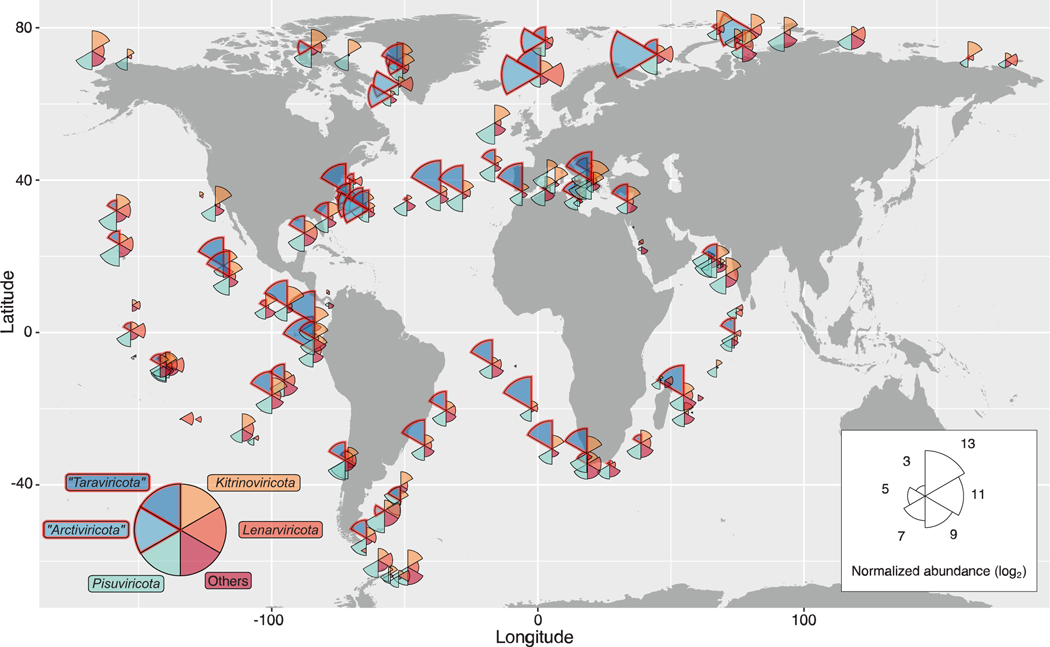
Fig. 4. Biogeography of orthornaviran megataxa.
Global map showing the distribution and average relative abundance (on a log2 scale) of vOTUs inferred in this study per phylum. The position and color of the wedges are fixed for the same megataxon across the Global Ocean. Wedge lengths are proportional to the average abundance in the sample as well as across the global dataset. Biogeography per size fraction is provided in fig. S11.

