

Abstract
Among low molecular weight thiols, glutathione (GSH) is the main antioxidant in the cell and its concentration is an indicator of redox status. A cyclic disulfide-linked dinitroxide was designed for monitoring GSH by Electron Paramagnetic Resonance (EPR) spectroscopy. Reaction of the disulfide with GSH and three other thiols was measured at 9.6 GHz (X-band) and shown to be first order in thiol. It is proposed that reaction of the disulfide with one equivalent of thiolate produced a short-lived intermediate that reacts with a second equivalent of thiolate to produce the cleavage product. The equilibrium ratio of cleaved and intact disulfide is a measure of redox state. Since a long-term goal is to use the disulfide to probe physiology in vivo, feasibility of EPR spectroscopy and imaging of the disulfide and its cleavage product was demonstrated at 1 GHz (L-band).
Graphical Abstract

Introduction
Thiols, disulfides, and exchange reactions between them are physiologically important. In the cell, thiols and disulfides are essential for protein structure and function. Low-molecular-weight thiols are also protective – they scavenge reactive oxygen and nitrogen species (ROS/RNS), and detoxify xenobiotics and toxic metabolites.1–3 For example, the efficacy of cancer therapies that rely on ROS generation can be greatly influenced by the redox microenvironments of heterogeneous tumors.4 The significance of these roles makes the redox status of thiols in vivo an important parameter for understanding many physiological processes. With intracellular concentrations in the 1 – 10 mM range, glutathione (GSH) is the most abundant low-molecular-weight thiol in cells.1 Because the ability to quantify GSH would be useful in many clinical and preclinical settings, developing methodology to quantify GSH is an important goal.
Previously we and others showed that linear disulfide-linked dinitroxide biradicals with moderate to strong electron-electron spin-spin interaction can function as electron paramagnetic resonance (EPR) sensors for free thiols such as glutathione (GSH).5–8 Reaction with GSH cleaves the disulfide bond, forming two monoradicals and loss of the spin-spin interaction, which results in a dramatic change from a 5-line to a 3-line EPR spectrum. Further work showed the utility of such probes in imaging.8–10 Under physiological conditions, the two monoradicals resulting from cleavage of a linear disulfide-dinitroxide never recombine. This limits one to measuring cleavage kinetics, from which GSH concentration can be inferred.7 We present here the next generation of nitroxide-based biradical redox probes – a cyclic disulfide-dinitroxide (cPxSSPx-1). The conformation of the cyclic cPxSSPx-1 results in negligible exchange interaction between the two nitroxides. Cleavage of the disulfide linkage permits conformations with spin-spin exchange and changes the EPR spectrum. The cyclic structure prevents the two nitroxide moieties from diffusing apart after disulfide cleavage and provides the opportunity for reversibility that can monitor equilibria, as well as kinetics. Using previously developed spectral-spatial image reconstruction algorithms, the spectral differences can be resolved in space to allow assessment of the local redox environment.11–13 The multistep synthesis of cPxSSPx-1 will be published separately.

In the studies reported here we seek to characterize the kinetics and mechanism of the reaction of thiols with cPxSSPx-1. Importantly, in thiol-disulfide reactions, the deprotonated thiolate (RS–) is the reactive nucleophilic species, whereas the protonated thiol (RSH) is much less nucleophilic.14,15 Since the pKa for alkyl thiols is well above 8, the predominant form at physiologic pH is the thiol. However, in this discussion thiols are drawn in their thiolate form because that is the predominant reactive species.
In this report, kinetic experiments were performed using four thiols: glutathione (GSH), cysteine (Cys), N-Boc-L-cysteine (BLC), and monothioglycerol (MTG). GSH and Cys are of interest because they function as biological antioxidants and as thiol-disulfide buffers. For their role in thiol-disulfide interchange, the primary driver of activity is the nucleophilicity of the thiolate species.16 The order of disulfide reduction reactivity therefore is: GSH > Cys.17 BLC, with the bulky tert-butoxycarbonyl (Boc) substituent on the α-amino group, was included for mechanistic comparisons to Cys. MTG was studied because the reactivity is expected to be similar to the widely used dithiothreitol (DTT), but without the ability to cyclize, which would complicate the kinetics. Continuous wave (CW) EPR studies of reaction kinetics were performed at X-band (ca. 9.5 GHz). Rapid-scan EPR imaging of a phantom containing the biradical was performed at L-band (1 GHz), to demonstrate the feasibility of using cPxSSPx-1 as an in vivo reporter of cellular thiol redox status.18
Methods
Reagents.
Lyophilized cPxSSPx-1 (40.5 mg) was dissolved in 8.1 mL of DMSO to make a 10 mM stock solution. HEPES (Fisher Biotech) and diethylene-triaminepentaacetic acid (DTPA, Aldrich) were used as received to make a buffered solution of 200 mM HEPES and 1 mM DTPA, adjusted to pH 7.4 with NaOH, that was used in all reactions. L-Cysteine‧HCl‧H2O (Fisher Biotech), N-Boc-L-Cys-OH (Sigma-Aldrich), monothiolglycerol (or 3-mercapto-1,2-propanediol; MP Biomedicals), glutathione, reduced, (Sigma-Aldrich), tris(2-carboxyethyl)-phosphine (TCEP; Thermo Scientific) were used as received.
EPR Measurements.
Data were collected at ca. 9.6 GHz using a Bruker Biospin EMXnano with scan widths of 7 mT and 0.06 mT modulation at 100 kHz. Samples for spectroscopy were contained in pyrex capillaries with internal diameter of about 1 mm supported in 4 mm OD quartz tubes. For the N2 purged reactions of Cys the solutions of reactants were either purged with N2 for 30 min prior to mixing (purged solutions) or mixed under N2 with purging in a I2R glove bag (glove bag solutions) prior to loading into 0.9 mm ID Teflon tubing that was supported in a 4 mm OD quartz tube. A thin Teflon tube was inserted into the 4 mM OD quartz tube and used to actively purge the quartz tube with N2 throughout the time of the kinetics experiment. Reaction kinetics were monitored using the 2D_Field_Delay option in Bruker’s Xenon software. Delay was set to 0 seconds and 200 scans were collected with a time for each scan of 23.9 sec.
For rapid-scan EPR, a previously described benchtop spectrometer, modified to operate at 1 GHz, was used for spectroscopy and imaging.18 A loop-gap resonator with internal diameter of 2.5 cm was used. Resonated sinusoidal scans were taken at a scan frequency of 9.76 kHz for spectroscopy or 17.85 kHz for imaging, with a scan width of 6 mT. 2D spectral-spatial imaging used a maximum gradient of 1 mT/cm along the laboratory z-axis with 41 equally-spaced projections requiring 20 minutes of collection time. For each projection 425,000 scans were averaged. The phantom consisted of two cylindrical vials (2.5 cm wide, 1.25 cm tall) containing cPxSSPx-1 or a reference solution of 15N,d13-CTPO (3-carbamoyl-2,2,5,5-tetramethyl-1-pyrrolidinyloxy). Locally-written software was used to reconstruct 2D spectral-spatial images.11 Derivative spectra were produced using the EasySpin pseudo-modulation function.19 There is a good match of lineshapes in slices through the image with a non-gradient spectrum, indicating the spectral fidelity of the reconstructed image.
Simulations.
EPR spectra were simulated using locally-written software and EasySpin.13 The calculation, described in detail by Sakarapandi et al.,12 uses g = 2.0045 and nitrogen hyperfine constant AN = 44.6 MHz that are characteristic of the monoradicals that comprise the biradical as inputs. Values of the electron-electron spin-spin coupling constant, J, for each conformation are varied to fit the spectra. The conformations are inter-related via the equilibrium populations and rates of interconversion. To analyze spectra containing varying amounts of intact and cleaved cPxSSPx-1 three populations were assumed: P1, the disulfide (uncleaved) with J = 0 MHz; P2, the cleaved dithiol in a weakly coupled conformation with J = 10 MHz; and P3, the cleaved dithiol in a strongly coupled conformation with J = 2000 MHz. Populations and rate constants of the dynamic exchange processes between them were determined by fitting the experimental spectra. These populations may be ensembles of rapidly interconverting conformations. Simulations of the spectra at equilibrium for the reaction of GSH with cPx-SSPx-1 are shown in Fig. S2 and the simulation parameters are listed in Table S3.
Kinetics.
For alkyl thiols with no other ionizable groups the undissociated SH forms react with disulfides up to 1010 slower than their corresponding thiolates.20 Alkyl thiols have pKa values exceeding 8, so high concentrations of the thiols were required to achieve desired concentrations of thiolate at pH 7.4. Concentrations of thiolate for the kinetics experiments were estimated based on literature pKa values.21 These macroscopic pKa values are less precise than the so-called microscopic pka values.22 The thiolate concentrations calculated with macroscopic and microscopic pKa values are compared in the Tables S1 and S2. Total concentrations of each thiol were selected to produce thiolate concentrations in the range of 0.1 to 2.0 mM.
Reactions of 0.1 mM cPxSSPx-1 with varying concentrations of thiols (thiolates) were followed for at least 1.5 hours by monitoring the peak height of the low-field EPR line. The low-field line is 1/3 of the total signal intensity for the 3-line spectrum of a mononitroxide and 1/9 of the total signal intensity for the 5-line spectrum of biradical conformations with J > 0. The low-field line has higher S/N than the broad lines of the 5-line spectrum, so it is a convenient monitor of the reaction kinetics. The initial rate was estimated with a linear fit, and the logarithm of the initial rate, log(v0), was plotted against the logarithm of the thiolate concentration to determine reaction order. Each rate reported is the average of three replicates.
Equilibrium of the
GSH Reaction. The equilibrium of the reaction of cPxSSPx-1 with GSH is described by the following chemical equation.
| #(1) |
Where denotes the equilibrium populations produced by the isolated biradical reaction (based on the simulated biradical equilibrium populations). This provides the equilibrium constant () expression.
| #(2) |
Equation (2) can then be solved for the ratio of the biradical equilibrium concentrations.
| #(3) |
Several spectra near the end of the reaction time course (approximately the last eight minutes of each reaction) were averaged and simulated to determine the equilibrium populations of cleaved and uncleaved disulfide, i.e., the reduced and oxidized forms, respectively. The calculated concentrations of the reduced and oxidized forms were then used to determine the expected equilibrium concentrations of GSH and GSSG produced by the biradical reaction. If this is the only reaction occurring in the solution then at equilibrium
| #(4) |
and
| #(5) |
where denotes the initial GSH concentration. When the data were analyzed assuming that this is the only reaction of GSH occurring in solution, the value of depended on []. GSH also reacts with under physiological conditions23 to a significant extent, with the stoichiometry
| #(6) |
where denotes the equilibrium concentrations produced by the reaction with dioxygen. This reaction produces additional oxidized glutathione () that affects the equilibrium of the biradical. The [] is included in the calculation of equilibrium concentrations as shown in Eq (7) and (8).
| #(7) |
| #(8) |
Where T denotes the total equilibrium concentrations. The values from equations (7) and (8) were substituted into equation (9) to determine . For each [] the value of [] was adjusted, within the constraint of limited availability of O2, to provide a constant value of (Table S4).
| (9) |
Results and Discussion
EPR spectra of cleaved (reduced) cPxSSPx-1.
The spectrum of cPxSSPx-1 changes from a 3-line spectrum to a 5-line spectrum upon reduction with TCEP (Fig. 1). The broad lines in the spectrum of the reduced form (marked with arrows in Fig. 1) are characteristic of conformationally dynamic spin-spin interactions with relatively small J in conformation P2 and relatively large J in conformation P3 (Fig. 2). Simulation parameters were linewidth = 0.11 mT, k1’ = 8×10⁻³ s−1, k3 = 7×10⁶ s−1, and populations P1 = 0.0, P2 = 0.4, and P3 = 0.6. Though P1 is set to 0 for the spectrum shown, the input is required for the program to progress. Similarly, due to the rate of the cleavage reaction being very slow on the EPR timescale, the simulation is insensitive to k1’ when values are less than 104 s−1. The value listed here is only an estimate of the TCEP reaction rate based on the reaction time trace. Linewidths were consistent across all of the reactions. The double integrals did not vary, within experimental uncertainty over the course of the reactions. The assumption that k2 is fast enough to prevent buildup of intermediate P4 is supported by the lack of significant change in the tumbling of the biradical, which would be indicated by a change in the peak height of the high-field line. It is also supported by the observation (discussed in the following paragraph) that the reaction kinetics are first order with respect to thiol.
Figure 1:

X-band spectra (black line) and simulations (red dashed line) of 0.1 mM cPxSSPx-1 before (top) and after (bottom) cleavage of disulfide bond by reduction with 1 mM TCEP. Arrows mark the broad lines characteristic of electron spin-spin interaction. The amplitude of the sharp peaks is a factor of three smaller in the cleaved conformation with significant electron-electron spin-spin interaction than in the cyclic form. The parameters for the simulations are given in the text.
Figure 2:

Scheme for reaction of cPxSSPx-1 with thiols. The three populations used for simulation are labeled P1 (uncleaved), P2 (cleaved, weakly spin-coupled conformation), and P3 (cleaved, strongly spin-coupled conformation). The rate constants used in the simulation were k1’ and k3, representing the reaction and conformational exchange rates, respectively, and the corresponding equilibrium constants K1 and K3. The proposed intermediate P4 is not included in the kinetic analysis because its concentration is expected to be very low.
Kinetics of thiol reaction with cPxSSPx-1.
GSH and MTG showed a clear reaction with significant increase in intensity of the 5-line spectrum and decrease of the low-field line over the duration of the experiment (ca. 1.5 hr). For reaction with Cys there is a measurable decrease in height of the low-field line of the EPR spectrum (without loss of integrated intensity), confirming that reaction had taken place. However, the extent of reaction with Cys is small enough that the 5-line spectrum indicative of J > 0 was difficult to quantitate.
The reaction order for each reductant was determined with a log(v0) vs. log[thiol] plot (Fig. 3). Reactions of Cys, BLC, and GSH are clearly identified as 1st order. The plot for MTG has a slope of 0.6, suggesting close to half order, however, at higher concentrations the initial reaction rate was quite fast, resulting in much of the initial portion of the time traces being missed by the time sample recording could begin (Fig 4, MTG). The measured reaction rates at higher MTG concentrations likely underestimate v0.
Figure 3:

Reaction order plots for cPxSSPx-1 reacting with thiol reducing agents. Blue symbols are data (mean ± SE); red lines are least-squares fits. The y axis for each plot spans more than 1 log unit. The [thiolate] is proportional to Ka·[thiol] so the intercept depends on Ka and the slope defines the reaction order.
Figure 4:

Time dependence of intensity of the low-field line in the X-Band spectra of cPxSSPx-1 reacting with varying concentrations of thiol. Inset: Data (black) and simulation (dotted red) of indicated point on the 15.9 mM Cys trace; field axis in mT.
Proposed mechanism of reaction.
Nucleophilic attack by a thiolate on the disulfide bond of cPxSSPx-1 initiates the reaction (Fig. 2).24 Three sulfur atoms are involved in the reaction and must be collinear in the transition state.25,26 The steric hindrance of the nitroxide groups and the geometric constraints imposed by the cyclic structure may slow this reaction. The result of the initial reaction is an intermediate where a disulfide bond is formed between the attacking thiolate and cPxSSPx-1 (P4 in Fig. 2). A second thiolate then cleaves the intermediate to form a disulfide with the first thiol, concomitantly liberating the dithiol form of cPxSSPx-1. It is assumed that the rate of removal of the first thiol (k2) is fast enough to prevent the buildup of the intermediate mixed disulfide species (P4). This is supported by the lack of significant change in the tumbling of the biradical (indicated by a change in peak height of the high field line) and the reactions being first order with respect to thiol. After the disulfide bond in cPxSSPx-1 (P1) is broken, there is rapid interconversion between strongly (P3) and weakly (P2) spin-coupled conformations. Although many intermediate conformations between these extremes may exist, including more than the two extreme conformations did not significantly improve modeling of the EPR spectra.
In the reaction of cPxSSPx-1 with Cys (and to a much lesser extent GSH and MTG) the intensity of the low-field nitroxide line did not decrease monotonically with time. Instead, the intensity change reversed unexpectedly at ~18 minutes into the reaction (Fig. 4, Cys); the reversal was more pronounced at higher concentrations of Cys. Interestingly, protecting the α-amino of Cys with a BOC group (BLC) prevents this behavior (Fig. 4, BLC). The fractional populations of the different radical states as determined by spectral simulation at key points of the reaction curve for Cys (Table 1) suggest that some mechanism causes the reverse reaction to become favored. At the beginning of the reaction, the population of the reduced forms of the biradical are predictably low. At the point of lowest signal intensity, ~18 minutes into the reaction, the reduced biradical (P2 + P3) has increased to 27% of the total population. By the end of the reaction, the initial cyclic state of the biradical is almost completely restored.
Table 1:
Fractional population of the oxidized biradical (P1), the reduced biradical in a strong coupling conformation (P3), and the reduced biradical in a weak coupling conformation (P2) at the start of the reaction (t0), the reaction’s low point (t18), and the end of the reaction (tend) with Cys.
| P1 | P2 | P3 | |
|---|---|---|---|
| t0 | 0.92 | 0.04 | 0.04 |
| t18 | 0.73 | 0.10 | 0.17 |
| tend | 0.88 | 0.06 | 0.06 |
It is likely that the return of signal intensity in the reaction with Cys is due to air oxidation of Cys causing accumulation of the cystine product, thus driving the reaction in the reverse direction. It is well known that thiols can be oxidized in air.27–30 Nyui et al. have shown that Cys can exhibit pronounced biphasic reaction behavior in complex redox systems, and that this autoxidative behavior can be inhibited with N2(g) purging.31 To test this hypothesis, the reaction at the highest concentration of Cys was performed with solutions that were prepared with N2 purging (Fig 5, red trace) or under N2 atmosphere in a glove bag (Fig 5, yellow trace). For both solutions the supporting EPR tube was purged with N2 throughout the reaction. The reversal of the low-field line signal intensity was clearly attenuated when O2 was displaced by bubbling with N2 and was decreased further in the sample prepared under N2 in the glove bag. As these methods of O2 exclusion are imperfect, residual O2 in the samples likely accounts for the remaining biphasic behavior in the experiments conducted under N2. At the highest concentration of GSH slightly biphasic behavior was also observed (Fig 4, GSH). However, the impact of O2 on the reaction time course with GSH was too small to cause detectable changes when the reaction system was purged with N2 using the same technique that was employed for Cys. The much larger effect of O2 on the reaction course for Cys than for GSH is consistent with literature reports that Cys is more susceptible to air oxidation than GSH.31
Figure 5:
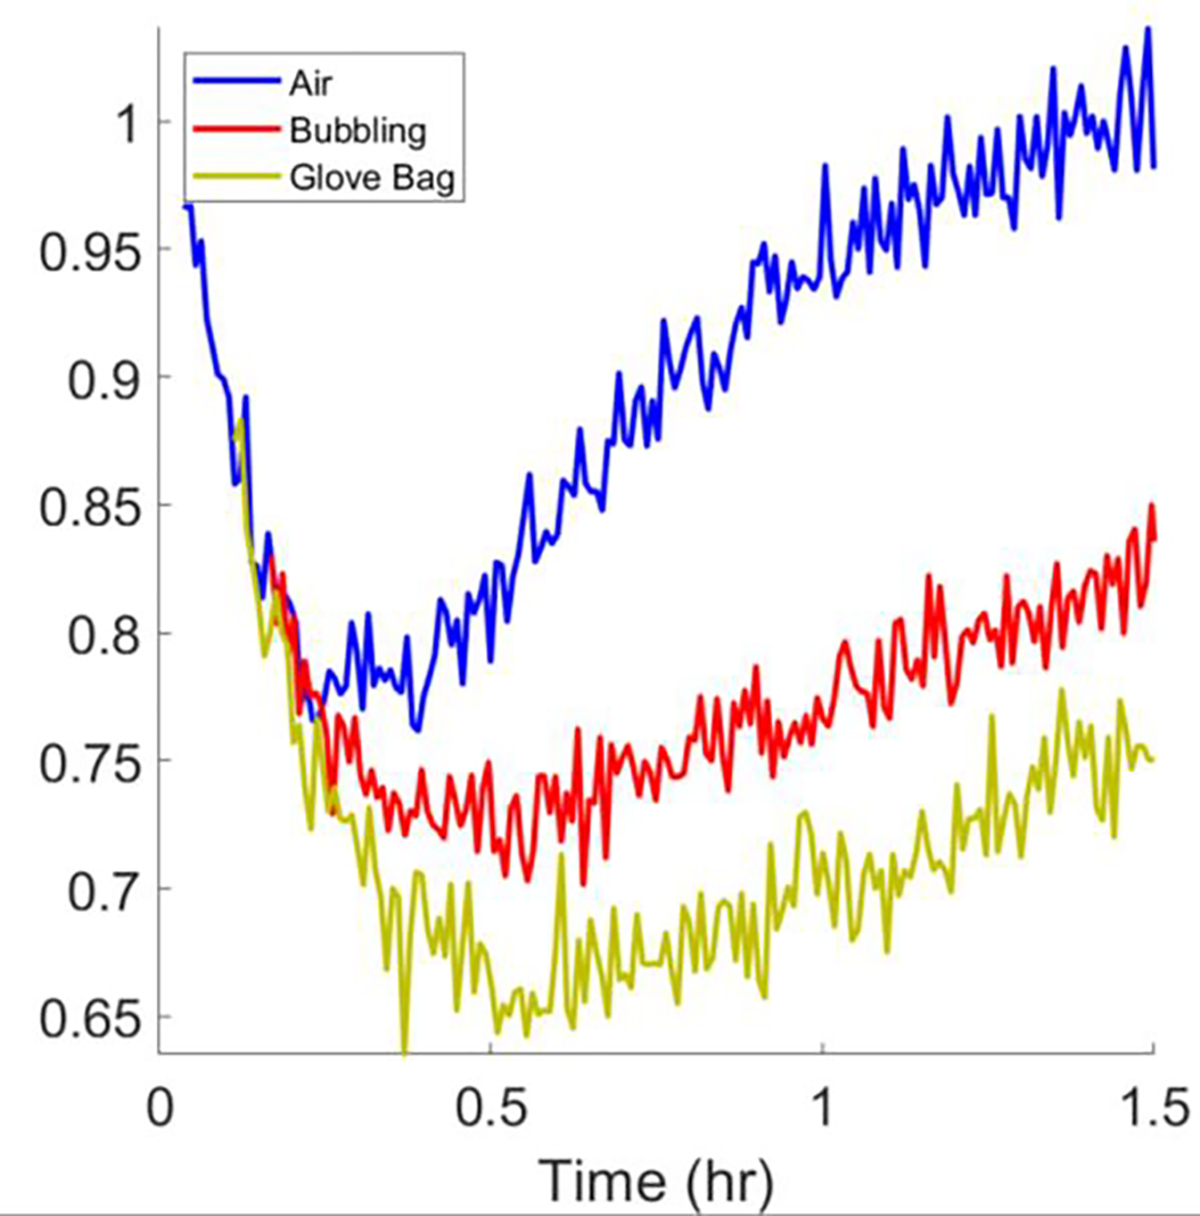
Time dependence of intensity of the low-field line in the X-Band spectra of cPxSSPx-1 reacting with 15.9 mM Cys under air, with N2 bubbling, or under N2 atmosphere in a glove bag. After initiation of the reaction, the delays in starting data acquisition were 2, 5, and 8 min, for air, N2-bubbled, and N2 glove bag cases, respectively.
Equilibrium of the GSH Reaction.
The cPxSSPx-1 probe was designed to report physiological thiol redox status; therefore, its response to [GSH] equilibrium is of special interest. It was initially assumed that calculating the equilibrium concentrations as described in equations (3) and (4) would provide an accurate description of the equilibrium relationship of the GSH and cycPxSSPx-1. However, based on the known behavior of GSH in the presence of oxygen, the biphasic behavior of the observed reactions, and the dependence of on [] we concluded that direct O2 oxidation of the GSH was contributing to the pool of GSSG and this in turn effected the equilibrium. To estimate the GSSG produced (and by extension the GSH consumed) by oxygen, we assumed that the oxygen available for reaction was fixed at the concentration predicted by the solubility of O2 in water. The solubility can be calculated from Henry’s law constant which for O2 in water is 0.0013 mol/(kg·bar) at 298 K.32 Taking account of the partial pressure of O2 (0.21) and the atmospheric pressure in Denver, Colorado (0.85 bar), [O2] at the start of the reaction is 0.23 mM. For each [] we adjusted the fraction that reacted with O2 to obtain constant value of within reasonable error and consuming less than 0.23 mM dissolved O2. For each [] the concentrations of each species in Eq. (7)–(9) at equilibrium are listed in Table S5. The result of these calculations was of 1.6 ± 0.1 M−1. This analysis agrees well with the linear least-squares fit to the log-log plot in Fig. 6, whose y-intercept yielded of 1.5 ± 0.1 M−1. This well-defined dependence of the ratio of reduced to oxidized probe on [] and [] (Fig. 6) demonstrates that cPxSSPx-1 is useful as a redox sensor.
Figure 6:

Dependence of the equilibrium ratio of the concentrations of cleaved (reduced) and uncleaved (oxidized) cPxSSPx-1 on equilibrium ratio of []2 to []. The populations of biradical were calculated from simulations and the values on the abscissa were calculated using Eq. 9. Blue symbols are data (mean ± SE); red line is the least-squares linear fit to the data. Concentration is in mM.
Imaging.
A long-term goal of this work is monitoring redox in vivo. X-Band (ca. 9.5 GHz) is the most widely used frequency for in vitro nitroxide experiments. However, penetration depth and heating of the animal are concerns for in vivo imaging at X-band.33,34 Frequencies as low as 250 MHz have been used for in vivo imaging.35–38 Experiments at 250 MHz have greatly reduced signal-to-noise ratio (S/N) which, in lossy samples, scales linearly with excitation frequency when sample volume is kept constant.33 Operating frequencies near 1 GHz have been used successfully for in vivo EPR imaging of small animals and constitute a reasonable compromise in S/N and penetration depth. Rapid-scan EPR has been shown to substantially increase S/N relative to traditional techniques, making low frequency imaging more feasible.10,39–45 The spectral changes due to reaction of cPxSSPx-1 with GSH were demonstrated in images of a 2-compartment phantom at 1 GHz. Slices through images obtained before and after reduction are compared in Fig. 7. Reduction with GSH gave rise to spin-spin interaction peaks at ca. 34.5 and 36 mT and a corresponding decrease in the intensity of the low-field line relative to that for an 15N,d13-reference sample in a separate compartment. The ability to image the lineshape changes should permit spatial localization of tissue redox status.
Figure 7:

Images (A, B) of a 2-compartment phantom (C) with 0.1 mM cPxSSPx-1 in the upper cylinder and a reference sample of 0.1 mM 15N,d13-CTPO in the lower cylinder. The images were acquired before (A) and after (B) reaction with 26.9 mM GSH. Non-gradient spectra (black lines) before (D) and after (E) reaction with GSH show the decrease in intensity of the low-field line relative to that for the reference 15N signal (marked with *). Derivatives of spectral slices through the center of the upper compartment are shown as red dotted lines in (D) and (E). Positions of spectral slices through the images are shown by red dotted lines overlayed on images in A and B.
Summary
GSH is the predominant cellular antioxidant and its concentration is an important physiologic parameter. We show here that the cyclic disulfide-bridged dinitroxide probe, cPxSSPx-1, reports GSH concentration and is thus a viable probe for use in EPR imaging of physiologic thiol redox status.
Supplementary Material
Acknowledgments
Support of this work by National Institutes of Health R01 CA262159 (GRE) and R33 HL157907 (SSE) is gratefully acknowledged.
Footnotes
Supporting Information
Calculation of fractional populations of the thiolate forms using microscopic pKa values; parameters used in simulations of equilibrium spectra for reactions of GSH with cPxSSPx-1; EPR spectra at equilibrium for reaction of GSH with cPxSSPx-1; reaction of O2 with GSH.
References
- (1).Forman HJ; Zhang H; Rinna A Glutathione: Overview of Its Protective Roles, Measurement, and Biosynthesis. Mol. Aspects Med. 2009, 30 (1–2), 1–12. 10.1016/j.mam.2008.08.006. [DOI] [PMC free article] [PubMed] [Google Scholar]
- (2).Blair I Endogenous Glutathione Adducts. Curr. Drug Metab. 2006, 7 (8), 853–872. 10.2174/138920006779010601. [DOI] [PubMed] [Google Scholar]
- (3).Hayes JD; Flanagan JU; Jowsey IR Glutathione Transferases. Annu. Rev. Pharmacol. Toxicol. 2005, 45 (1), 51–88. 10.1146/annurev.pharmtox.45.120403.095857. [DOI] [PubMed] [Google Scholar]
- (4).Cook JA; Gius D; Wink DA; Krishna MC; Russo A; Mitchell JB Oxidative Stress, Redox, and the Tumor Microenvironment. Semin. Radiat. Oncol. 2004, 14 (3), 259–266. 10.1016/j.semradonc.2004.04.001. [DOI] [PubMed] [Google Scholar]
- (5).Khramtsov VV; Yelinova (Popova) VI; Weiner LM; Berezina TA; Martin VV; Volodarsky LB. Quantitative Determination of SH Groups in Low- and High-Molecular-Weight Compounds by an Electron Spin Resonance Method. Anal. Biochem. 1989, 182 (1), 58–63. 10.1016/0003-2697(89)90718-5. [DOI] [PubMed] [Google Scholar]
- (6).Khramtsov VV; Yelinova VI; Glazachev YI; Reznikov VA; Zimmer G Quantitative Determination and Reversible Modification of Thiols Using Imidazolidine Biradical Disulfide Label. J. Biochem. Biophys. Methods 1997, 35 (2), 115–128. 10.1016/S0165-022X(97)00035-3. [DOI] [PubMed] [Google Scholar]
- (7).Legenzov EA; Sims SJ; Dirda NDA; Rosen GM; Kao JPY Disulfide-Linked Dinitroxides for Monitoring Cellular Thiol Redox Status through Electron Paramagnetic Resonance Spectroscopy. Biochemistry 2015, 54 (47), 6973–6982. 10.1021/acs.biochem.5b00531. [DOI] [PubMed] [Google Scholar]
- (8).Elajaili H; Biller JR; Rosen GM; Kao JPY; Tseytlin M; Buchanan LA; Rinard GA; Quine RW; McPeak J; Shi Y et al. Imaging Disulfide Dinitroxides at 250 MHz to Monitor Thiol Redox Status. J. Magn. Reson. 2015, 260, 77–82. 10.1016/j.jmr.2015.08.027. [DOI] [PMC free article] [PubMed] [Google Scholar]
- (9).Bobko AA; Eubank TD; Voorhees JL; Efimova OV; Kirilyuk IA; Petryakov S; Trofimiov DG; Marsh CB; Zweier JL; Grigor’Ev IA et al. In Vivo Monitoring of pH, Redox Status, and Glutathione Using L-Band EPR for Assessment of Therapeutic Effectiveness in Solid Tumors. Magn. Reson. Med. 2012, 67 (6), 1827–1836. 10.1002/mrm.23196. [DOI] [PMC free article] [PubMed] [Google Scholar]
- (10).Epel B; Sundramoorthy SV; Krzykawska-Serda M; Maggio MC; Tseytlin M; Eaton GR; Eaton SS; Rosen GM; Kao JPY; Halpern HJ Imaging Thiol Redox Status in Murine Tumors in Vivo with Rapid-Scan Electron Paramagnetic Resonance. J. Magn. Reson. 2017, 276, 31–36. 10.1016/j.jmr.2016.12.015. [DOI] [PMC free article] [PubMed] [Google Scholar]
- (11).Tseitlin M; Biller JR; Elajaili H; Khramtsov VV; Dhimitruka I; Eaton GR; Eaton SS New Spectral–Spatial Imaging Algorithm for Full EPR Spectra of Multiline Nitroxides and pH Sensitive Trityl Radicals. J. Magn. Reson. 2014, 245, 150–155. 10.1016/j.jmr.2014.05.013. [DOI] [PMC free article] [PubMed] [Google Scholar]
- (12).Sankarapandi S; Chandramouli GVR; Daul C; Manoharan PT Fast Computation of Dynamic EPR Spectra of Biradicals. J. Magn. Reson. - Ser. A 1993, 103 (2), 163–170. 10.1006/jmra.1993.1147. [DOI] [Google Scholar]
- (13).Eaton SS; Woodcock LB; Eaton GR Continuous Wave Electron Paramagnetic Resonance of Nitroxide Biradicals in Fluid Solution. Concepts Magn. Reson. Part A 2018, 47A (2), e21426. 10.1002/cmr.a.21426. [DOI] [PMC free article] [PubMed] [Google Scholar]
- (14).Fava A; Reichenbach G; Peron U Kinetics of the Thiol-Disulfide Exchange. II. Oxygen-Promoted Free-Radical Exchange between Aromatic Thiols and Disulfides. J. Am. Chem. Soc. 1967, 89 (25), 6696–6700. 10.1021/ja01001a052. [DOI] [Google Scholar]
- (15).Eldjarn L; Pihl A On the Mode of Action of X-Ray Protective Agents. II. Interaction between Biologically Important Thiols and Disulfides. J. Biol. Chem. 1957, 225 (1), 499–510. 10.1016/S0021-9258(18)64947-6. [DOI] [PubMed] [Google Scholar]
- (16).Singh R; Whitesides GM Thiol-Disulfide Interchange. In Sulphur-Containing Functional Groups (1993); John Wiley & Sons, Inc.: Chichester, UK, 1993; pp 633–658. 10.1002/9780470034408.ch13. [DOI] [Google Scholar]
- (17).Noszál B; Visky D; Kraszni M Population, Acid-Base, and Redox Properties of N-Acetylcysteine Conformers. J. Med. Chem. 2000, 43 (11), 2176–2182. 10.1021/jm9909600. [DOI] [PubMed] [Google Scholar]
- (18).Buchanan LA; Rinard GA; Quine RW; Eaton SS; Eaton GR Tabletop 700 MHz Electron Paramagnetic Resonance Imaging Spectrometer. Concepts Magn. Reson. Part B Magn. Reson. Eng. 2018, 48B (2), e21384. 10.1002/cmr.b.21384. [DOI] [PMC free article] [PubMed] [Google Scholar]
- (19).Hyde JS; Pasenkiewicz-Gierula M; Jesmanowicz A; Antholine WE Pseudo Field Modulation in EPR Spectroscopy. Appl. Magn. Reson. 1990, 1 (3), 483–496. 10.1007/BF03166028. [DOI] [Google Scholar]
- (20).Bednar RA Reactivity and pH Dependence of Thiol Conjugation to N-Ethylmaleimide: Detection of a Conformational Change in Chalcone Isomerase. Biochemistry 1990, 29 (15), 3684–3690. 10.1021/bi00467a014. [DOI] [PubMed] [Google Scholar]
- (21).Crampton MR Acidity and Hydrogen-Bonding. In The Chemistry of the Thiol Group; Patai S, Ed.; John Wiley & Sons, 1974; pp 397–415. [Google Scholar]
- (22).Laitinen HA; Harris WE Acid-Base Equilibria in Water. In Chemical Analysis: An Advanced Text and Reference; McGraw-Hill, 1975; pp 26–55. [Google Scholar]
- (23).Ueno M; Sekine-Suzuki E; Nyui M; Nakanishi I; Matsumoto K Amplification of Glutathione-Mediated Oxidative Stress by Catalase in an Aqueous Solution at Hyperthermal Temperatures. J. Clin. Biochem. Nutr. 2017, 60 (2), 93–99. 10.3164/jcbn.16-28. [DOI] [PMC free article] [PubMed] [Google Scholar]
- (24).Gilbert HF Thiol/Disulfide Exchange Equilibria and Disulfidebond Stability. In Methods in Enzymology; 1995; Vol. 251, pp 8–28. 10.1016/0076-6879(95)51107-5. [DOI] [PubMed] [Google Scholar]
- (25).Bach RD; Dmitrenko O; Thorpe C Mechanism of Thiolate-Disulfide Interchange Reactions in Biochemistry. J. Org. Chem. 2008, 73 (1), 12–21. 10.1021/jo702051f. [DOI] [PubMed] [Google Scholar]
- (26).Rosenfield RE; Parthasarathy R; Dunitz JD Directional Preferences of Nonbonded Atomic Contacts with Divalent Sulfur. 1. Electrophiles and Nucleophiles. J. Am. Chem. Soc. 1977, 99 (14), 4860–4862. 10.1021/ja00456a072. [DOI] [Google Scholar]
- (27).Cecil R; Mcphee JR The Sulfur Chemistry of Proteins. Adv. Protein Chem. 1959, 14 (C), 255–389. 10.1016/S0065-3233(08)60613-0. [DOI] [PubMed] [Google Scholar]
- (28).Tarbell DS The Mechanism of Oxidation of Thiols To Disulfides. In Organic Sulfur Compounds; Kharasch N, Ed.; Pergamon Press Inc., 1961; pp 97–102. 10.1016/b978-1-4831-9982-5.50013-0. [DOI] [Google Scholar]
- (29).Liu T-Y The Role of Sulfur in Proteins. In The Proteins, Volume 3; Neurath H, Hill RL, Eds.; Elsevier, 1977; pp 239–402. 10.1016/B978-0-12-516303-3.50008-7. [DOI] [Google Scholar]
- (30).Ralph TR; Hitchman ML; Millington JP; Walsh FC The Electrochemistry of L-Cystine and L-Cysteine. Part 1: Thermodynamic and Kinetic Studies. J. Electroanal. Chem. 1994, 375 (1–2), 1–15. 10.1016/0022-0728(94)03407-9. [DOI] [Google Scholar]
- (31).Nyui M; Shoji Y; Ueno M; Nakanishi I; Matsumoto K Reduction of Molecular Oxygen by Redox Active Thiols: Comparison of Glutathione, N-Acetylcysteine, Cysteine, and Homocysteine. J. Clin. Biochem. Nutr. 2019, 65 (3), 185–192. 10.3164/jcbn.19-25. [DOI] [PMC free article] [PubMed] [Google Scholar]
- (32).Oxygen. NIST Standard Reference Database 69: NIST Chemistry WebBook. https://webbook.nist.gov/cgi/cbook.cgi?ID=C7782447&Mask=10 (accessed 2023-03-31). [Google Scholar]
- (33).Rinard GA; Quine RW; Eaton SS; Eaton GR Frequency Dependence of EPR Sensitivity. In Biological Magnetic Resonance 21; 2004; pp 115–154. 10.1007/978-1-4419-8951-2_3. [DOI] [Google Scholar]
- (34).Halpern HH; Bowman MK Low Frequency EPR Spectrometers: MHz Range. In EPR Imaging and In Vivo EPR; Eaton GR, Eaton SS, Ohno K, Eds.; CRC Press: Boca Raton FL, 1991; pp 45–63 10.1201/9781351071888. [DOI] [Google Scholar]
- (35).Quine RW; Rinard GA; Eaton SS; Eaton GR A Pulsed and Continuous Wave 250 MHz Electron Paramagnetic Resonance Spectrometer. Concepts Magn. Reson. 2002, 15 (1), 59–91. 10.1002/cmr.10020. [DOI] [PMC free article] [PubMed] [Google Scholar]
- (36).Epel B; Sundramoorthy SV; Barth ED; Mailer C; Halpern HJ Comparison of 250 MHz Electron Spin Echo and Continuous Wave Oxygen EPR Imaging Methods for in Vivo Applications. Med. Phys. 2011, 38 (4), 2045–2052. 10.1118/1.3555297. [DOI] [PMC free article] [PubMed] [Google Scholar]
- (37).Subramanian S; Krishna MC Time-Domain Radio Frequency EPR Imaging. Biomed. EPR, Part A Free Radicals, Met. Med. Physiol. 2006, 321–382. 10.1007/0-387-26741-7_12. [DOI] [Google Scholar]
- (38).Eaton GR; Eaton SS EPR Spectrometers at Frequencies Below X-Band. In Biological Magnetic Resonance 21; 2004; pp 59–114. 10.1007/978-1-4419-8951-2_2. [DOI] [Google Scholar]
- (39).Stoner JW; Szymanski D; Eaton SS; Quine RW; Rinard GA; Eaton GR Direct-Detected Rapid-Scan EPR at 250 MHz. J. Magn. Reson. 2004, 170 (1), 127–135. 10.1016/j.jmr.2004.06.008. [DOI] [PubMed] [Google Scholar]
- (40).Mitchell DG; Quine RW; Tseitlin M; Meyer V; Eaton SS; Eaton GR Comparison of Continuous Wave, Spin Echo, and Rapid Scan EPR of Irradiated Fused Quartz. Radiat. Meas. 2011, 46 (9), 993–996. 10.1016/j.radmeas.2011.03.035. [DOI] [PMC free article] [PubMed] [Google Scholar]
- (41).Eaton SS; Quine RW; Tseitlin M; Mitchell DG; Rinard GA; Eaton GR Rapid-Scan Electron Paramagnetic Resonance. In Multifrequency Electron Paramagnetic Resonance: Data and Techniques; Misra SK, Ed.; Wiley-VCH Verlag, 2014; pp 3–67. [Google Scholar]
- (42).Eaton GR; Eaton SS Rapid-Scan Electron Paramagnetic Resonance. In eMagRes; John Wiley & Sons, Ltd: Chichester, UK, 2016; Vol. 5, pp 1529–1542. 10.1002/9780470034590.emrstm1522. [DOI] [Google Scholar]
- (43).Khramtsov VV; Bobko AA; Tseytlin M; Driesschaert B Exchange Phenomena in the Electron Paramagnetic Resonance Spectra of the Nitroxyl and Trityl Radicals: Multifunctional Spectroscopy and Imaging of Local Chemical Microenvironment. Anal. Chem. 2017, 89 (9), 4758–4771. 10.1021/acs.analchem.6b03796. [DOI] [PMC free article] [PubMed] [Google Scholar]
- (44).Sato-Akaba H; Tseytlin M Development of an L-Band Rapid Scan EPR Digital Console. J. Magn. Reson. 2019, 304, 42–52. 10.1016/j.jmr.2019.05.003. [DOI] [PMC free article] [PubMed] [Google Scholar]
- (45).Subramanian S; Koscielniak JW; Devasahayam N; Pursley RH; Pohida TJ; Krishna MC A New Strategy for Fast Radiofrequency CW EPR Imaging: Direct Detection with Rapid Scan and Rotating Gradients. J. Magn. Reson. 2007, 186 (2), 212–219. 10.1016/j.jmr.2007.01.023. [DOI] [PMC free article] [PubMed] [Google Scholar]
Associated Data
This section collects any data citations, data availability statements, or supplementary materials included in this article.