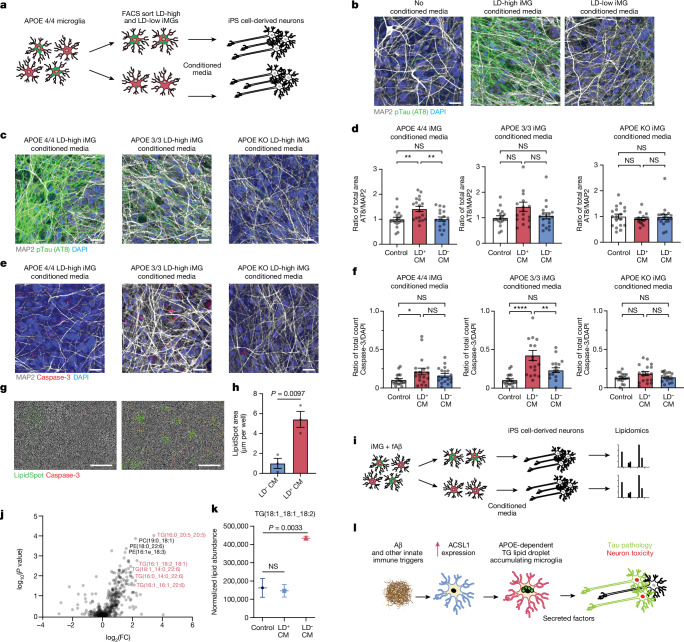
Fig. 4. LD+ microglia induce Tau phosphorylation and apoptosis in neurons.
a, Schematic of LDAM-specific conditioned media (CM) exposure to neurons. b, Immunofluorescence images of iPS cell-derived neurons exposed to no CM (left), LD+ APOE4/4 iMG-CM (middle) and LD− APOE4/4 iMG-CM (left). Cells were stained for DAPI (blue), MAP2 (grey) and pTau (AT8, green). Scale bars, 20 μm. c, Immunofluorescence images of iPS cell-derived neurons exposed to LD+ APOE4/4 iMG-CM (left), LD+ APOE3/3 iMG-CM (middle), LD+ APOE-KO iMG-CM (right). Cells were stained for DAPI (blue), MAP2 (grey) and pTau (AT8, green). Scale bars, 20 μm. Data replicated in at least two independent experiments. d, Quantification of images as presented in c. Each dot represents a random filed image (n = 18) across three replicate wells per condition; one-way ANOVA; mean ± s.e.m. e, Immunofluorescence images of iPS cell-derived neurons under conditions in c stained for DAPI (blue), MAP2 (grey) and cleaved caspase-3 (red). Scale bars, 20 μm. f, Quantification of images as presented in e. Each dot represents a random filed image (n = 18) across three replicate wells per condition; one-way ANOVA; mean ± s.e.m. g, Images of neurons exposed to LD− APOE4/4 iMG-CM (left) and LD+ APOE4/4 iMG-CM (right). Cells were stained with LipidSpot (green) and activated caspase-3 dye (red). Scale bars, 200 μm. h, Quantification LipidSpot fluorescence (n = 4 replicate wells per condition; two-sided t-test; mean ± s.e.m). i, Schematic of lipidomics experimental design of neurons treated with CM. j, Volcano plot representing lipids detected in neurons after treatment of LD+ iMG-CMa versus LD− iMG-CM. Triglyceride species are highlighted in red. k, Lipidomic measurements of one lipid species detected in lipidomic analysis. Individual dots represent replicate wells (n = 3 replicate wells per condition; one-way ANOVA; mean ± s.e.m). l, Schematic of the proposed role of LD+ microglia in neurodegeneration. *P < 0.01, **P < 0.001, ****P < 0.0001.

