Abstract
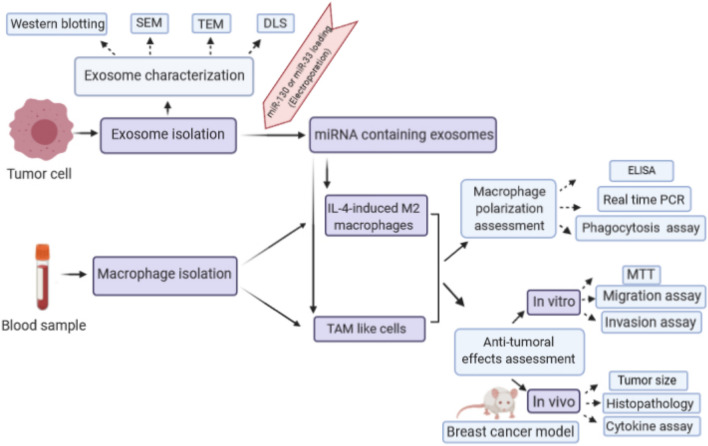
In the tumor microenvironment, macrophages polarize into the M2 phenotype to facilitate tumorigenesis. Tumor-derived exosomes can act as mediators between the tumor microenvironment and stromal cells by transporting proteins, mRNAs, and miRNAs. Exosomal miRNAs play a pivotal role in modulating tumor microenvironment and macrophage polarization. Here, we overexpressed miR-130 and miR-33 in exosomes of MDA-MB-231 cells and investigated their effect on macrophage polarization and tumor progression. For this purpose, exosomes were extracted from MDA-MB-231 cells and characterized using dynamic light scattering, electron microscopy, and western blotting of exosomal markers. Then, miR-130 or miR-33 containing exosomes were used to treat IL4-induced M2 or tumor-associated macrophages (TAMs). After treatment, the polarization status of macrophages, including the expression of M1 specific genes, and the secretion of cytokines were evaluated. Finally, the conditioned medium from exosome-treated macrophages was incubated with cancer cells to evaluate its effect on the migration and invasion ability of cancer cells and, in vivo experiments investigated the effect of exosome-treated macrophages on breast cancer progression. Exosomes characterization results approved the range of size and homogeneity of extracted exosomes. Overexpression of miR-130 and miR-33 in exosomes increased the expression of M1 signature genes (IRF5, MCP1, CD80) and secretion of cytokines (IL-1β and TNF-α) as well as yeast phagocytic activity of macrophages. Besides, the conditioned medium of macrophages treated with miRNA containing exosomes declined the migration and invasion ability of cancer cells. The in vivo results indicated the inhibitory effect of exosome-treated macrophages on tumor growth. Furthermore, the results showed that in response to exosome-treated macrophages, the production of TNF-α by spleen cells increased, while the production of IL-10 and TGF-β by these cells decreased. These findings suggest that overexpression of miR-130 and miR-33 in exosomes can decrease tumor progression by shifting macrophage polarization from M2 to M1 phenotype and can be a potential therapeutic strategy for tumor interventions.
Graphic abstract
Keywords: Breast cancer, Exosome, Tumor-associated macrophage, Macrophage polarization, miRNA
Introduction
Breast cancer is the most prevailed malignancy in women worldwide and accounts for 30% of newly diagnosed cancer cases in women [1]. Despite advancements in its early detection and treatment, the incidence and mortality rate of breast cancer are increasing. Therefore, understanding the molecular mechanism of cancer development is required for better diagnosis and prognosis. Tumor mass is not just a population of malignant cells. It contains endothelial cells, fibroblasts, mesenchymal stem cells (MSCs), immune cells, as well as secreted factors and extracellular matrix proteins. It is collectively known as the tumor microenvironment (TME) and has a critical role in tumor growth and metastasis [2]. Macrophages are one of the most abundant immune cells in TME. In response to a wide variety of microenvironmental signals, they can shift from classically activated (M1) into alternatively activated (M2) macrophages [3]. The Th1 cytokine interferon-γ, lipopolysaccharide (LPS), and Toll-like receptor (TLR) agonists can polarize macrophages into the M1 phenotype. M1 macrophages are involved in pro-inflammatory, microbicidal, and anti-tumor processes. They are characterized by high production of pro-inflammatory interleukins, such as interleukin-6 (IL-6), IL-12, IL-23, and tumor necrosis factor-alpha (TNF-α), their ability to present antigens, and production of toxic intermediates, including nitric oxide (NO) and reactive oxygen intermediates (ROI) [4]. The M2 phenotype is driven by IL-4, IL-13, and transforming growth factor-beta (TGF-β). This phenotype is characterized by the production of anti-inflammatory cytokines, such as IL-10, high expression of scavenging receptors, and development of Th2 responses [5]. Unlike the M1 macrophages, M2 macrophages exert anti-inflammatory and tumorigenic responses [4]. In TME macrophages, are termed as tumor-associated macrophages (TAMs). This microenvironment often directs macrophage polarization from the M1 to the M2 state. TAMs regulate the formation, growth, and angiogenesis of cancers by interacting with cancer cells [6]. So, suppression of M2 or induction of M1 phenotype in macrophages could be a therapeutic option in cancer treatment [7]. Some strategies include abrogating the prostaglandin E2, IL-6, and signal transducer and activator of transcription 3(STAT3) activation loop or depriving tumors of growth factors to interfere with M2 macrophage attraction and differentiation [8]. Another strategy is reprogramming of M2 to M1 type using the administration of interferon-gamma (IFN-γ) or forced activation of Notch signaling [9, 10]. Moreover, the significant role of miRNAs has been identified in the regulation of macrophage polarization. MiR-155 was reported to promote M1 macrophage polarization. MiR-155 inhibited CCAAT/enhancer-binding protein beta (C/EBPβ) and interleukin 13 receptor (IL-13R) as an M2-specifying factor and suppressed M2/Th2 response [11]. MiR-125b exhibited the ability to induce M1 polarization by downregulation of IFN regulatory factor 4 [12]. Contrary, miR-124 suppresses the activation of pro-inflammatory macrophages. miR-124 inhibits CCAAT/enhancer-binding protein alpha (C/EBP-α) and PU.1 and promoted M2 phenotype development [13]. MiR-130 and miR-33 were previously found to play a role in M1 macrophage polarization. These miRNAs suppressed M2 polarization by targeting transcription factors peroxisome proliferator-activated receptor gamma (PPARγ) and MafB, respectively, in IL-4/STAT6-dependent manner [14, 15]. In this study, we used exosomes to deliver miR-130 and miR-33 to macrophages. Exosomes are phospholipid membrane vesicles that play a key role in cell–cell communication [16]. Exosomes typically are between 30 and 100 nm, which carry lipids, proteins, DNA, mRNA, miRNA, and other ncRNAs [17]. Exosomes have nanoscale size, express targeting ligands, and deliver bio-macromolecules and exhibit great biocompatibility. Because of these properties, exosomes are emerging as a nanocarrier for delivering drugs and nucleic acid-based molecules [18]. So, in this study, we selected miR-130 and miR-33, which induce M1 polarization. We hypothesized that overexpression of these miRNAs in exosomes could change macrophage polarization into the M1 phenotype to suppress tumor progression.
Materials and methods
miRNA selection
To find miRNAs that mediate M1 macrophage polarization, we first examined the signaling and metabolic pathways involved in this process. The critical factors in these pathways were identified. Then, we used relevant literature and bioinformatic tools (TargetScan, miRWalk, and DIANA tools) to identify miRNAs which target these factors.
Cell culture
MDA-MB-231, human breast cancer cell line, MCF-10A, normal epithelial breast cell line, and 4T1, mouse breast cancer cell line, were purchased from the national cell bank of Pasteur Institute of Iran (Tehran, Iran). The MDA-MB-231 cells and MCF-10A cells were cultured in Dulbecco's Modified Eagle's Medium (DMEM) (Gibco, USA) containing 10% fetal bovine serum (FBS) or horse serum (Gibco, USA), respectively. 4T1 cells were cultured in Roswell Park Memorial Institute 1640 (RPMI-1640) containing 10% FBS. All cells incubated into a humidified atmosphere in 37 °C with 5% CO2.
Exosome isolation
To prepare the conditioned medium for exosomes isolation, MDA-MB-231 cells and MCF-10A cells separately were seeded at 2 × 10⁶ cells/75 cm2, when cell density reached an average of 80% confluence, the medium was replaced with serum-free medium containing Insulin-Transferrin-Selenium (ITS, Thermofisher, USA). Then, the supernatant was collected after 48 h (h). Exosomes were isolated using the EXOCIB kit (Cibbiotech, Iran) according to the manufacturer’s instructions. The extracted exosomes were quantified by their total protein content using Bicinchoninic Acid (BCA) protein assay kit (Ariatous, Mashad, Iran) and stored at – 80 °C until use.
Exosome characterization
Dynamic light scattering (DLS)
To determine the size distribution and homogeneity of extracted exosomes, Dynamic light scattering (DLS) analysis was performed using a DLS Zetasizer (Malvern, Worcestershire, UK). Data were analyzed by the Malvern software (Zetasizer Ver. 7.11).
Scanning electron microscopy (SEM)
Scanning electron microscopy (SEM) was used to evaluate the size and morphology of exosomes. A drop of 5μL of diluted exosome in PBS was deposited on a sterile glass slide and dried at room temperature. Then, it was visualized under a scanning electron microscope (KYKY-EM3200, Beijing, China).
Transmission electron microscopy (TEM)
20μL of MDA-MB-231-derived exosomes was placed in 50μL of 2% agarose gel. Then, the sample was transferred into 3.7% formaldehyde and sent to the macroscopy division in the Biophysics Department (Shahid Beheshti University of Medical Sciences, Tehran, Iran) for further processing and imaging.
Western blot analysis of exosome markers
Exosomes were mixed with an equal volume of radioimmunoprecipitation assay (RIPA) lysis buffer containing Phenyl methyl sulfonyl fluoride (PMSF) and boiled at 95 °C for 5 min. 40 μg of protein was run in 12% sodium dodecyl sulfate–polyacrylamide gel electrophoresis (SDS-PAGE). For western blot analysis, protein samples were transferred to a nitrocellulose membrane using a semi-dry transfer system (Trans-Blot®SD, Bio-Rad, USA) and blocked in 3% skim milk in Tris-buffered saline solution with tween 20 for 3 h. Membranes were then incubated with primary antibodies, including CD63 (1:1,000) (Purified anti-human CD63, BioLegend, Italy) and anti-human CD81 (1:1,000) (Purified anti-human CD81, BioLegend, Italy). Then, nitrocellulose membrane was incubated with Horseradish peroxidase (HRP)-conjugated secondary antibodies. Finally, the enhanced chemiluminescent (ECL) detection system (Amersham PharmaciaBiotech, Buckinghamshire, UK) was used to visualize signals.
Exosome staining
To study exosomes uptake, isolated exosomes were stained with PKH67 green fluorescent dye (Sigma-Aldrich, Missouri, USA) according to the manufacturer's protocol with some modification. Briefly, 3 μL of PKH67 was diluted in 500 μL of diluent C. Then, 100 μg of suspended exosomes in an equal volume of diluent C (500 μL) was added to the dye solution. 5 min incubation was performed at 37 ºC. To stop the reaction, 250 μL of FBS was added for 1 min. Subsequently, stained exosomes were separated using an exosome extraction kit. After overnight incubation, stained exosomes were diluted to 50 μL of distilled PBS and were added to cells cultured in the glass bottom chamber slides. 24 h after treatment, the cells were washed with PBS and fixed using paraformaldehyde. Microscopic analyses were performed using a confocal laser scanning microscope (Leica TCS SPE, US).
Peripheral blood macrophage isolation and culture
Peripheral blood samples were obtained from healthy donors (ethics code: IR.SBMU.RETECH.REC.1396.353). 10 ml heparinized blood was used for peripheral blood mononuclear cells (PBMC) isolation using the Ficol density gradient according to the standard protocol with some modifications [19]. Afterward, monocytes were isolated from PBMCs using the plastic adherence method. In this method, PBMCs were distributed in a cell culture flask or plate at 37 °C and 5% CO2 and allowed to adhere for 3.5 h. Subsequently, non-adherent cells were removed, and adherent monocytes were cultured in RPMI-1640 (Gibco, NY, USA) containing 10% FBS. 50 ng/ml macrophage colony-stimulating factor (M-CSF) (PeoroTech, USA) was also applied to differentiated monocytes to macrophages.
Flow cytometry analyses of peripheral blood monocytes
Immunofluorescence analysis was performed by fluorescein isothiocyanate (FITC)-conjugated mouse antibody against CD14. The monocytes were harvested and washed with PBS, then labeled with CD14 monoclonal antibody (BD, CA, USA). The antibody-labeled monocytes were detected using a flow cytometer, and the data were analyzed using FlowJo software (Tree Star, Inc., USA).
In vitro M1, M2, and TAM generation and characterization
To induce M1 polarization, cells were treated 24 h with 100 ng/ml lipopolysaccharide (LPS) (Merc, Germany), and to promote M2 polarization, cells were stimulated with 20 ng/ml IL4 (Merc, Germany) for 24 h. To generate TAM, monocytes were cultured for 7 days in RPMI-1640 10% FBS and 50% of conditioned medium from MDA-MB-231 cells. Then, we analyzed the expression of M1 markers, including IRF5, MCP1 and, CD80, and M2 markers, including Arg, TGM2 and, CD206 by real-time PCR. For this purpose, total RNA from macrophages was extracted using Hybrid-R™ (GeneAll, Korea). RNA was reverse-transcribed using random hexamer and oligo (dT) primers. Quantitative real-time PCR was performed using SYBR Green I in the StepOnePlus™ Real-Time PCR System. The final volume of each reaction was 20µL, and all experiments were done in duplicates. GAPDH housekeeping gene was used to normalize the relative expression of mRNAs. Relative expressions were calculated according to the ΔΔCt method.
Loading exosomes with miRNA mimic
Exosomes were diluted in a 1:1 ratio in electroporation buffer. miRNA mimic (miR-130 and miR-33) (Bioneer, Korea) at a final concentration of 100 pmol was added to 0.5 μg/μL of exosomes. The mixture was loaded into a cold 0.2 cm electroporation cuvette, and electroporation was done at 0.200 kV using an Eppendorf AG 22331 electroporation instrument (Eppendorf, Humburg, Germany). The experimental groups consisted of exosomes that have been received miR-130 mimic or miR-33 mimic or both of them. Furthermore, a group of exosomes was electroporated with miRNA negative control (scramble).
Experimental groups
All evaluations in this study were done in the following group. IL4-induced M2 macrophage and TAM were treated with miR-130-loaded exosomes, miR-33-loaded exosomes, miR-130 + miR-33-loaded exosomes, scramble-loaded exosomes, and exosomes of MDA-MB-231 without miRNA. In the control group, we had IL4-induced M2 macrophage and TAM without adding exosomes.
RNA extraction and real-time reverse transcription PCR
After the treatment of macrophages with modified exosomes for 48 h, total RNA from macrophages was extracted using Hybrid-R™ (GeneAll, Korea). For miRNA and gene expression analyses, RNA was reverse-transcribed using stem-loop and random hexamer primers, respectively, according to the previous experiments [20]. Quantitative real-time PCR was performed using the TaqMan probe for miRNAs and SYBR Green I for target genes in the StepOnePlus™ Real-Time PCR System. The final volume of each reaction was 20µL, and all experiments were done in duplicates. SNORD47 and GAPDH housekeeping genes were used to normalize the relative expression of miRNAs and mRNAs, respectively. Relative expression was calculated according to the ΔΔCt method.
Enzyme-linked immunosorbent assay (ELISA)
After the treatment of macrophages with miRNA-loaded exosomes, the cell culture supernatant was collected, and levels of IL-10, TGF-β, IL1-β and, TNF-α were measured using DuoSet® ELISA Development Systems (R&D Systems, Minneapolis, MN, USA) according to the manufacturer’s protocol.
Phagocytosis assay of yeast particles
To evaluate the phagocytosis ability of macrophages, dry yeast particles were diluted in RPMI-1640 medium to obtain 108 particles/ml. Macrophages were treated with 100μL of this suspension in a 1:10 ratio for 1 h at 37 °C. Then, cells were washed to remove non-internalized particles. Finally, cells were stained with Giemsa dye, and at least 200 cells were counted to report mean phagocytosis percent.
MTT (3-(4, 5-Dimethylthiazol-2-yl)-2, 5-diphenyltetrazolium bromide) assay
MDA-MB-231 cells were cultured in a 96-well plate and allowed to grow to 80% confluent. Then, the medium was removed, and the conditioned medium of differently treated macrophages was added. After 72 h, the medium was replaced with fresh media containing 50 µL (2 mg/ml in PBS) of MTT solution, and cells were incubated for 4 h. Finally, the mixture of medium/MTT was replaced with DMSO, and after 30 min, the absorbance was measured at 570 nm.
Cell migration assay
To evaluate the effect of exosomes on MDA-MB-231 cell migration, transwell chambers (SPL, Korea) with 8 μm inserts were utilized. 1 × 10⁵ MDA-MB-231 cells were deposited in the top chambers with a serum-free medium. The bottom chamber was filled with the conditioned medium of differently treated macrophages. After 24 h incubation, non-migrating cells were removed by a cotton-tipped applicator and migrated cell fixed with methanol and stained with crystal violet. The number of the migrated cells was counted in five randomly-chosen fields, and the mean of migrated cells was reported.
Cell invasion assay
Cell invasion was evaluated with the transwell system (SPL, Korea). At first, top chamber was coated with the extracellular matrix and stored at 37 °C to solidify. MDA-MB-231 cells were plated in the upper chamber in the serum-free medium. The conditioned medium of differently treated macrophages was added to the lower chamber. After 24 h of incubation, a cotton-tipped applicator was used to remove upper chamber cells, and invaded cells were fixed and stained with crystal violet. The invasion ability of MDA-MB-231 was determined by counting the number of invading cells. The number of invading cells was counted in five random fields, and the mean of invaded cells was reported.
Isolation of mouse peritoneal macrophages
The female BALB/c mice, 6–8 weeks old, were housed in a ventilated room at 12 h photoperiod with free access to food and water. All animal experiments were conducted in accordance with the guideline approved by the ethics committee of Shahid Beheshti University of Medical Sciences (Ethics code: IR.SBMU.RETECH.REC.1396.353). To collect peritoneal macrophages, female BALB/c mice were injected intraperitoneally with 2 ml 3% thioglycollate. Four days later, peritoneal macrophages were harvested by PBS intraperitoneal lavage [13]. Then, primary harvested cells were cultured in RPMI-1640 medium supplemented with 10% FBS, and after 2 h incubation in 37 °C, non-adherent cells were removed.
Experimental tumor model and treatments
The female BALB/c mice (6–8 weeks old) were injected subcutaneously in the mammary fat pads with 2 × 10⁶ 4T1 cells mixed with treated macrophages (1:3). The experimental groups (n = 4/group) included 4T1 + macrophages treated with PBS (control group), 4T1 + macrophages treated with unloaded exosomes, 4T1 + macrophages treated with scramble-loaded exosomes, 4T1 + macrophages treated with miR-130-loaded exosomes, 4T1 + macrophages treated with miR-33-loaded exosomes, 4T1 + macrophages treated with both miR-130 + miR-33-loaded exosomes. The rate of tumor growth in terms of tumor volume was examined every 5 days. Mice were sacrificed 30 days after injection. The tumors were removed and subjected to Hematoxylin and Eosin (H and E) staining.
Spleen cell cultures for cytokine assays
To measure the level of TNF-α, IL-10, and TGF-β, spleen cells were isolated and the mononuclear cell suspension was prepared. Then, the red blood cells were lysed using lysis buffer, and mononuclear cells were cultured with or without phytohemagglutinin (PHA) (Gibco, USA). After 72 h, the cell culture supernatant was collected, and the level of cytokines was measured using DuoSet ELISA kit (R&D Systems, Minneapolis, MN, USA).
Statistical analysis
All the results were expressed as the mean ± standard deviation (SD). Comparisons between more than two groups were performed using one-way analyses of variance (ANOVA) test. Two groups were compared by Student's t test (Graph Pad Prism 4.0, CA, US). P values < 0.05 were considered statistically significant.
Results
Characterization of exosomes derived from tumor cells and exosome labeling
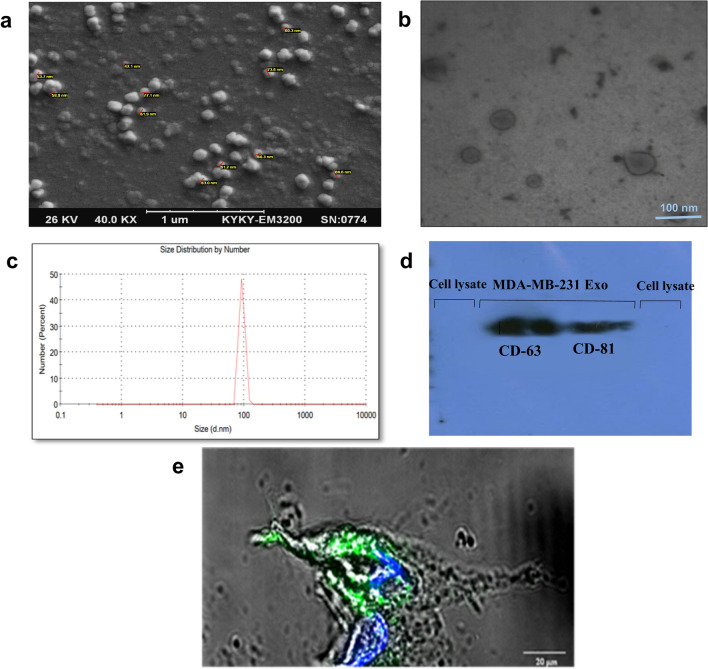
The size and morphology of the exosomes that were extracted from MDA-MB-231 cells were evaluated by SEM, TEM, DLS, and western blotting. SEM analysis indicated the spherical shape of exosomes with a diameter of < 100 nm (Fig. 1a). TEM analysis showed the lipid bilayer membrane of exosomes (Fig. 1b). Zetasizer measurement identified an average size of ~ 92 nm for exosomes (Fig. 1c). Western blot analysis confirmed the presence of tetraspanin family proteins, including CD63 and CD81, as exosomal surface marker proteins in exosomes, while expression of these markers was not observed in cell lysate (Fig. 1d). To label exosomes and detect their uptake to the target cells, the green fluorescent lipid dye (PKH67) was used. After exosomes staining, target cells were treated by exosomes. Confocal microscopy indicated fluorescent signals of exosomes inside the cytoplasm that approved their uptake to the cells (Fig. 1e).
Fig. 1.
Characterization of MDA-MB-231 cell line exosomes and exosome labeling a SEM micrograph of isolated exosomes confirmed the sphere shape and size of exosomes. b TEM micrograph showed the lipid bilayer of exosomes. c DLS analysis based on size distribution by number showed a single peak at ~ 92 nm. d Western blot. Tumor-derived exosomes were positive for CD63 and CD81 as exosomal markers. MCF7 cell lysates were used as a negative control. e Exosomes were labeled with a green fluorescent dye (PKH67), and macrophages were incubated with PKH-labeled exosomes for 24 h. Confocal laser scanning microscope showed the internalization of labeled exosomes in the cytoplasm and around the macrophage nucleus
Characterization of human peripheral blood monocytes M1, M2 and, TAM
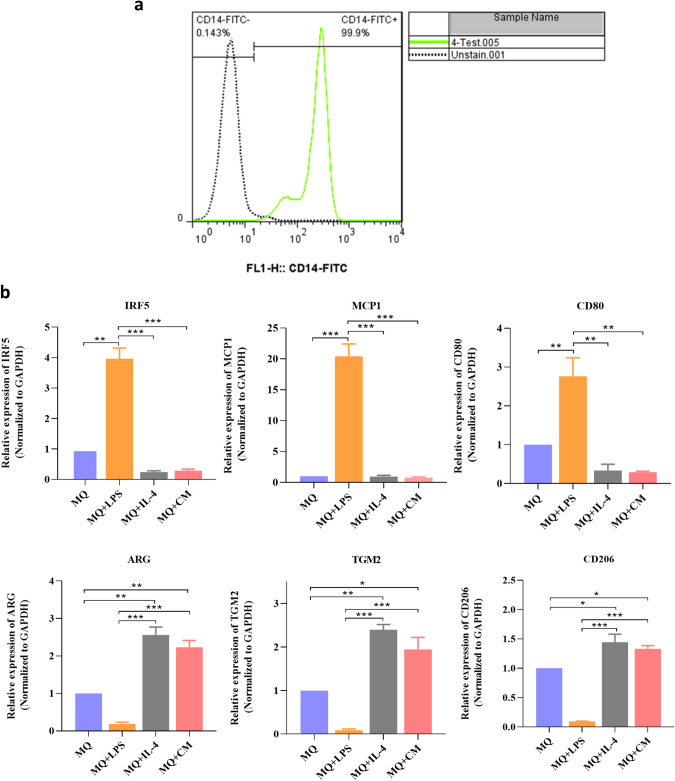
Human peripheral blood monocytes express the high level of CD14. The analysis of surface expression of CD14 by flow cytometry confirmed that most of the isolated cells are positive for CD14 as a monocyte-specific marker (Fig. 2a). To investigate if exposure to LPS, IL-4, and conditioned medium from MDA-MB-231 cells can affect macrophage differentiation, the expression of M1 and M2 markers was investigated using real-time PCR assay. The results showed that treatment of macrophage by LPS induced M1 phenotype with high expression of IRF5 (5.8-fold), MCP1 (20.42-fold), and CD80 (2.76-fold), while the expressions of Arg (5.4-fold), TGM2 (11.11-fold), and CD206 (10.58-fold) were decreased. In contrast, in macrophages stimulated by IL4 (M2), increased expression of Arg (2.56-fold), TGM2 (2.39-fold) and CD206 (1.44-fold) and decreased expression of IRF5 (4.16-fold), MCP1 (1.052-fold), and CD80 (2.98-fold) confirmed M2 polarization of macrophages. In macrophages treated with the conditioned medium of MDA-MB-231(TAMs), also we observed increased expression of Arg (2.23-fold), TGM2 (1.94-fold), and CD206 (1.33-fold) and a decline in expression of IRF5 (3.5-fold), MCP1 (1.29-fold) and CD80 (3.44-fold) (Fig. 2b).
Fig. 2.
Characterization of human peripheral blood monocytes, M1, M2, and tumor-associated macrophages. a The results of flow cytometry analysis confirmed that most of the purified cells are positive for CD14. b After treatment of macrophages by LPS, the results confirmed increased expression of M1 markers (IRF5, MCP1, and CD80) and decreased expression of M2 markers (ARG, TGM2, and CD206) while treatment with IL-4 or conditioned medium of MDA-MB-231 cells increased expression of M2 markers (ARG, TGM2 and, CD206) and decreased expression of M1 markers (IRF5, MCP1, and CD80). *P < 0.05, **P < 0.01
Enhancement of miRNAs expression level in macrophages after treatment by miRNA-loaded exosomes
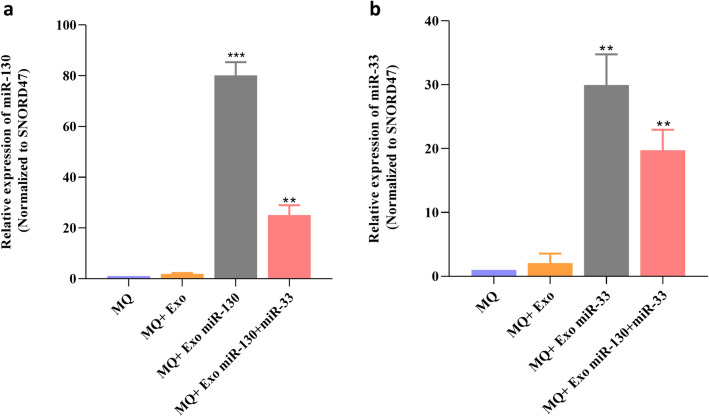
To prepare the miRNA-loaded exosomes, the electroporation strategy was done according to the procedure described in the material and method section. Then, macrophages were separately treated with miRNA-loaded exosomes in different groups. The results of real-time PCR confirmed that in treated macrophages with miR-130-loaded exosomes or miR-33-loaded exosomes, the expression level of miR-130 and miR-33 increased 80.86-fold and 29.95-fold, respectively, compared with the control group (Fig. 3a, b).
Fig. 3.
Enhancement of the miRNAs expression level in macrophages using miRNA-loaded exosomes. Macrophages were treated by exosomes containing miR-130 or miR-33 mimics or miR-130 + miR-33 mimics. Real-time PCR results showed increased expression of a miR-130, b miR-33 in treated macrophages. **P < 0.01, ***P < 0.001
Induction of macrophage reprogramming with miRNA-loaded exosomes
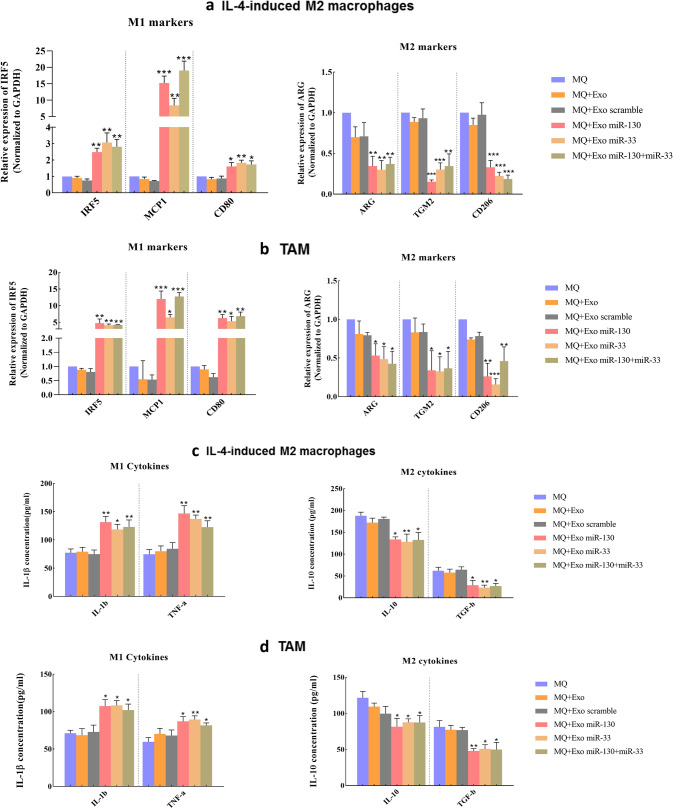
The function of modified exosomes on macrophage polarization was examined in two groups of macrophages: IL-4-induced M2 macrophages and TAMs. IL-4 was used to induce M2 polarization in macrophages. To obtain TAM, human monocytes were incubated with the conditioned medium of MDA-MB-231 cells. Then, IL-4-induced M2 macrophages and TAMs were treated with modified exosomes. The real-time results showed when these two groups of macrophages were treated with miRNA-loaded exosomes, the expression of M1 markers, including IRF5, MCP1, and CD80, increased. In contrast, the expression of M2 markers, ARG, TGM2, and CD206, decreased. In the IL-4-induced M2 macrophages group, the most expression level of IRF5 and MCP1 and CD80 was induced by miR-33 (3.07-fold), miR-130 + miR-33 (18.98-fold), and miR-33 (1.98-fold), respectively. For M2 markers, the lowest level of expression of ARG, TGM2, and CD206 was observed in macrophage treated with miR-33 (3.3-fold), miR-130 (6.57-fold), and miR-130 + miR-33 (5.4-fold), respectively (Fig. 4a). In the TAM group, the highest expression of IRF5, MCP1 and CD80 was detected in macrophages treated with miR-130 (4.72-fold), miR-130 + miR-33 (12.71-fold), and miR-130 + miR-33 (6.81-fold), respectively. About M2 markers, the lowest expression level of ARG, TGM2, and CD206 was detected in TAMs treated with miR-130 + miR-33 (2.38-fold), miR-33 (3.12-fold), and miR-33 (6.6-fold), respectively (Fig. 4b). To confirm the role of miRNA-loaded exosomes on macrophage polarization, the supernatant of macrophages was collected after treatment with modified exosomes. Then, the production of M1 and M2 cytokines was evaluated. In both IL-4induced M2 macrophages and TAMs groups, findings of ELISA assay indicated higher expression of M1 cytokines (IL-1β and TNF-α) than M2 cytokines (IL-10 and TGF-β) after treatment. In the IL-4-induced M2 macrophages group, the highest level of IL-1β and TNF-α secretion was observed in macrophages treated with miR-130. IL-10 and TGF-β showed the highest level of expression in macrophages treated with miR-130 + miR-33 and miR-130, respectively (Fig. 4c). In the TAM group, miR-33-loaded exosomes induced the most production of IL-1β and TNF-α in treated macrophages. While, the most production of IL-10 and TGF-β was induced by miR-130 + miR-33-loaded exosomes in TAMs (Fig. 4d). Collectively, these results suggested that the presence of miRNA-loaded exosomes can promote macrophage polarization to the M1 phenotype.
Fig. 4.
The expression of the M1 and M2 specific markers and the production of cytokines. MiRNA-loaded exosomes direct macrophages to a M1 phenotype. IL-4-induced M2 macrophages and TAMs were treated with miRNA-loaded exosomes, and RT-PCR was performed after 48 h. The expression level of M1 markers, including IRF5, MCP1, and CD80 increased while, the expression level of M2 markers, including ARG, TGM2, and CD206, decreased after treatment with miR-130, miR-33, and miR-130 + miR-33-loaded exosomes in both a IL-4-induced M2 macrophage and b TAM. ELISA assay. The cytokine secretion was measured in the conditioned medium of treated macrophages with miRNA-loaded exosomes in c IL-4-induced M2 macrophage and d TAMs. The production level of M1 cytokines (IL-1β and TNF-α) increased while the production level of M2 markers (IL-10 and TGF-β) decreased. *P < 0.05, **P < 0.01, ***P < 0.001
Overexpression of miRNAs increased phagocytotic activity of macrophages
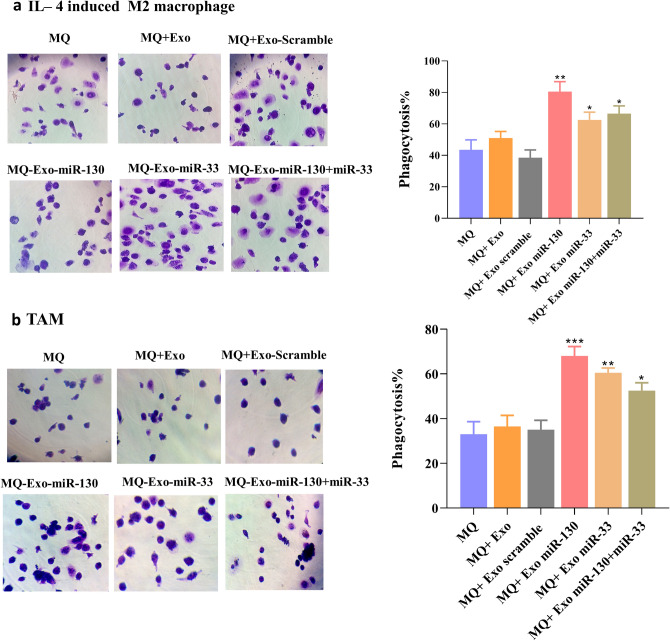
As shown in Fig. 5, macrophage treatment with miRNA-loaded exosomes increased the yeast phagocytosis. In IL-4-induced M2 macrophages, (Fig. 5a) the mean ± SD of the phagocytosis percentage in treated cells with miR-130, miR-33, and miR-130 + miR-33 was 80.5 ± 6.3, 62.5 ± 4.9, 66.5 ± 4.9, and 57.8 ± 4.3, respectively. In TAM (Fig. 5b), the mean ± SD of treated cells with miR-130, miR-33, and miR-130 + miR-33 was 68 ± 4.24, 60.5 ± 2.12, and 66.5 ± 4.9, and 52.5 ± 3.53, respectively.
Fig. 5.
Phagocytosis assay. Phagocytic assay showed increased phagocytosis ability of treated macrophages with miRNA-loaded exosomes in a IL-4-induced M2 macrophage and b TAM. *P < 0.05, **P < 0.01, **P < 0.001
Condition medium of exosome-received macrophages can decrease proliferation and invasion of MDA-MB-231 cells
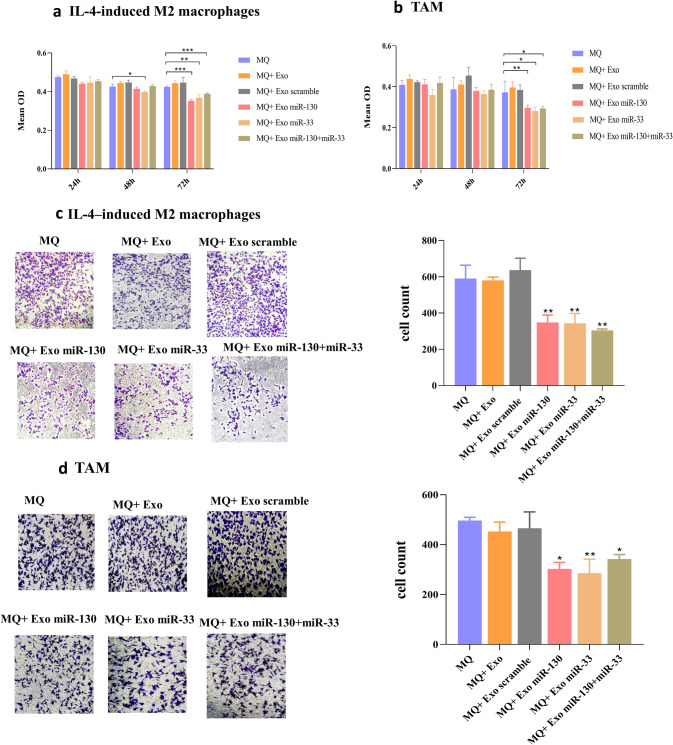
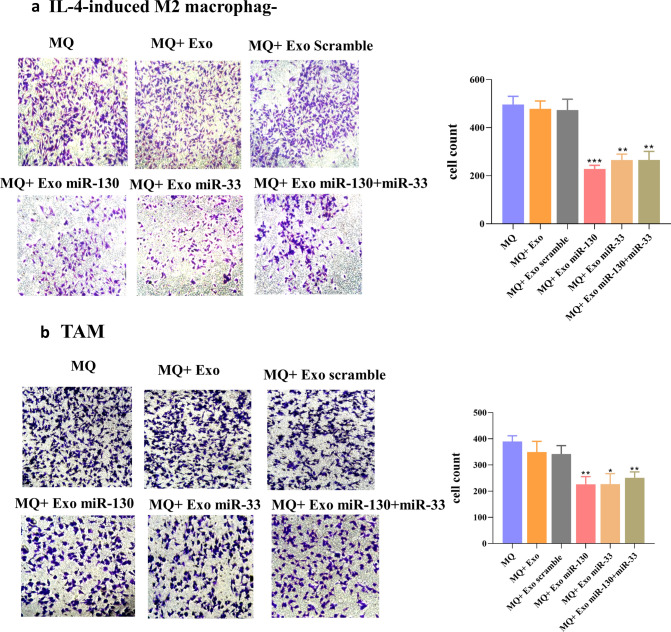
Since macrophage reprogramming by miRNA-loaded exosomes was confirmed, we examined whether this macrophage reprogramming was involved in the proliferation, invasion, and migration ability of tumor cells. For this purpose, MTT assay was performed using the conditioned medium of differently treated macrophages. The results revealed decreased viability of MDA-MB-231 cells in the presence of conditioned medium from macrophages treated with miRNA-loaded exosomes both in IL-4-induced M2 macrophages and TAM groups (Fig. 6a, b). Cell migration is an essential step in the metastatic process of cancer cells, and it has been demonstrated that M2 macrophages promote tumor cell migration and invasion [21]. So, we examined the effect of macrophage reprogramming by miRNA-loaded exosomes on migratory and invasive behavior of MDA-MB-231 cells. Transwell migration and invasion assays demonstrated that conditioned medium from macrophages treated with miRNA-loaded exosomes impaired tumor cell migration and invasion both in IL-4-induced M2 macrophages and TAM. In the IL-4-induced M2 group, the mean ± SD of the migrating cells in treated groups with miR-130, miR-33, and miR-130 + miR-33 was 348.45 ± 40.58, 343.87 ± 53.91, and 304 ± 28.48, respectively (Fig. 6c). In the TAM group, the mean ± SD of migrating cells after treatment of macrophages with miR-130, miR-33, and miR-130 + miR-33 was 302.9 ± 25.99, 285.865 ± 55.98, and 342.31 ± 17.72, respectively (Fig. 6d). In the IL-4-induced M2 group, the mean ± SD of the invading cells in treated groups with miR-130, miR-33, and miR-130 + miR-33 was 228.25 ± 15.20, 265.25 ± 24.39, and 265.87 ± 35.53, respectively (Fig. 7a). The mean ± SD of invading cells in the TAM group was 225.985 ± 29.67, 226.795 ± 39.88, and 251.22 ± 22.5, respectively (Fig. 7b).
Fig. 6.
MTT and Migration assay of MDA-MB-231 cells. The treatment of MDA-MB-231 cells with the conditioned medium of the different experimental groups of macrophages showed that after 24 h and 48 h, there was no significant difference between treatment groups. However, after 72 h, the conditioned medium of macrophages treated with miRNA-loaded exosomes decreased cell growth and proliferation of MDA-MB-231 cells in a IL-4-induced M2 macrophage and b TAM. Overexpression of miR-130 or miR-33 in exosomes inhibited the migration capacity of MDA-MB-231 cells in c IL-4-induced M2 macrophage and d TAM. MDA-MB-231 cells were cultured in the upper compartment of the transwell and then were placed in 24 well plate containing conditioned media from differently groups of treated macrophages. After 24 h, the number of migrated cells was counted manually *P < 0.05, **P < 0.01, ***P < 0.001
Fig. 7.
Invasion assay. Invasiveness of MDA-MB-231 cells decreased after miRNAs overexpression in a IL-4-induced M2 macrophage and b TAM. MDA-MB-231 cells were cultured in the upper chamber of the transwell containing matrigel and were placed in 24 well plate containing conditioned medium of different treated macrophages. The migrated cells to the bottom of the membrane were stained and quantified. *P < 0.05, **P < 0.01
Treated macrophages with miR-130 or miR-33-loaded exosomes inhibit tumor growth in mouse
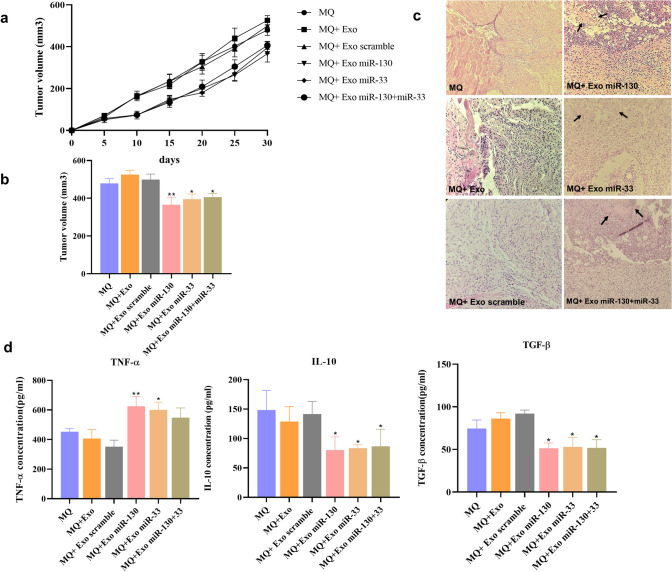
To determine the effect of exosome-treated macrophages on breast cancer progression, BALB/c mice were injected with 4T1 cells mixed with different groups of treated macrophages. Tumor growth analysis indicated that the tumor volumes were lower in the group of mice, which received treated macrophages with miR-130 or miR-33-loaded exosomes or both of them than those of the control group (Fig. 8a, b). Hematoxylin and eosin staining also showed the presence of necrotic areas in the tumor of mice which received treated macrophages with miR-130 or miR-33-loaded exosomes or both of them (Fig. 8c).
Fig. 8.
Treated macrophages with miRNA-loaded exosomes exert antitumor activity. a Monitoring of tumor growth at the indicated time points. b Measurement of the final volume. c Histologic observation using hematoxylin and eosin staining. d Evaluation of immune response by measurement of TNF-α, IL-10, and TGF-β concentration. *P < 0.05, **P < 0.01
Treated macrophages with miR-130 or miR-33-loaded exosomes increased production of TNF-α and decreased production of IL-10 and TGF-β
Assessment of cytokine production by spleen cell of breast cancer showed that the expression of TNF-α in the group of mice which received treated macrophages with miR-130 or miR-33-loaded exosomes was higher than that in the control group. The expression level of TNF-α between the group of mice which received treated macrophages with miR-130 + miR-33-loaded exosomes and the control group had no significant differences. The expression of IL-10 and TGF-β in the group of mice, which received treated macrophages with miR-130 or miR-33-loaded exosomes, or both of them, was lower than the control group (Fig. 8d).
Discussion
In this study, we reported that modifying the miRNA content of tumor-derived exosomes can reprogram pro-tumoral M2-like macrophages toward an anti-tumoral M1 phenotype. M2 macrophages are abundant in the tumor microenvironment, and in some cancers, they can comprise 50 percent of the tumor mass [22].TAMs facilitate tumor angiogenesis, growth, invasion, and migration to promote metastasis [23]. Recently, the key role of miRNAs in balancing between the M1 and M2 phenotypes of macrophages has been emerged. MiRNAs regulate transcription factors involved in macrophage polarization. The dysregulation of miRNA-transcription factor networks results in numerous diseases [24]. To find miRNAs that mediating the regulation of macrophage polarization, we first examined signaling pathways and cellular metabolism involved in macrophage polarization to identify key factors in these pathways. Then, we used relevant literature and bioinformatics studies to identify miRNAs which target these factors. The results of signaling pathway studies showed that peroxisome proliferator-activated receptor γ (PPARγ) is an important coordinator of STAT6. PPARγ, in concert with STAT6 direct dynamic change of macrophage polarization toward M2 [25]. IL-4-STAT6-PPAR-γ signaling axis plays a crucial role in monocyte differentiation into alternatively activated macrophages [26, 27]. The expression levels of PPARγ are associated with the expression of M2 markers [28]. The bioinformatics studies using TargetScan, miRWalk, and DIANA-tools showed that the PPARγ gene is a potential target of miR-130. Experimental data also support this hypothesis [14]. Another factor identified in the signaling pathway studies was MafB. MafB is a member of Maf transcription factors family, which plays a role in establishing monocyte-macrophage lineage [29]. This factor may mediate, at least in part, IL-4/STAT6 signaling to induce expression of M2 markers. Based on bioinformatic and experimental studies, miR-33 can target MafB [15]. So in this study, we hypothesized that delivering the miRNA-130 and miR-33 mimics by tumor cell-derived exosomes into pro-tumoral M2 macrophages can induce anti-tumoral M1 phenotype. At first, we compared the expression of miR-130 and miR-33 in the MDA-MB-231 cell line and MCF-10A cell line as control, and we found that miR-130 and miR-33 were downregulated in MDA-MB-231 cells compared with MCF-10A cells. These miRNAs also were downregulated in exosomes of MDA-MB-231 compared with those of MCF-10A. Then, we used electroporation to load miRNAs mimic into exosomes, and our results proved successful miRNAs mimic delivery to tumor-derived exosomes. Exosomes have several benefits that make them suitable as a delivery system. These benefits include low immune response, non-toxicity, small size, increased stability, and biocompatibility. Additionally, exosomes can easily pass through the cell membrane [30, 31]. The uptake studies using PKH67 staining demonstrated that tumor-derived exosomes could be taken up by macrophages. Human macrophages were polarized to M2 by treatment with 20 ng/ml IL-4 for 24 h, and TAM was obtained by incubation of human monocytes with conditioned medium collected from MDA-MB-231 culture for 6 days [32]. The phenotype of M2 macrophages and TAMs was determined by the assessment of M1 and M2 markers. Then, we treated TAMs and IL-4-induced M2 macrophages with miRNA-loaded exosomes. The expression level of miR-130 and miR-33 increased after treatment with exosomes. Treatment with miRNA-loaded exosomes increased expression of markers and cytokines associated with M1 phenotype, including MCP1, IRF5, CD80 and, TNF-α, IL-1β. In contrast, this treatment resulted in the downregulation of markers and cytokines associated with the M2 phenotype, including ARG, TGM2, TGF-β, IL-10, and CD206. Since M1 macrophages exhibited an anti-tumoral effect, we evaluated migration and invasion capacity of MDA-MB-231 cells after culturing with the conditioned medium of exosomes-treated macrophages. Our results showed that the migration and invasion capacity of MDA-MB-231 cells significantly decreased when these cells were incubated with the conditioned medium of macrophages treated with miRNA-loaded exosomes. After confirming the anti-tumoral role of exosome-treated macrophages in vitro, we evaluated their anti-tumoral role in vivo. In vivo findings also indicated reduced tumor growth and increased tumor necrosis in the presence of treated macrophages with miR-130 or miR-33 or miR130 + miR-33-loaded exosomes. We also evaluated cytokine production as an important factor in anti-tumor immune function [33]. The findings showed increased production of TNF-α and decreased production of IL-10 and TGF-β in the group of mice which received treated macrophages with miR-130 or miR-33 or miR130 + miR-33-loaded exosomes. So, it could be inferred that overexpression of miR-130 and miR-33 in tumor-derived exosomes can induce the anti-tumoral M1 phenotype in macrophages and inhibit tumor progression. The regulatory role of exosomal miRNAs in macrophage polarization has been reported in several studies. In ovarian cancer, miR-222-3p can transfer to macrophages by exosomes and target suppressor of cytokine signaling 3 (SOCS3). The inhibition of SOCS3 expression results in the activation of the STAT3 signaling pathway in macrophages, which is critical for M2 polarization [34]. In pancreatic cancer, a miR-encoding plasmid DNA was used to modify the miRNAs content of exosomes. The modified exosomes expressed miR-155 or miR-125b-2 and reprogrammed macrophages in the tumor microenvironment [35]. In another study, SK-LU-1 cancer cells were transfected with plasmid DNA encoding for wild-type p53 (wt-p53) and miR-125b. The secreted exosomes of these cells also showed expression of wt-p53 and miR-125b. The altered miR-125b expression level in exosomes could skew macrophages toward anti-tumoral M1 polarization [36]. Our study demonstrated the potential role of exosomal miR-130 in M1 macrophage polarization. Similar results have been shown by other studies. In non-small cell lung cancer (NSCLC), low expression of miR-130 is associated with poor prognosis and increased tumor growth and metastasis. Furthermore, there is an inverse correlation between miR-130 expression and PPAR-γ and CD163 in NSCLC tissues [37]. In a study by Lin et al., it was demonstrated that miR-130 could target PPARγ gene and induce M1 polarization. In contrast, Th2 stimulation activates histone deacetylation at the miR-130 promoter and suppresses its inhibitory effect on PPARγ [14]. PPARγ has a synergic effect on STAT6 and induces expression of M2-related genes. STAT6 is a master transcription factor regulating M2 polarization in response to IL-4 and IL-13 [38, 39]. Our data also revealed that miR-33 overexpression in tumor-derived exosomes could direct macrophage polarization toward an anti-tumoral M1 phenotype. The role of miR-33 as a pro-inflammatory miRNA had been previously demonstrated. In line with our results, Kim showed that miR-33-mediated phenotypic shift from M2 to M1 state by targeting MafB [15]. MafB regulates macrophage polarization by enhancing the expression of M2 polarization marker genes and suppressing the expression of M1 marker genes. On the other hand, it was reported that in atherosclerosis and other chronic inflammatory diseases, miR-33 inhibition could be a therapeutic approach since miR-33 inhibition can induce M2 polarization. Inhibition of miR-33 results in fatty acid oxidation (FAO) upregulation and derives alternative activation of macrophages. MiR-33 is a metabolic regulator and mediates its effect by targeting AMPK. This protein integrates cellular energy homeostasis and reduces FAO to promote the pro-inflammatory M1 phenotype [40]. Multiple studies in human and mouse macrophages have indicated that M1 macrophages are dependent on glycolysis [41, 42]. Although recently, some studies have reported metabolic differences between human and mouse macrophages [43, 44]. Our results indicated the capability of miR-33 to induce M1 polarization in human macrophages, although further studies are needed to clarify its precise mechanism.
In conclusion, our data suggest that tumor-derived exosomes can use as a delivery system for efficient miRNA transfer to macrophages, and miR-130 and miR-33 can direct macrophage polarization toward M1 by targeting PPARγ and MafB by involvement in the IL-4-STAT6 pathway. We observed that either miRNA alone had its effects or there is no synergy between these miRNAs. Furthermore, we observed that macrophage reprogramming by miRNA-loaded exosomes attenuated tumor progression in vivo. So, macrophage reprogramming mediated by exosomal miRNAs can be a promising approach in the inhibition of tumor progression in breast cancer.
Funding
This project is funded by the National Institute for Medical Research Development (NIMAD, Contact grant No: 957819) and Shahid Beheshti University of Medical Sciences, Tehran, Iran (Contact grant No: 10309).
Footnotes
The original online version of this article was revised: Funding information was missing.
Publisher's Note
Springer Nature remains neutral with regard to jurisdictional claims in published maps and institutional affiliations.
Change history
12/5/2020
A Correction to this paper has been published: 10.1007/s00262-020-02800-8
Contributor Information
Samira Mohammadi-Yeganeh, Email: s.mohammadiyeganeh@sbmu.ac.ir.
Seyed Mahmoud Hashemi, Email: smmhashemi@sbmu.ac.ir.
References
- 1.Siegel RL, Miller KD, Jemal A. Cancer statistics. CA Cancer J Clin. 2019;69(1):7–34. doi: 10.3322/caac.21551. [DOI] [PubMed] [Google Scholar]
- 2.Frediani JN, Fabbri M. Essential role of miRNAs in orchestrating the biology of the tumor microenvironment. Mol Cancer. 2016;15(1):42. doi: 10.1186/s12943-016-0525-3. [DOI] [PMC free article] [PubMed] [Google Scholar]
- 3.Mantovani A, Allavena P. The interaction of anticancer therapies with tumor-associated macrophages. J Exp Med. 2015;212(4):435–445. doi: 10.1084/jem.20150295. [DOI] [PMC free article] [PubMed] [Google Scholar]
- 4.Chanmee T, Ontong P, Konno K, Itano N. Tumor-associated macrophages as major players in the tumor microenvironment. Cancers. 2014;6(3):1670–1690. doi: 10.3390/cancers6031670. [DOI] [PMC free article] [PubMed] [Google Scholar]
- 5.Cheng H, Wang Z, Fu L, Xu T. Macrophage polarization in the development and progression of ovarian cancers: an overview. Front Oncol. 2019;9:421. doi: 10.3389/fonc.2019.00421. [DOI] [PMC free article] [PubMed] [Google Scholar]
- 6.Franklin RA, Liao W, Sarkar A, Kim MV, Bivona MR, Liu K, Pamer EG, Li MO. The cellular and molecular origin of tumor-associated macrophages. Science. 2014;344(6186):921–925. doi: 10.1126/science.1252510. [DOI] [PMC free article] [PubMed] [Google Scholar]
- 7.Fraternale A, Brundu S, Magnani M. Polarization and repolarization of macrophages. J Clin Cell Immunol. 2015;6(319):2. [Google Scholar]
- 8.Heusinkveld M, van der Burg SH. Identification and manipulation of tumor associated macrophages in human cancers. J Transl Med. 2011;9(1):216. doi: 10.1186/1479-5876-9-216. [DOI] [PMC free article] [PubMed] [Google Scholar]
- 9.Colombo N, Peccatori F, Paganin C, Bini S, Brandely M, Mangioni C, Mantovani A, Allavena P. Anti-tumor and immunomodulatory activity of intraperitoneal IFN-γ in ovarian carcinoma patients with minimal residual tumor after chemotherapy. Int J Cancer. 1992;51(1):42–46. doi: 10.1002/ijc.2910510109. [DOI] [PubMed] [Google Scholar]
- 10.Wang Y-C, He F, Feng F, Liu X-W, Dong G-Y, Qin H-Y, Hu X-B, Zheng M-H, Liang L, Feng L. Notch signaling determines the M1 versus M2 polarization of macrophages in antitumor immune responses. Can Res. 2010;70(12):4840–4849. doi: 10.1158/0008-5472.CAN-10-0269. [DOI] [PubMed] [Google Scholar]
- 11.O'Connell RM, Taganov KD, Boldin MP, Cheng G, Baltimore D. MicroRNA-155 is induced during the macrophage inflammatory response. Proc Natl Acad Sci. 2007;104(5):1604–1609. doi: 10.1073/pnas.0610731104. [DOI] [PMC free article] [PubMed] [Google Scholar]
- 12.Chaudhuri AA, So AY-L, Sinha N, Gibson WS, Taganov KD, O’Connell RM, Baltimore D. MicroRNA-125b potentiates macrophage activation. J Immunol. 2011;187(10):5062–5068. doi: 10.4049/jimmunol.1102001. [DOI] [PMC free article] [PubMed] [Google Scholar]
- 13.Ponomarev ED, Veremeyko T, Barteneva N, Krichevsky AM, Weiner HL. MicroRNA-124 promotes microglia quiescence and suppresses EAE by deactivating macrophages via the C/EBP-α–PU. 1 pathway. Nat Med. 2011;17(1):64. doi: 10.1038/nm.2266. [DOI] [PMC free article] [PubMed] [Google Scholar]
- 14.Su S, Zhao Q, He C, Huang D, Liu J, Chen F, Chen J, Liao J-Y, Cui X, Zeng Y. miR-142-5p and miR-130a-3p are regulated by IL-4 and IL-13 and control profibrogenic macrophage program. Nat Commun. 2015;6:8523. doi: 10.1038/ncomms9523. [DOI] [PMC free article] [PubMed] [Google Scholar]
- 15.Kim H. The transcription factor MafB promotes anti-inflammatory M2 polarization and cholesterol efflux in macrophages. Scie Rep. 2017;7(1):7591. doi: 10.1038/s41598-017-07381-8. [DOI] [PMC free article] [PubMed] [Google Scholar]
- 16.Li I, Nabet BY. Exosomes in the tumor microenvironment as mediators of cancer therapy resistance. Mol Cancer. 2019;18(1):32. doi: 10.1186/s12943-019-0975-5. [DOI] [PMC free article] [PubMed] [Google Scholar]
- 17.Kowal J, Tkach M, Théry C. Biogenesis and secretion of exosomes. Curr Opin Cell Biol. 2014;29:116–125. doi: 10.1016/j.ceb.2014.05.004. [DOI] [PubMed] [Google Scholar]
- 18.Kooijmans SA, Vader P, van Dommelen SM, van Solinge WW, Schiffelers RM. Exosome mimetics: a novel class of drug delivery systems. Int J Nanomed. 2012;7:1525. doi: 10.2147/IJN.S29661. [DOI] [PMC free article] [PubMed] [Google Scholar]
- 19.Berthold F. Isolation of human monocytes by Ficoll density gradient centrifugation. Blut. 1981;43(6):367–371. doi: 10.1007/BF00320315. [DOI] [PubMed] [Google Scholar]
- 20.Kia V, Paryan M, Mortazavi Y, Biglari A, Mohammadi-Yeganeh S. Evaluation of exosomal miR-9 and miR-155 targeting PTEN and DUSP14 in highly metastatic breast cancer and their effect on low metastatic cells. J Cell Biochem. 2019;120(4):5666–5676. doi: 10.1002/jcb.27850. [DOI] [PubMed] [Google Scholar]
- 21.Zhang B, Zhang Y, Yao G, Gao J, Yang B, Zhao Y, Rao Z, Gao J. M2-polarized macrophages promote metastatic behavior of Lewis lung carcinoma cells by inducing vascular endothelial growth factor-C expression. Clinics. 2012;67(8):901–906. doi: 10.6061/clinics/2012(08)08. [DOI] [PMC free article] [PubMed] [Google Scholar]
- 22.Poh AR, Ernst M. Targeting macrophages in cancer: from bench to bedside. Front Oncol. 2018;8:49. doi: 10.3389/fonc.2018.00049. [DOI] [PMC free article] [PubMed] [Google Scholar]
- 23.Dandekar RC, Kingaonkar AV, Dhabekar GS. Role of macrophages in malignancy. Ann Maxillofac Surg. 2011;1(2):150. doi: 10.4103/2231-0746.92782. [DOI] [PMC free article] [PubMed] [Google Scholar]
- 24.Li H, Jiang T, Li M-Q, Zheng X-L, Zhao G-J (2018) Transcriptional regulation of macrophages polarization by MicroRNAs. Front Immunol 9 [DOI] [PMC free article] [PubMed]
- 25.Biswas SK, Mantovani A. Macrophage plasticity and interaction with lymphocyte subsets: cancer as a paradigm. Nat Immunol. 2010;11(10):889–896. doi: 10.1038/ni.1937. [DOI] [PubMed] [Google Scholar]
- 26.Tikhanovich I, Zhao J, Olson J, Adams A, Taylor R, Bridges B, Marshall L, Roberts B, Weinman SA. Protein arginine methyltransferase 1 modulates innate immune responses through regulation of peroxisome proliferator-activated receptor γ-dependent macrophage differentiation. J Biol Chem. 2017;292(17):6882–6894. doi: 10.1074/jbc.M117.778761. [DOI] [PMC free article] [PubMed] [Google Scholar]
- 27.Luo W, Xu Q, Wang Q, Wu H, Hua J. Effect of modulation of PPAR-γ activity on Kupffer cells M1/M2 polarization in the development of non-alcoholic fatty liver disease. Scie Rep. 2017;7:44612. doi: 10.1038/srep44612. [DOI] [PMC free article] [PubMed] [Google Scholar]
- 28.Bouhlel MA, Derudas B, Rigamonti E, Dièvart R, Brozek J, Haulon S, Zawadzki C, Jude B, Torpier G, Marx N. PPARγ activation primes human monocytes into alternative M2 macrophages with anti-inflammatory properties. Cell Metab. 2007;6(2):137–143. doi: 10.1016/j.cmet.2007.06.010. [DOI] [PubMed] [Google Scholar]
- 29.Kelly LM, Englmeier U, Lafon I, Sieweke MH, Graf T. MafB is an inducer of monocytic differentiation. EMBO J. 2000;19(9):1987–1997. doi: 10.1093/emboj/19.9.1987. [DOI] [PMC free article] [PubMed] [Google Scholar]
- 30.Ha D, Yang N, Nadithe V. Exosomes as therapeutic drug carriers and delivery vehicles across biological membranes: current perspectives and future challenges. Acta Pharmaceutica Sinica B. 2016;6(4):287–296. doi: 10.1016/j.apsb.2016.02.001. [DOI] [PMC free article] [PubMed] [Google Scholar]
- 31.Jiang X-C, Gao J-Q. Exosomes as novel bio-carriers for gene and drug delivery. Int J Pharm. 2017;521(1–2):167–175. doi: 10.1016/j.ijpharm.2017.02.038. [DOI] [PubMed] [Google Scholar]
- 32.Wang Z, Xu L, Hu Y, Huang Y, Zhang Y, Zheng X, Wang S, Wang Y, Yu Y, Zhang M. miRNA let-7b modulates macrophage polarization and enhances tumor-associated macrophages to promote angiogenesis and mobility in prostate cancer. Scie Rep. 2016;6:25602. doi: 10.1038/srep25602. [DOI] [PMC free article] [PubMed] [Google Scholar]
- 33.Sakuishi K, Apetoh L, Sullivan JM, Blazar BR, Kuchroo VK, Anderson AC. Targeting Tim-3 and PD-1 pathways to reverse T cell exhaustion and restore anti-tumor immunity. J Exp Med. 2010;207(10):2187–2194. doi: 10.1084/jem.20100643. [DOI] [PMC free article] [PubMed] [Google Scholar]
- 34.Ying X, Wu Q, Wu X, Zhu Q, Wang X, Jiang L, Chen X, Wang X. Epithelial ovarian cancer-secreted exosomal miR-222-3p induces polarization of tumor-associated macrophages. Oncotarget. 2016;7(28):43076. doi: 10.18632/oncotarget.9246. [DOI] [PMC free article] [PubMed] [Google Scholar]
- 35.Su M-J (2016) Pancreatic cancer cell exosomes-mediated macrophage reprogramming and the role of MicroRNA transfection using nanoparticle delivery system. Northeastern University [DOI] [PMC free article] [PubMed]
- 36.Trivedi M, Talekar M, Shah P, Ouyang Q, Amiji M. Modification of tumor cell exosome content by transfection with wt-p53 and microRNA-125b expressing plasmid DNA and its effect on macrophage polarization. Oncogenesis. 2016;5(8):e250. doi: 10.1038/oncsis.2016.52. [DOI] [PMC free article] [PubMed] [Google Scholar]
- 37.Lin L, Lin H, Wang L, Wang B, Hao X, Shi Y. miR-130a regulates macrophage polarization and is associated with non-small cell lung cancer. Oncol Rep. 2015;34(6):3088–3096. doi: 10.3892/or.2015.4301. [DOI] [PubMed] [Google Scholar]
- 38.Goenka S, Kaplan MH. Transcriptional regulation by STAT6. Immunol Res. 2011;50(1):87. doi: 10.1007/s12026-011-8205-2. [DOI] [PMC free article] [PubMed] [Google Scholar]
- 39.Lawrence T, Natoli G. Transcriptional regulation of macrophage polarization: enabling diversity with identity. Nat Rev Immunol. 2011;11(11):750. doi: 10.1038/nri3088. [DOI] [PubMed] [Google Scholar]
- 40.Ouimet M, Ediriweera HN, Gundra UM, Sheedy FJ, Ramkhelawon B, Hutchison SB, Rinehold K, van Solingen C, Fullerton MD, Cecchini K. MicroRNA-33–dependent regulation of macrophage metabolism directs immune cell polarization in atherosclerosis. J Clin Investig. 2015;125(12):4334–4348. doi: 10.1172/JCI81676. [DOI] [PMC free article] [PubMed] [Google Scholar]
- 41.Van den Bossche J, Baardman J, de Winther MP. Metabolic characterization of polarized M1 and M2 bone marrow-derived macrophages using real-time extracellular flux analysis. JoVE (J Visualized Exp) 2015;105:e53424. doi: 10.3791/53424. [DOI] [PMC free article] [PubMed] [Google Scholar]
- 42.Cheng S-C, Scicluna BP, Arts RJ, Gresnigt MS, Lachmandas E, Giamarellos-Bourboulis EJ, Kox M, Manjeri GR, Wagenaars JA, Cremer OL. Broad defects in the energy metabolism of leukocytes underlie immunoparalysis in sepsis. Nat Immunol. 2016;17(4):406. doi: 10.1038/ni.3398. [DOI] [PubMed] [Google Scholar]
- 43.Van den Bossche J, O’Neill LA, Menon D. Macrophage immunometabolism: where are we (going)? Trends Immunol. 2017;38(6):395–406. doi: 10.1016/j.it.2017.03.001. [DOI] [PubMed] [Google Scholar]
- 44.Vijayan V, Pradhan P, Braud L, Fuchs HR, Gueler F, Motterlini R, Foresti R, Immenschuh S. Human and murine macrophages exhibit differential metabolic responses to lipopolysaccharide-A divergent role for glycolysis. Redox Biol. 2019;22:101147. doi: 10.1016/j.redox.2019.101147. [DOI] [PMC free article] [PubMed] [Google Scholar]


