Abstract
The immune microenvironment plays a vital role in the progression of hepatocellular carcinoma (HCC). Thousands of immune-related genes (IRGs) have been identified, but their effects on HCC are not fully understood. In this study, we identified the differentially expressed IRGs and analyzed their functions in HCC in a systematic way. Furthermore, we constructed a diagnostic and a prognostic model using multiple statistical methods, and both models had good distinguishing performance, which we verified in several independent datasets. This diagnostic model was also adaptable to proteomic data. The combination of a prognostic risk model and classic clinical staging can effectively distinguish patients in high- and low-risk groups. Furthermore, we systematically explore the differences in the immune microenvironment between the high-risk group and the low-risk group to help clinical decision-making. In summary, we systematically analyzed immune-related genes in HCC, explored their functions, constructed a diagnostic and a prognostic model and investigated potential therapeutic schedules in high-risk patients. The model performance was verified in multiple databases. Our findings can provide directions for future research.
Electronic supplementary material
The online version of this article (10.1007/s00262-020-02733-2) contains supplementary material, which is available to authorized users.
Keywords: Hepatocellular carcinoma, Bioinformatics, Immune microenvironment, Diagnostic model, Prognostic risk model, Immune therapy
Introduction
HCC is the fourth leading cause of cancer-related death worldwide [1]. The prognosis of HCC remains poor due to late diagnosis and the lack of effective treatments [1]. Further research on the mechanism and development of HCC, and new diagnostic and prognostic markers are needed to explore more therapeutic targets, improve patient survival and achieve personalized treatment [2].
The growth of HCC cells in vivo cannot be separated from the support of the immune microenvironment, which has been shaped by the tumor [3]. Previous studies have identified many genes that play a key role in establishing the immune microenvironment, but their functions and regulatory mechanisms in HCC have not been systematically analyzed. In addition, an abnormal immune system affects HCC growth and response to treatment, suggesting that immune-related genes may be a prospective source of novel diagnostic and prognostic biomarkers and may provide guidance on treatment plan development [4].
In this study, we identified key immune-related genes (IRGs) in HCC based on weighted correlation network analysis (WGCNA), and the differential analysis relied on multiple datasets. Survival analysis of the identified genes was carried out to identify valuable IRGs, and epigenetic regulatory factor regulatory networks were established to explore the mechanism behind the differential expression of these survival-related IRGs. Based on the results, we constructed diagnostic and prognostic models using multiple statistical methods. The diagnostic model distinguished patients with HCC specifically and sensitively from normals. The prognostic model divided patients with HCC into high-risk and low-risk subgroups. The high-risk group had a significantly shorter OS time than the low-risk group, and this model well predicted the survival time of HCC patients, which was verified in multiple online datasets. Lastly, we evaluated the differences in immune factors between the high-risk and low-risk groups, carried out pancancer analysis, and preliminarily discussed the applicability of some treatment methods to patients in the high-risk and low-risk groups. These outcomes might be helpful to improve patient diagnosis and prognosis and to further understand how the tumor-related immune microenvironment forms in HCC.
Materials and methods
Data acquisition and processing
The messenger RNA (mRNA) expression, gene mutation and patient clinical data were downloaded from the GEO database (GSE14520, GSE54236, GSE76427, GSE116174, GSE78820, GSE109211 and GSE73571), TCGA database (TCGA-LIHC dataset), GTEx database (GTEx-liver dataset) and ICGC database (ICGC-JP dataset) [5–8]. The protein expression data of HCC were acquired from the Human Protein Atlas (HPA) database and CPTAC database [9, 10]. The immune-related genes were explored from the IMMPORT database and InnateDB database, which collects immune-related genes from many studies [11, 12].
WGCNA and functional analysis
For weighted correlation network analysis (WGCNA), we first used the ‘WGCNA’ R package, choosing a proper soft threshold and clustered genes with coexpression similarity to the same module [13]. The modules were combined with clinical data from the TCGA-LIHC dataset to search for meaningful modules. PPI network connection information was acquired from the STRING database and was drawn in Cytoscape 3.7.1 software. Gene ontology (GO) and Kyoto Encyclopedia of Gene and Genome (KEGG) analyses were performed with the criteria of a P value < 0.05 and q value < 0.05. Epigenetic regulatory factors were collected from previous literature and from databases (Table S1) [14–19].
Construction of the diagnostic and prognostic models
Random forest and support vector machine (SVM) calculations were both done with the ‘Random Forest’ R package, and LASSO regression was used to screen diagnostic markers. Logistic regression was used to build diagnostic models (Table S2). Univariate Cox regression analysis was conducted to identify survival-related genes with the criterion of P < 0.01. LASSO-multivariate Cox regression analysis was used to establish a prognostic model. Grouping into high and low risk was based on a risk value (PIRs) 50% cutoff (Table S3).
Correlation analysis of the immune microenvironment
According to the median prognostic immune risk score (PIRs) in every dataset, we divided the samples into a high-PIRs group and a low-PIRs group. GSEA 4.0.1 software was used to explore the biological functions of the PIRs in the 2 groups based on the hallmark gene set [20]. Gene set variation analysis (GSVA) used the ‘GSVA’ R package and hallmark gene set to intersect with the results of gene set enrichment analysis (GSEA) [21]. Microsatellite instability (MSI) and tumor mutation burden (TMB) data were downloaded from TCGA database. The EPIC database was used for quantitative analysis of immune cells [22]. Twenty-nine immune-related gene sets were acquired from the MSigDB database [23]. ssGSEA (single-sample GSEA) used the ‘GSVA’ R package to calculate the signal intensity of a single sample. The immune microenvironment score used ESTIMATE, which is an algorithmic tool for inferring the abundance of infiltrating immune cells [24].
Statistical analysis
R software 3.5.2 and SPSS software 24 were used for the above statistical analysis. Statistical significance was set as P < 0.05. Student’s t-test was used to test the differences between different groups. Kaplan–Meier survival curves were used to compare survival between different groups. The receiver operating characteristic curve (ROC) and decision curve analysis (DCA) were used to determine the model accuracy. A calibration curve was drawn to analyze the model stability.
Results
Identification of hub-IRGs in HCC
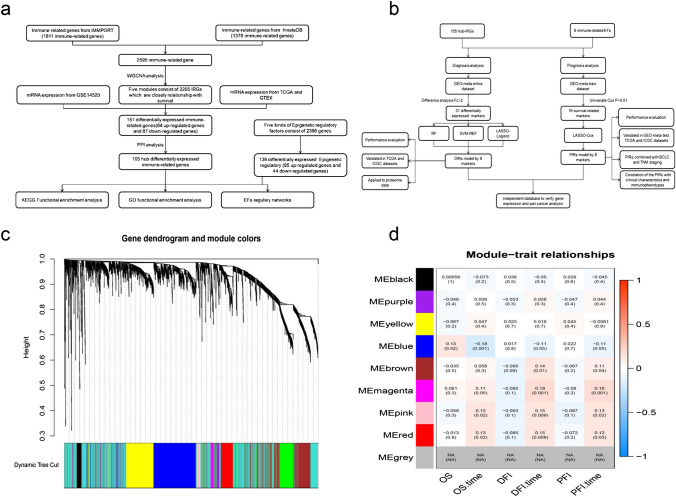
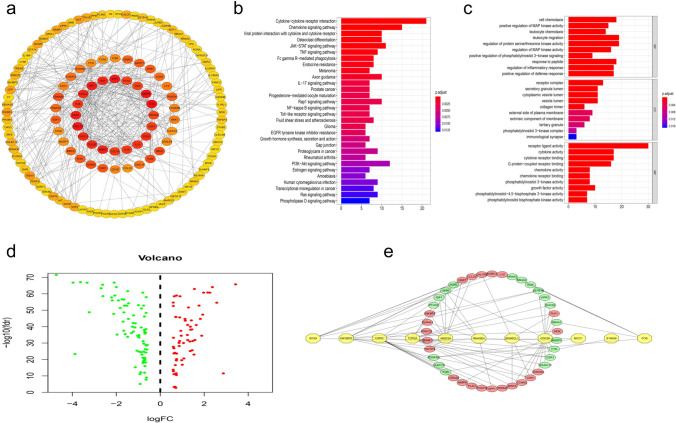
The analysis flowchart is shown in Fig. 1a, b. We collected as many immune-related genes as possible that were included in the IMMPORT database, consisting of 1811 immune-related genes, and the InnateDB database, consisting of 1378 immune-related genes, of which we took the intersection to obtain 2595 immune-related genes. To identify meaningful immune-related genes, we applied WGCNA to analyze the above genes, which yielded nine modules in HCC. In the past, authoritative research based on TCGA has verified that OS, DFI and PFI are reliable in HCC dataset. Therefore, we analyzed the relevance between every module and OS, DFI and PFI (Fig. 1c, d). The results indicated that five modules (blue, brown, magenta, pink and red) were closely related to OS, DFI and PFI. Further, we conducted a differential expression analysis based on the TCGA database, consisting of 374 tumor-diagnosed samples with HCC and 50 normal samples, and the GTEX database, consisting of 110 normal liver tissues, because the TCGA database only included few normal liver tissues. For this analysis, the cut-off criteria were FDR < 0.01 and Fc > 1.5. In addition, to verify the above results, for which the verification criterion was FDR < 0.01, we chose the GEO dataset GSE145520 because it included complete genetic information and had the largest sample size. This verification yielded 151 differentially expressed IRGs. PPI networks can help to understand the interaction mechanisms of many molecules and identify hub molecules depending on known and predicted protein interactions [25]. To build a PPI network, we analyzed the above 151 immune-related genes and identified 105 hub genes with nodes ≥ 3 for subsequent study (Fig. 2a).
Fig. 1.
a, b The analysis flowchart in this study. Abbreviations: Epigenetic regulatory factors, RF: random forest, SVM: support vector machine. c, d The WGCNA analysis of immune-related genes consisting of nine modules
Fig. 2.
a Protein–protein interaction network of immune-related genes which node > 3. b Top 30 enrichment functions analyzed of 105 hub-IRGs by KEGG. c The GO enrichment analysis of 105 hub-IRGs, which top ten functions of each term. d The differential expression of 105 hub-IRGs which participate in establishing EFs-regulatory networks. e The EFs-regulatory networks which correlation coefficient > 0.35 between hub-IRGs and EFs both in TCGA-LIHC dataset and GSE14520 dataset
Functional analysis and construction of the epigenetic factor regulatory network
We conducted Kyoto Encyclopedia of Gene and Genome (KEGG) and gene ontology (GO) analyses to understand the functions of these hub-IRGs (Fig. 2b, c). To explore the regulatory mechanism as widely as possible, we built an EF (epigenetic factors)-IRG regulatory network (Fig. 2d, e). Consistent with the expected results, the GO analysis showed that biological process (BP) terms were mainly enriched in the regulation of cell chemotaxis and MAP kinase activity. The molecular function (MF) terms mainly involved the regulation of receptor ligand activity and cytokine activity. Cellular component (CC) terms were significantly enriched in receptor complex and secretory granule lumen. In addition, the KEGG pathways were mainly involved in cytokine–cytokine receptor interaction, chemokine signaling pathway, viral protein interaction with cytokine and cytokine receptor. One of the advantages of bioinformatics analysis is that it can predict relationships between expression regulators and target gene regulation based on expression-level correlations, so it can be used in initial studies of the genetic associations in diseases. However, most of the previous studies only focused on the relationship between transcription factors and target gene regulation, so they have limitations. To widely understand the regulatory mechanism, we collected 2396 epigenetic factors, including DNA methylation-modifying factors, m6A regulatory proteins, transcription factors, histone-modifying proteins and RNA-binding proteins, which have been found to play key roles in regulating gene expression in many tumors. With the above significance thresholds, we identified 140 differentially expressed EFs. According to the results of this analysis, we constructed an EF-IRG regulatory network using the TCGA database and verified it in the GEO dataset GSE14520 based on the criterion of a correlation coefficient ≥ 0.35.
Immune-related genes for the diagnosis of HCC
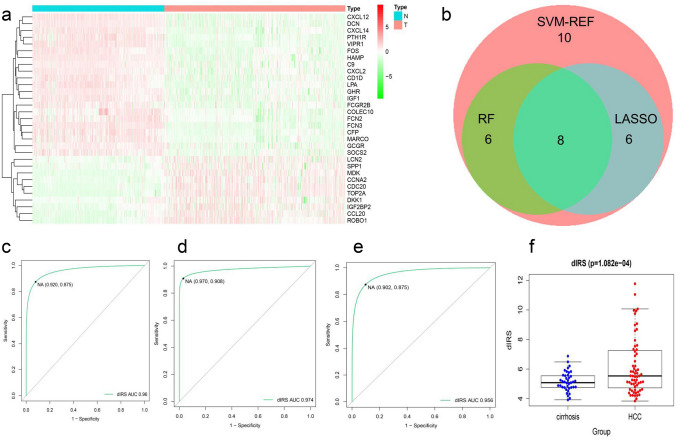
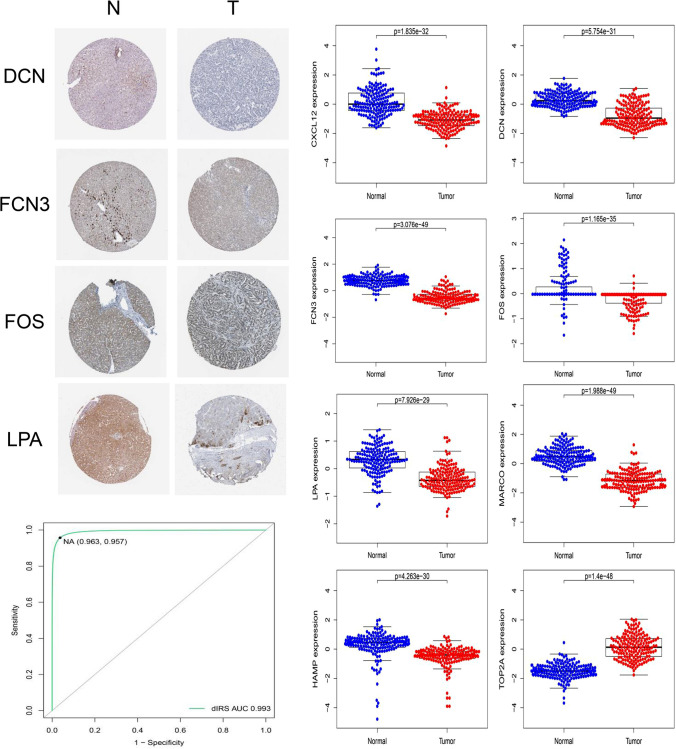
We summarized the above 105 immune-related genes and 9 epigenetic factors (Table S4) that were closely related to them for the next analysis. Four datasets (GSE14520, GSE54236, GSE76427, and GSE116174) totaling 371 normal liver samples and 509 HCC samples were collected from the GEO database, including complete gene information, large sample size and clinical information. We named this combined dataset the GEO-meta dataset. Aiming at the accuracy of the model and to reduce the number of independent variables, we analyzed the differential expression of the above 114 immune-related genes and identified 31 significantly differentially expressed genes (P < 0.01 Fc ≥ 2) to construct a diagnostic model (Fig. 3a). The random forest analysis, support vector machine and LASSO analysis pulled out eight markers that overlapped among the three methods (Fig. 3b, S1a–g). Using a logistic regression method, we constructed a diagnostic immune risk score (dIRS) model with the above markers (Table S5). In the GEO-meta dataset, the ROC had an excellent AUC value, specificity and sensitivity, which were also verified in the GTEX-TCGA and ICGC-LIHC datasets (Fig. 3c, d, e). Clinically, liver cirrhosis and HCC may be confused [26], thus we additionally assess whether there is a difference in dIRS between HCC and cirrhosis using the GSE14323 dataset (Fig. 3f). The result indicated that the dIRS was significantly different between HCC and cirrhosis. Furthermore, we validated the protein expression levels of the above genes in the CPTAC and HPA databases which were consistent with the expression of the mRNAs (Fig. 4a, b). We used the CPTAC protein expression data to further investigate dIRS-related genes (Fig. 4). Our diagnostic model allowed for the classification of liver cancer tissues from normal liver tissues, and showed an AUC value (0.993), specificity and sensitivity (Fig. 4c). These results support that the proposed diagnostic model based on mRNA expression, was also validated with proteomic data.
Fig. 3.
a The expression of 31 diagnostic markers in the GEO-meta dataset. b Venn diagram of the intersection of RF, SVM and LASSO to find diagnostic markers. c The ROC curve of dIRS for distinguishing patients with HCC in the GEO-meta dataset. d The ROC curve of dIRS for distinguishing patients with HCC in TCGA-LIHC dataset. e The ROC curve of dIRS for identifying patients with HCC in the ICGC-JP dataset. f The dIRS of between HCC and cirrhosis in the GSE14323 dataset
Fig. 4.
a Immunohistochemistry in HPA database of eight dIRS-related genes in HPA database which the database did not detect the protein expression of CXCL12, HAMP, MARCO, and TOP2A. b The protein expression of eight dIRS-related genes in the CPTAC database. c The ROC curve of dIRS for distinguishing liver cancer tissues and normal liver tissues in the CPTAC-LIHC dataset based on the above diagnostic model
Immune-related genes for the prognosis of HCC
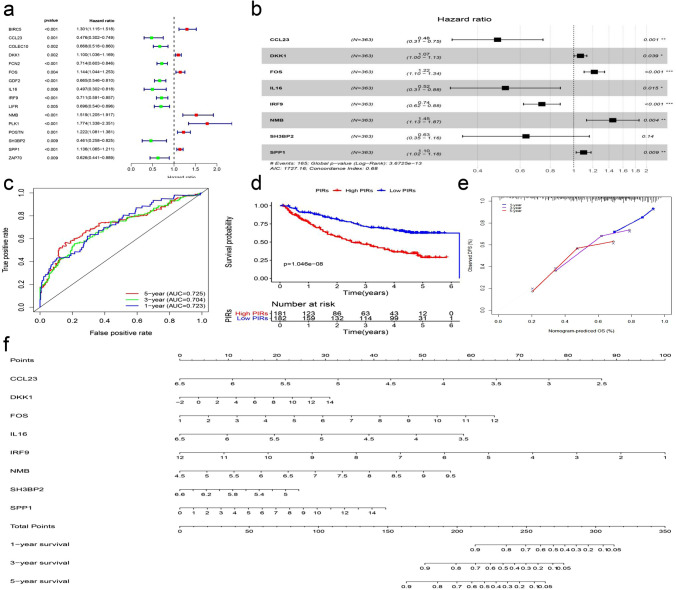
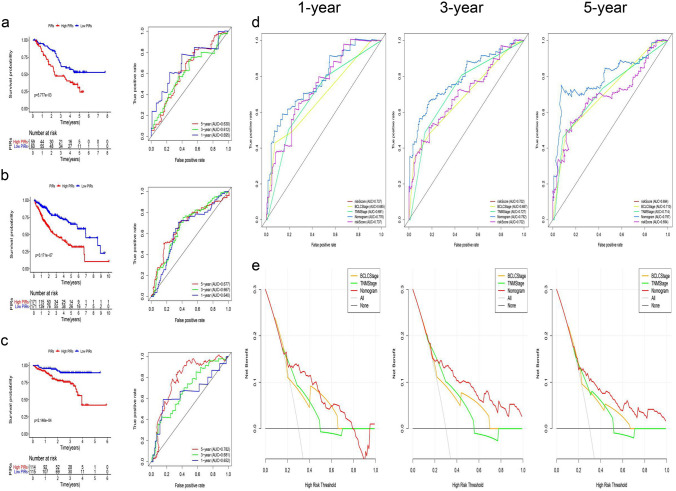
To explore the prognostic value of the above 114 IRGs, we randomly divided the GEO-meta dataset into the GEO-meta train dataset, consisting of 378 HCC samples, which was more than any one dataset online had, and the GEO-meta test dataset, consisting of 127 HCC samples. A total of 16 survival-related IRGs were identified in the GEO-meta train dataset by univariate Cox proportional model (Fig. 5a). For model refinement and accuracy, we acquired eight genes using LASSO regression and two-way multivariate Cox regression to establish a prognostic risk model (Figs. 5b, c, S1h, i). The prognostic immune risk score (PIRs) was calculated for patients in the GEO-meta train dataset and divided into high-PIRs and low-PIRs groups. The AUC values for 1-, 3- and 5-year OS were 0.723, 0.704, and 0725, respectively (Fig. 5c, d). The calibration curve also showed outstanding stability (Fig. 5E). For the convenience of clinical use, we drew a nomogram to predict the 1-year, 3-year, and 5-year survival (Fig. 5f). We calculated the PIRs in three independent datasets (GEO-meta test dataset, TCGA dataset and ICGC-JC dataset). Consistent with the above results, the high-risk groups had a shorter OS than the low-risk groups and the AUC values for OS were larger than 0.6, especially in TCGA and ICGC-JP datasets, which was probably because of the large sample size and the uniform sample source (Fig. 6a, b, c). In addition, we evaluated the prognostic value of the PIRs in various clinical subgroups of HCC, and the high-risk group had longer OS than the low-risk group in all subgroups based on the GEO-meta entire dataset (Fig. S2a).
Fig. 5.
a 16 prognostic marker using univariate Cox regression model which P value < 0.01. b Eight prognostic marker using LASSO regression analysis and both-way multivariate Cox regression model. c The area under the ROC curve (AUC) of PIRs for 1-, 3- and 5-year OS in GEO-meta train dataset. d Survival analysis of PIRs in GEO-meta train dataset. e Calibration curve of PIRs in GEO-meta train dataset. f The nomograms for predicting 1-, 3-, and 5-year survival rate in GEO-meta train dataset
Fig. 6.
a The ROC curve and survival analysis of PIRs for predicting HCC patient survival in the GEO-meta test dataset. b The ROC curve and survival analysis of PIRs for predicting HCC patient survival in the TCGA-LIHC dataset. c The ROC curve and survival analysis of PIRs for predicting HCC patient survival in the ICGC-JP dataset. d The ROC curve of combining PIRs, BCLC and TNM stage predicts HCC patient survival in the GEO-meta train dataset. e Decision curve of combining PIRs, BCLC and TNM stage for showing the benefits to HCC patients in the GEO-meta train dataset
By multivariate Cox regression analysis, we identified the PIRs as an independent prognostic factor for HCC (Fig. S3a). Based on the GEO-meta train dataset, the PIRs combined with BCLC and TNM staging can more stably put patients into high-risk and low-risk groups than classical clinical methods and can bring greater benefits to patients using ROC and DCA curves, as verified in the GEO-meta test dataset (Figs. 6d, e, S2b, c).
Correlation of the PIRs with clinical characteristics and immunophenotypes
We analyzed the difference in clinical characteristics between the high-risk and low-risk groups in the above datasets. Consistent with the clinical consensus, high-risk patients showed significantly higher BCLC and TNM stages than low-risk patients (Tables 1, S6, S7).
Table 1.
Correlation between PIRs and clinical characteristics in GEO-meta entire dataset
| Characters | GEO-meta dataset | ||
|---|---|---|---|
| Low risk | High risk | P value | |
| Gender | 0.618 | ||
| Female | 40 | 36 | |
| Male | 211 | 215 | |
| Bclc stage | 0.025 | ||
| 0–A | 148 | 102 | |
| B–C | 41 | 49 | |
| Age (years) | 0.865 | ||
| < 60 | 151 | 130 | |
| ≥ 60 | 74 | 66 | |
| TNM stage | 0.141 | ||
| I–II | 152 | 112 | |
| III–IV | 36 | 39 | |
| ALT (U/L) | 0.625 | ||
| ≤ 50 | 84 | 58 | |
| > 50 | 56 | 44 | |
| AFP (ng/ml) | < 0.001 | ||
| ≤ 300 | 114 | 44 | |
| > 300 | 53 | 57 | |
| Tumor size (cm) | 0.097 | ||
| ≤ 5 | 95 | 58 | |
| > 5 | 45 | 43 | |
| Multinodular | 0.025 | ||
| Yes | 23 | 29 | |
| No | 117 | 73 | |
| Cirrhosis | 0.145 | ||
| Yes | 126 | 97 | |
| No | 14 | 5 | |
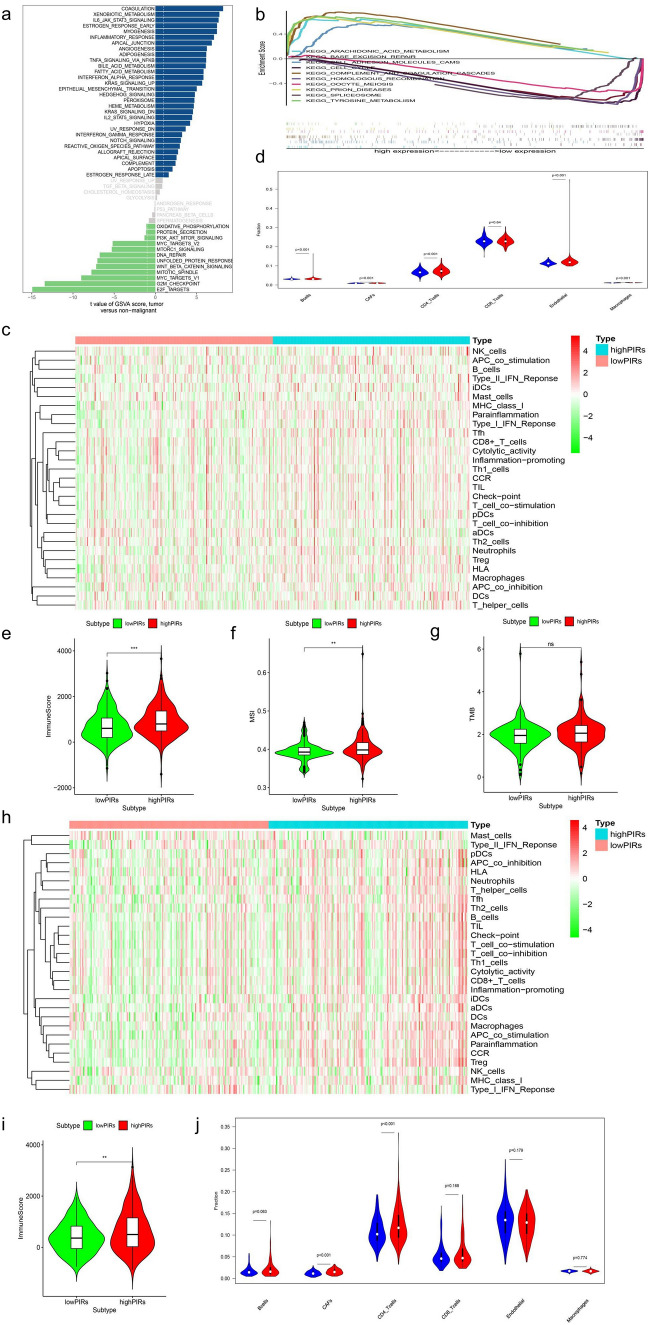
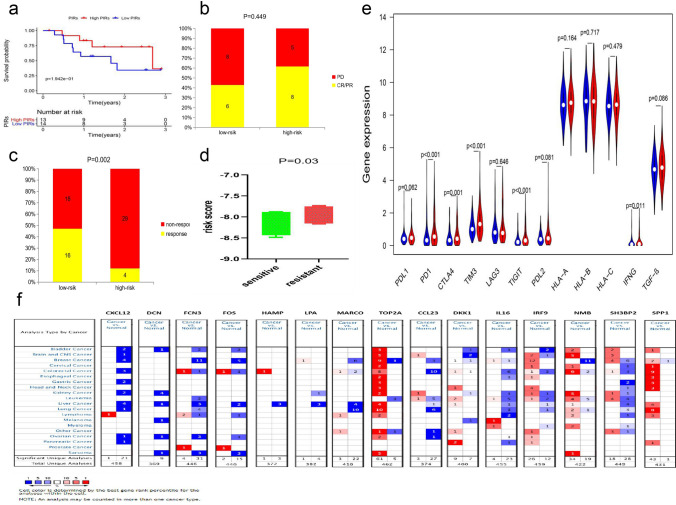
Based on the GEO-meta dataset, we used the GSVA and GSEA algorithms to identify the differential signaling pathways between high-PIRs and low-PIRs groups through the intersection, which could be used to understand the disease mechanism and as a potential therapeutic target (Figs. 7a, b, S4a). Through using immune-related gene sets from previous studies, we conducted ssGSEA analysis and identified that multiple signals such as TIL and inflammation-promoting signal, were stronger in the high-PIRs group than in the low-PIRs group, which was highly consistent in the two largest HCC datasets (GEO-meta dataset and TCGA dataset) (Tables S8, S9, Fig. 7c, h). The immune microenvironment score displays tumor immune microenvironment activity and has been reported to be closely related to tumor prognosis and immunotherapy [27]. Our analysis found that the high-PIRs group also had a significantly higher immune microenvironment score than the low-PIRs group (Fig. 7e, i). Through the EPIC database, we identified that the high-PIRs group had more CAFs and CD4 + T cell infiltration (Fig. 7d–j). Previous studies have also reported that patients with high TMB and MSI are more likely to respond to immunotherapy [28, 29]. Focusing on MSI and TMB, we found that the high-PIRs group had more MSI and no significant difference in TMB than the low-PIRs group (Fig. 7f, g). Based on the above results, we concluded that the high-PIRs group had stronger immune activity than the low-PIRs group. Given that the high-PIRs group was at a later stage on average, at which patients lack surgical indications, and many studies have confirmed that immune activity affects the efficacy of immunotherapy, we speculated that patients in the high-risk group may be more suitable for immunotherapy. To test this hypothesis, we chose GSE78820, which is a dataset of melanoma patients receiving PD1 treatment, for analysis because it included all PIRs-related genes, it had an appropriate sample size, and there was no dataset for immunotherapy of HCC online. The results showed that the high-PIRs group had a higher response rate and longer OS than the low-PIRs group, although the difference was not significant, which could be attributed to the small sample sizes (Fig. 8a, b). In addition, we collected two datasets related to sorafenib therapy for HCC. The high-PIRs group had a significantly higher response rate to sorafenib in the GSE109211 dataset, and the in vitro model showed that sorafenib-resistant HCC cells had significantly higher PIRs than sorafenib-sensitive HCC cells in the GSE73571 dataset (Fig. 8c, d). These results indicated that the high-PIRs group was more suitable for immunotherapy than surgical treatment and targeted drug therapy. Finally, we analyzed the differences in the expression of markers closely related to immunotherapy effects, such as immune checkpoints, HLA and IFN-γ, which were found in previous studies in high-PIRs and low-PIRs groups, to further verify the above results based on the TCGA dataset because it had expression data on all the above genes (Fig. 8e) [30–33]. The results showed that the high-PIRs group had higher expression of immune checkpoints and IFN-γ, which further verified our conclusion from the dataset inside.
Fig. 7.
a Enrichment functions of GSVA between high-PIRs group and low-PIRs group. b Enrichment functions of GSEA between high-PIRs group and low-PIRs group. c Difference of 29 immune-related signals between high-PIRs group and low-PIRs group using ssGSEA analysis in GEO-meta entire dataset. d Difference of six immune cells between high-PIRs group and low-PIRs group in GEO-meta entire dataset. e Difference of immune scores between high-PIRs group and low-PIRs group in GEO-meta entire dataset. f The difference of MSI between high-PIRs and low-PIRs group. g Difference of TMB between high-PIRs and low-PIRs group. h The difference of 29 immune-related signals between high-PIRs group and low-PIRs group using ssGSEA analysis in TCGA-LIHC dataset. i The difference of immune scores between high-PIRs group and low-PIRs group in TCGA-LIHC dataset. j Difference of six immune cells between high-PIRs group and low-PIRs group in TCGA-LIHC dataset
Fig. 8.
a Survival analysis of patients with melanoma accepted PD1 therapy between high-PIRs group and low-PIRs group in GSE78820 dataset. b The difference of response for patients with melanoma received PD1 therapy between high-PIRs group and low-PIRs group in GSE78820 dataset. c The difference of response for patients with HCC accepted sorafenib therapy between high-PIRs group and low-PIRs group in GSE109211. d Difference of PIRs between sorafenib-sensitive HCC cell and sorafenib-resistent HCC cell in GSE73571 dataset. P value of one-tail T test is 0.03 and P value of two-tail T test is 0.06. e The differential expression of immunotherapy markers between high-PIRs and low-PIRs. f Differential expression of dIRS-related and PIRs-related genes based on the Oncomine database
Validation model gene expression and pancancer analysis
The Oncomine database is an authoritative tumor database that collects multiple datasets from different databases and includes gene expression data for various tumors. Using the Oncomine database, we further validated 15 genes that went into the construction of the diagnostic model and prognostic model, and the results were consistent with our findings above (Fig. 8f). We also carried out a pancancer analysis and observed the expression differences of these genes in various other tumors (Fig. 8f).
Discussion
The tumor immune microenvironment, comprising tumor immune-infiltrating cells and soluble cytokines, is indispensable for tumor growth in vivo. Previous studies have found that the tumor immune microenvironment plays a key role in the progression of HCC and is affected by immune-related genes [29]. Although a large number of studies have focused on the formation mechanism and effects of the immune microenvironment of HCC, their depth and breadth have been too small to support the clinical peripheral application of their findings due to a lack of systematic analysis [34]. A breakthrough might be made by analyzing immune-related genes based on the systematic analysis of bioinformatics technology, which can help us to understand the formation mechanism and regulatory mode of the immune microenvironment of HCC and offer guidelines for clinical practice [35].
In this study, we first gathered the immune-related genes by exploring two classic immune databases. The functions of genes are interrelated in their promotion of disease progression; thus, we conducted WGCNA, which is a high-level bioinformatics analysis technology based on disease-specific analysis of intrinsic gene correlations and module differentiation, and identified nine modules for the above immune-related genes in HCC. To identify clinically significant modules, we chose the TCGA database because it is the most authoritative and widely used tumor database, and the OS, DFI, and PFI data were confirmed by a previous study [36]. The results showed that the five modules were closely related to survival, and the results were consistent with the report that a large number of genes are involved in the formation of the immune microenvironment of HCC. Next, we analyzed the differential expression of the immune-related genes of the above modules in HCC. Due to the limitations of gene chip, RNA-seq and PCR technologies, previous studies have identified differentially expressed genes in HCC by single gene chips, RNA-seq or small-sample-size detection, which often leads to conflicting research results [37]. Thus, we carried out genetic difference analysis using the RNA-seq dataset TCGA-LIHC and the gene chip dataset GSE14520 and identified 151 differentially expressed IRGs. WGCNA helps to find important genes based on disease characteristics, while PPI focuses on the characteristics of genes to find hub genes. Through PPI analysis, we further identified 105 hub-IRGs. To explore their functions, we conducted KEGG and GO analyses and found that the above hub-IRGs were enriched in multiple immune-related signaling pathways, which also confirmed the key roles of these genes to some extent. Unlike previous bioinformatics studies, which only focused on the regulation of TFs and other single EFs on the target gene, this study systematically collected 2395 EFs, and mapped the epigenetic regulatory network of hub-IRGs through the intersection of two datasets (TCGA-LIHC and GSE14520). These data could provide a reliable bioinformatics analysis model for future research.
Next, we explored the clinical peripheral application of these genes. Although biopsy is the gold standard for the diagnosis of HCC, there are still false positives and false negatives in clinical practice due to the shortcomings of professional technicians and tumor heterogeneity [38]. The development of new diagnostic methods can provide convenience for HCC diagnosis and help new medical activities in the future [39]. The diagnostic value of IRGs is still unclear. We collected the datasets from the GEO database that included complete clinical information and gene expression data, of which there were four (GSE14520, GSE54236, GSE76427, and GSE116174). We used batch correction to combine these into the GEO-meta dataset, consisting of 371 nontumor liver samples and 509 HCC samples, which is one of the most comprehensive datasets of HCC collected yet. To improve the reliability of and refine the diagnostic models, we used SVM-REF, RF and LASSO regression to screen eight markers and construct a diagnostic model in multivariate logistic regression with an AUC value > 0.9 and specificity plus sensitivity > 1.8. In two independent datasets (TCGA dataset and ICGC-JP dataset), the model was consistent and had good diagnostic performance. At present, there is no research report on the model of transcriptome data applied to proteomic data. We analyzed the protein expression of the above eight genes using the HPA database and CPTAC database, and the results were consistent with the RNA expression. We applied the above diagnostic model to CPTAC HCC proteomic data, which also showed excellent AUC value, specificity and sensitivity. To calculate the prognostic value of the model, we randomly divided the GEO-meta dataset into the GEO-meta training dataset and the GEO-meta test dataset. Using LASSO regression and two-way multivariate Cox regression, we built a prognostic signal (PIRs) consisting of eight genes whose AUC curve and calibration curve showed acceptable discrimination and stability. We validated the above prognostic signal in the GEO-meta test dataset, TCGA dataset and ICGC-JP dataset, and the results were consistent with the GEO-meta training dataset. The above results showed that the prognostic signal was a stable and effective marker for HCC. In addition, we divided the entire GEO-meta dataset into multiple subgroups according to clinical characteristics, and the high-PIRs group had a longer OS time than the low-PIRs group in all clinical subgroups. Focusing on classical clinical prognostic methods, such as BCLC stage and TNM stage, the ROC curve and DCA curve showed that PIRs combined with BCLC and TNM stage had satisfactory differentiation and greater benefits for patients based on the GEO-meta train dataset and GEO-meta test dataset [40]. Next, we explored the impact of PIRs on clinical treatment decisions. We analyzed the correlation between PIRs and clinical features and found that high PIRs was correlated with later TNM and BCLC stages, which suggested that many patients in the high-PIRs group lack surgical indications [41]. We used two algorithms, GSVA and GSEA, which had intersecting results, to identify the differential signals between the high-PIRs and low-PIRs groups, which could explain poor prognostic mechanisms and offer therapeutic targets for patients. We found that patients in the high-PIRs group had higher immune fever by immune microenvironment score and ssGSEA analysis. Based on the TCGA-LIHC dataset, the high-PIRs group had a higher MSI than the low-PIRs group. According to the above results, we reasonably speculated that the high-PIRs group may be suitable for immunotherapy [42]. By analyzing the GSE78820 dataset, the high-PIRs group had a longer OS time and response rate to PD1 therapy, but this lack of significance may be attributed to the small sample sizes. Furthermore, we conducted internal validation of the dataset and found that multiple immunotherapy response markers were highly expressed in the high-PIRs group. We also assessed the response of the high-PIRs group to sorafenib in two datasets (GSE109211 and GSE73571), and the results showed that the high-PIRs group had a poor response to sorafenib. In summary, patients in the high-PIRs group may be suitable for immunotherapy, and they may have a better or the same benefit through immunotherapy compared with the low-PIRs group. Finally, we used the Oncomine database, an authoritative database of tumors, to verify the expression of the genes that constructed the above model and to carry out pancancer analysis, which further verified our results [43].
In summary, we used a systematic and efficient method to analyze immune-related genes in HCC. These results may offer a deep and reliable understanding of HCC development and the immune microenvironment compared with previous results [44]. In addition, we constructed two signals by using a variety of statistical methods to guide the diagnosis, prognosis and treatment of HCC. For the first time, based on immune-related genes, a diagnostic model for HCC was constructed and applied to proteomic data. Although the major limitation in this study is the lack of verification of our own data, we did use multiple independent datasets, internal datasets and different statistical algorithms for verification, which confirmed the reliability of our conclusions. Our research should be helpful for the diagnosis and treatment of HCC and could provide direction for future HCC studies.
Electronic supplementary material
Below is the link to the electronic supplementary material.
Author contributions
WDG, ZXP and LZJ performed research and wrote the first draft. WDG and LZJ collected and analyzed the data. WDG, YY and LZJ participated in manuscript revision. All authors contributed to the design and interpretation of the study and to further drafts. LZJ is the guarantor.
Funding
This project was supported by the National Science Foundation of China (Nos. 81170442, 81470899), National Scholarship Foundation (No. 201208505116), and Outstanding young talent fund of the second hospital of CQMU (2011).
Compliance with ethical standards
Conflict of interest
No benefits in any form have been received or will be received from a commercial party related directly or indirectly to the subject of this article.
Ethical approval
This article does not contain any studies with animals performed by any of the authors.
Footnotes
Publisher's Note
Springer Nature remains neutral with regard to jurisdictional claims in published maps and institutional affiliations.
References
- 1.Yang JD, Hainaut P, Gores GJ, Amadou A, Plymoth A, Roberts LR. A global view of hepatocellular carcinoma: trends, risk, prevention and management. Nat Rev Gastroenterol Hepatol. 2019;16(10):589–604. doi: 10.1038/s41575-019-0186-y. [DOI] [PMC free article] [PubMed] [Google Scholar]
- 2.Turato C, Balasso A, Carloni V, Tiribelli C, Mastrotto F, Mazzocca A, Pontisso P. New molecular targets for functionalized nanosized drug delivery systems in personalized therapy for hepatocellular carcinoma. J Control Release. 2017;268:184–197. doi: 10.1016/j.jconrel.2017.10.027. [DOI] [PubMed] [Google Scholar]
- 3.Fu Y, Liu S, Zeng S, Shen H. From bench to bed: the tumor immune microenvironment and current immunotherapeutic strategies for hepatocellular carcinoma. J Exp Clin Cancer Res. 2019;38(1):396. doi: 10.1186/s13046-019-1396-4. [DOI] [PMC free article] [PubMed] [Google Scholar]
- 4.Cheng AL, Hsu C, Chan SL, Choo SP, Kudo M. Challenges of combination therapy with immune checkpoint inhibitors for hepatocellular carcinoma. J Hepatol. 2020;72(2):307–319. doi: 10.1016/j.jhep.2019.09.025. [DOI] [PubMed] [Google Scholar]
- 5.GTEx Consortium Human genomics. The Genotype-Tissue Expression (GTEx) pilot analysis: multitissue gene regulation in humans. Science. 2015;348(6235):648–660. doi: 10.1126/science.1262110. [DOI] [PMC free article] [PubMed] [Google Scholar]
- 6.Hutter C, Zenklusen JC. The cancer genome atlas: creating lasting value beyond its data. Cell. 2018;173(2):283–285. doi: 10.1016/j.cell.2018.03.042. [DOI] [PubMed] [Google Scholar]
- 7.Jiang P, Liu XS. Big data mining yields novel insights on cancer. Nat Genet. 2015;47(2):103–104. doi: 10.1038/ng.3205. [DOI] [PubMed] [Google Scholar]
- 8.Zhang J, Baran J, Cros A, Guberman JM, Haider S, Hsu J, Liang Y, Rivkin E, Wang J, Whitty B, Wong-Erasmus M, Yao L, Kasprzyk A. International Cancer Genome Consortium Data Portal–a one-stop shop for cancer genomics data. Database (Oxford) 2011 doi: 10.1093/database/bar026. [DOI] [PMC free article] [PubMed] [Google Scholar]
- 9.Edwards NJ, Oberti M, Thangudu RR, Cai S, McGarvey PB, Jacob S, Madhavan S, Ketchum KA. The CPTAC data portal: a resource for cancer proteomics research. J Proteome Res. 2015;14(6):2707–2713. doi: 10.1021/pr501254j. [DOI] [PubMed] [Google Scholar]
- 10.Uhlén M, Fagerberg L, Hallström BM, Lindskog C, Oksvold P, Mardinoglu A, Sivertsson Å, Kampf C, Sjöstedt E, Asplund A, Olsson I, Edlund K, Lundberg E, Navani S, Szigyarto CA, Odeberg J, Djureinovic D, Takanen JO, Hober S, Alm T, Edqvist PH, Berling H, Tegel H, Mulder J, Rockberg J, Nilsson P, Schwenk JM, Hamsten M, von Feilitzen K, Forsberg M, Persson L, Johansson F, Zwahlen M, von Heijne G, Nielsen J, Pontén F. Proteomics Tissue-based map of the human proteome. Science. 2015;347(6220):1260419. doi: 10.1126/science.1260419. [DOI] [PubMed] [Google Scholar]
- 11.Bhattacharya S, Dunn P, Thomas CG, et al. ImmPort, toward repurposing of open access immunological assay data for translational and clinical research. Sci Data. 2018;5:180015. doi: 10.1038/sdata.2018.15. [DOI] [PMC free article] [PubMed] [Google Scholar]
- 12.Breuer K, Foroushani AK, Laird MR, Chen C, Sribnaia A, Lo R, Winsor GL, Hancock RE, Brinkman FS, Lynn DJ. InnateDB: systems biology of innate immunity and beyond–recent updates and continuing curation. Nucl Acids Res. 2013;41:D1228–1233. doi: 10.1093/nar/gks1147. [DOI] [PMC free article] [PubMed] [Google Scholar]
- 13.Pei G, Chen L, Zhang W. WGCNA application to proteomic and metabolomic data analysis. Methods Enzymol. 2017;585:135–158. doi: 10.1016/bs.mie.2016.09.016. [DOI] [PubMed] [Google Scholar]
- 14.Gujar H, Weisenberger DJ, Liang G. The roles of human DNA methyltransferases and their isoforms in shaping the epigenome. Genes (Basel) 2019 doi: 10.3390/genes10020172. [DOI] [PMC free article] [PubMed] [Google Scholar]
- 15.Khare SP, Habib F, Sharma R, Gadewal N, Gupta S, Galande S. HIstome: a relational knowledgebase of human histone proteins and histone modifying enzymes. Nucl Acids Res. 2012;40:D337–342. doi: 10.1093/nar/gkr1125. [DOI] [PMC free article] [PubMed] [Google Scholar]
- 16.Liu T, Ortiz JA, Taing L, Meyer CA, Lee B, Zhang Y, Shin H, Wong SS, Ma J, Lei Y, Pape UJ, Poidinger M, Chen Y, Yeung K, Brown M, Turpaz Y, Liu XS. Cistrome: an integrative platform for transcriptional regulation studies. Genome Biol. 2011;12(8):R83. doi: 10.1186/gb-2011-12-8-r83. [DOI] [PMC free article] [PubMed] [Google Scholar]
- 17.Chen M, Wong CM. The emerging roles of N6-methyladenosine (m6A) deregulation in liver carcinogenesis. Mol Cancer. 2020;19(1):44. doi: 10.1186/s12943-020-01172-y. [DOI] [PMC free article] [PubMed] [Google Scholar]
- 18.Williams K, Christensen J, Helin K. DNA methylation: TET proteins-guardians of CpG islands. EMBO Rep. 2011;13(1):28–35. doi: 10.1038/embor.2011.233. [DOI] [PMC free article] [PubMed] [Google Scholar]
- 19.Li K, Guo ZW, Zhai XM, Yang XX, Wu YS, Liu TC. RBPTD: a database of cancer-related RNA-binding proteins in humans. Database (Oxford) 2020 doi: 10.1093/database/baz156. [DOI] [PMC free article] [PubMed] [Google Scholar]
- 20.Subramanian A, Kuehn H, Gould J, Tamayo P, Mesirov JP. GSEA-P: a desktop application for Gene Set Enrichment Analysis. Bioinformatics. 2007;23(23):3251–3253. doi: 10.1093/bioinformatics/btm369. [DOI] [PubMed] [Google Scholar]
- 21.Hänzelmann S, Castelo R, Guinney J. GSVA: gene set variation analysis for microarray and RNA-seq data. BMC Bioinform. 2013;14:7. doi: 10.1186/1471-2105-14-7. [DOI] [PMC free article] [PubMed] [Google Scholar]
- 22.Racle J, Gfeller D. EPIC: a tool to estimate the proportions of different cell types from bulk gene expression data. Methods Mol Biol. 2020;2120:233–248. doi: 10.1007/978-1-0716-0327-7_17. [DOI] [PubMed] [Google Scholar]
- 23.Liberzon A, Birger C, Thorvaldsdóttir H, Ghandi M, Mesirov JP, Tamayo P. The Molecular Signatures Database (MSigDB) hallmark gene set collection. Cell Syst. 2015;1(6):417–425. doi: 10.1016/j.cels.2015.12.004. [DOI] [PMC free article] [PubMed] [Google Scholar]
- 24.Yoshihara K, Shahmoradgoli M, Martínez E, Vegesna R, Kim H, Torres-Garcia W, Treviño V, Shen H, Laird PW, Levine DA, Carter SL, Getz G, Stemke-Hale K, Mills GB, Verhaak RG. Inferring tumour purity and stromal and immune cell admixture from expression data. Nat Commun. 2013;4:2612. doi: 10.1038/ncomms3612. [DOI] [PMC free article] [PubMed] [Google Scholar]
- 25.Bertolazzi P, Bock ME, Guerra C. On the functional and structural characterization of hubs in protein-protein interaction networks. Biotechnol Adv. 2013;31(2):274–286. doi: 10.1016/j.biotechadv.2012.12.002. [DOI] [PubMed] [Google Scholar]
- 26.Aubé C, Bazeries P, Lebigot J, Cartier V, Boursier J. Liver fibrosis, cirrhosis, and cirrhosis-related nodules: Imaging diagnosis and surveillance. Diagn Interv Imaging. 2017;98(6):455–468. doi: 10.1016/j.diii.2017.03.003. [DOI] [PubMed] [Google Scholar]
- 27.Zeng D, Li M, Zhou R, Zhang J, Sun H, Shi M, Bin J, Liao Y, Rao J, Liao W. Tumor microenvironment characterization in gastric cancer identifies prognostic and immunotherapeutically relevant gene signatures. Cancer Immunol Res. 2019;7(5):737–750. doi: 10.1158/2326-6066.CIR-18-0436. [DOI] [PubMed] [Google Scholar]
- 28.Watson MM, Lea D, Gudlaugsson E, Skaland I, Hagland HR, Søreide K. Prevalence of PD-L1 expression is associated with EMAST, density of peritumoral T-cells and recurrence-free survival in operable non-metastatic colorectal cancer. Cancer Immunol Immunother. 2020 doi: 10.1007/s00262-020-02573-0. [DOI] [PMC free article] [PubMed] [Google Scholar]
- 29.Hollern DP, Xu N, Thennavan A, Glodowski C, Garcia-Recio S, Mott KR, He X, Garay JP, Carey-Ewend K, Marron D, Ford J, Liu S, Vick SC, Martin M, Parker JS, Vincent BG, Serody JS, Perou CM. B cells and T follicular helper cells mediate response to checkpoint inhibitors in high mutation burden mouse models of breast cancer. Cell. 2019;179(5):1191–1206.e21. doi: 10.1016/j.cell.2019.10.028. [DOI] [PMC free article] [PubMed] [Google Scholar]
- 30.Luchini C, Bibeau F, Ligtenberg M, Singh N, Nottegar A, Bosse T, Miller R, Riaz N, Douillard JY, Andre F, Scarpa A. ESMO recommendations on microsatellite instability testing for immunotherapy in cancer, and its relationship with PD-1/PD-L1 expression and tumour mutational burden: a systematic review-based approach. Ann Oncol. 2019;30(8):1232–1243. doi: 10.1093/annonc/mdz116. [DOI] [PubMed] [Google Scholar]
- 31.Garrido F. HLA class-I expression and cancer immunotherapy. Adv Exp Med Biol. 2019;1151:79–90. doi: 10.1007/978-3-030-17864-2_3. [DOI] [PubMed] [Google Scholar]
- 32.Burke JD, Young HA. IFN-γ: a cytokine at the right time, is in the right place. Semin Immunol. 2019;43:101280. doi: 10.1016/j.smim.2019.05.002. [DOI] [PMC free article] [PubMed] [Google Scholar]
- 33.Ungefroren H. Blockade of TGF-β signaling: a potential target for cancer immunotherapy. Expert Opin Ther Targets. 2019;23(8):679–693. doi: 10.1080/14728222.2019.1636034. [DOI] [PubMed] [Google Scholar]
- 34.Lu C, Rong D, Zhang B, Zheng W, Wang X, Chen Z, Tang W. Current perspectives on the immunosuppressive tumor microenvironment in hepatocellular carcinoma: challenges and opportunities. Mol Cancer. 2019;18(1):130. doi: 10.1186/s12943-019-1047-6. [DOI] [PMC free article] [PubMed] [Google Scholar]
- 35.Refolo MG, Lotesoriere C, Messa C, Caruso MG, D'Alessandro R. Integrated immune gene expression signature and molecular classification in gastric cancer: new insights. J Leukoc Biol. 2020 doi: 10.1002/JLB.4MR0120-221R. [DOI] [PubMed] [Google Scholar]
- 36.Liu J, Lichtenberg T, Hoadley KA, Poisson LM, Lazar AJ, Cherniack AD, Kovatich AJ, Benz CC, Levine DA, Lee AV, Omberg L, Wolf DM, Shriver CD, Thorsson V, Cancer Genome Atlas Research Network. Hu H. An integrated TCGA pan-cancer clinical data resource to drive high-quality survival outcome analytics. Cell. 2018;173(2):400–416.e11. doi: 10.1016/j.cell.2018.02.052. [DOI] [PMC free article] [PubMed] [Google Scholar]
- 37.Chen M, Wei L, Law CT, Tsang FH, Shen J, Cheng CL, Tsang LH, Ho DW, Chiu DK, Lee JM, Wong CC, Ng IO, Wong CM. RNA N6-methyladenosine methyltransferase-like 3 promotes liver cancer progression through YTHDF2-dependent posttranscriptional silencing of SOCS2. Hepatology. 2018;67(6):2254–2270. doi: 10.1002/hep.29683. [DOI] [PubMed] [Google Scholar]
- 38.Di Tommaso L, Spadaccini M, Donadon M, Personeni N, Elamin A, Aghemo A, Lleo A. Role of liver biopsy in hepatocellular carcinoma. World J Gastroenterol. 2019;25(40):6041–6052. doi: 10.3748/wjg.v25.i40.6041. [DOI] [PMC free article] [PubMed] [Google Scholar]
- 39.Schwabe RF, Greten TF. Gut microbiome in HCC. Mechanisms, diagnosis and therapy. J Hepatol. 2020;72(2):230–238. doi: 10.1016/j.jhep.2019.08.016. [DOI] [PubMed] [Google Scholar]
- 40.Jihye C, Jinsil S. Application of radiotherapeutic strategies in the BCLC-defined stages of hepatocellular carcinoma. Liver Cancer. 2012;1(3–4):216–225. doi: 10.1159/000343836. [DOI] [PMC free article] [PubMed] [Google Scholar]
- 41.Gentile D, Donadon M, Lleo A, Aghemo A, Roncalli M, di Tommaso L, Torzilli G. Surgical treatment of hepatocholangiocarcinoma: a systematic review. Liver Cancer. 2020;9(1):15–27. doi: 10.1159/000503719. [DOI] [PMC free article] [PubMed] [Google Scholar]
- 42.Prieto J, Melero I, Sangro B. Immunological landscape and immunotherapy of hepatocellular carcinoma. Nat Rev Gastroenterol Hepatol. 2015;12(12):681–700. doi: 10.1038/nrgastro.2015.173. [DOI] [PubMed] [Google Scholar]
- 43.Rhodes DR, Kalyana-Sundaram S, Mahavisno V, Barrette TR, Ghosh D, Chinnaiyan AM. Mining for regulatory programs in the cancer transcriptome. Nat Genet. 2005;37(6):579–583. doi: 10.1038/ng1578. [DOI] [PubMed] [Google Scholar]
- 44.Long J, Wang A, Bai Y, et al. Development and validation of a TP53-associated immune prognostic model for hepatocellular carcinoma. EBioMedicine. 2019;42:363–374. doi: 10.1016/j.ebiom.2019.03.022. [DOI] [PMC free article] [PubMed] [Google Scholar]
Associated Data
This section collects any data citations, data availability statements, or supplementary materials included in this article.


