

Abstract
Hepatocellular carcinoma (HCC), a prevalent cause of cancer-related deaths, is insensitive to traditional treatments. At different time intervals, the combined antitumor effects of DC-TEX and the programmed death protein 1 (PD-1) antibody (Ab) have not been investigated. In this study, HCC models were established and treated at different time intervals with DC-TEX alone or in combination with PD-1 Ab. In addition, we developed an orthotopic HCC model in BALB/c nude mice and restored T cells. Results demonstrated that the PD-1 + CD8 + T-cell population also increased significantly after DC-TEX treatment, in addition to the increased number of CD8 + T cells. The number of CD8 + T cells increased 72 h after DC-TEX administration. Similar observations were made for PD-1 + CD8 + T cells. Subsequently, PD-1 Ab was administered in combination with DC-TEX at different time points (0, 24, 72, 96, 120, or 168 h). Surprisingly, the combination treatment demonstrated a strong antitumor effect, which was very prominent when PD-1 Ab was administered at 72 h. PD-1 Ab significantly reversed the proliferative ability of PD-1 + CD8 + T cells at 72 h in vitro. The combined antitumor effects of PD-1 Ab and DC-TEX occurred mainly by stimulating CD8 + T cell proliferation and inhibiting T cell exhaustion. In conclusion, our results indicate that the combination of DC-TEX and PD-1 Ab significantly inhibits tumor growth in a murine HCC model and that the timing of PD-1 Ab administration impacts the antitumor effect.
Supplementary Information
The online version contains supplementary material available at 10.1007/s00262-023-03525-0.
Keywords: PD-1 antibody, Exosomes, Dendritic cells, Hepatocellular carcinoma, Immunotherapy
Introduction
Hepatocellular carcinoma (HCC), one of the most aggressive cancers, is the fourth leading cause of cancer-related deaths globally, with increasing incidence over the last two decades [1, 2]. Unfortunately, many patients with early stage HCC are asymptomatic and can only be diagnosed at intermediate and advanced stages. However, patients with advanced HCC barely respond to regular chemo- or radiotherapy. At present, sorafenib, a multi kinase inhibitor, is the only systemic therapy for advanced HCC approved by the US Food and Drug Administration. However, most patients rapidly become sorafenib-resistant, with a survival time of < 3 months [3, 4]. Therefore, novel, effective treatments for advanced HCC are urgently required.
Recently, immunotherapy has emerged as a promising treatment for HCC in several studies [5]. One study demonstrated that defective T-cell responses and functional defects in antigen presentation significantly decrease the immune function of patients with HCC [6]. Simultaneously, the number of T-infiltrating lymphocytes in tumor tissue may predict the prognosis of patients with HCC [7]. Tumor-associated antigens are crucial in immunotherapy. Dendritic cells (DCs) are antigen-presenting cells that possess the unique ability to process and present antigens that can elicit tissue-specific T-cell responses and alter the tumor microenvironment [8, 9]. One important pathway to activate antigen-presenting DCs in tumors is via tumor-released exosomes (TEXs). Exosomes are small membrane vesicles (30–100 nm) secreted by most cell types, including tumor cells [10]. TEX expresses tumor-specific antigens that can be processed by DCs, activate DCs, and induce antigen-specific CD8 + T cells to exhibit antitumor effects [11]. Interestingly, when tumor-derived exosomes were used as vaccines in an HCC mouse model, immunogenicity was even higher than when tumor cell lysates were used [12].
With chronic antigen exposure, tumor antigen-specific CD8 + T cells become dysfunctional, exhausted, and lose their ability to proliferate and produce cytokines [13]. Dysfunctional tumor antigen-specific CD8 + T cells upregulate immunoinhibitory receptors, including programmed cell death protein 1 (PD-1) [14]. PD-1, a 55-kD type I transmembrane protein of the immunoglobulin superfamily, is an immunoinhibitory receptor whose expression is inducible in activated T cells. In the tumor microenvironment, tumor antigens may induce PD-1 expression on CD8 + T cells, and these PD-1 + CD8 + T cells exhibit an impaired ability to produce effector cytokines upon binding with programmed death ligand 1 (PD-L1) [15, 16]. In patients with melanoma, the interactions of PD-1/PD-L1 not only impair the ability of spontaneously induced specific CD8 + T cells but also of those induced by vaccine [17]. Abundant experimental and clinical evidence has shown that blocking the PD-1 axis reverses the dysfunction and exhaustion of activated T cells and provides a significant benefit for the tumor microenvironment by enabling exhausted T cells to proliferate and produce effector cytokines [18, 19].
Based on the characteristics of DC-TEX and PD-1, we postulated that combination treatment with DC-TEX and PD-1 antibody (Ab) would improve antitumor responses. We examined the feasibility of these two treatment methods in HCC models and how to use them to improve antitumor efficacy. We found that the combined treatment performed better than DC-TEX treatment alone. We also found that the timing of the PD-1 Ab treatment significantly affected the antitumor effects of the combined therapy.
Materials and methods
Cell lines
The murine HCC cell line Hepa 1–6 was purchased from the Cell Bank of the Chinese Academy of Sciences (Shanghai, China) and cultured in Dulbecco's Modified Eagle Medium (DMEM; HyClone) supplemented with 10% fetal bovine serum (FBS; Gibco) and 1% penicillin–streptomycin in a 37 °C incubator with 5% CO2. The murine cell line DC2.4 (DCs) was kindly provided by Dr. De Yang (Center for Cancer Research, National Institutes of Health, Bethesda, MD, USA) and cultured as described previously [12].
Mice and HCC model
C57BL/6, BALB/c, and BALB/c nude mice (4–6 weeks old) were purchased from Beijing Vital River Laboratory Animal Technology Co. Ltd. and were housed under pathogen-free conditions in the Tianjin Animal Unit (SYXK 2011-0008). Animal studies were approved by the Experimental Animal Management Committee of the Chinese Academy of Medical Sciences and Peking Union Medical College Institute of Biomedical Engineering. The orthotopic HCC model was established using tissue implantation as previously described [12]. Briefly, Hepa 1–6 cells (4 × 10⁶/50 µL) were injected subcutaneously into the left axilla of mice. When the tumor grew to 1 cm in diameter, it was excised and cut into blocks of approximately 1 mm3, while the necrotic tissue was removed. Two tumor blocks were implanted into the left lobe of the liver of a C57BL/6 mouse or a BALB/c nude mouse under celiac anesthesia with 4% chloral hydrate. To establish autochthonous HCC mouse models, each of the 15-day-old C57BL/6 mice received a single dose of 50 µg/g body weight diethylnitrosamine (DENA; Sigma) by intraperitoneal injection and was used in this study after 8 months. In BALB/c nude mice, the properties of T cells were restored by injecting T cells derived from the thymus gland of BALB/c mice (4 weeks old).
Treatment
Fourteen days after tissue implantation, mice with an established orthotopic HCC tumor confirmed by magnetic resonance imaging (MRI, 3.0 Tesia, Signa Excite HDx; GE Healthcare, Milwaukee, WI, USA) were randomized by tumor size to ensure similar baseline tumor sizes across groups. For autochthonous HCC mouse models, treatment was initiated 8 months after DENA injection. Tumor volume was calculated using the following formula: tumor volume (mm3) = a × b2 × 0.5, where a and b represent the longest and shortest diameters, respectively. Mice were treated with DC-TEX [4 × 10⁶, intravenous injection, DCs pulsed with exosomes (40 μg/mL) for 48 h] and/or PD-1 Ab (200 μg, intraperitoneal injection, clone J43; BioXCell, West Lebanon, NH, USA).
Generation and purification of exosomes and loading of DCs with tumor exosomes
Exosomes were isolated from Hepa 1–6 cell culture supernatant by ultracentrifugation by previously described procedure [18]. Briefly, centrifugation at 2000 × g for 20 min and 10,000 × g for 30 min was performed to discard dead cells and cell debris, followed by ultracentrifugation at 100,000 × g for 70 min (Hitachi, Tokyo, Japan). The exosome pellets were washed with phosphate-buffered saline (PBS) and centrifuged at 100,000 × g for 70 min before resuspension in PBS. The protein concentration was determined using a Pierce BCA Protein Assay Kit (Thermo Fisher Scientific, Waltham, MA, USA) and adjusted to 1 μg/μL before storage at − 80 °C until further use. To prepare DC-TEX, DCs were pulsed with exosomes (40 µg/mL) for 48 h in DMEM, which allowed the DCs to capture and present tumor-associated antigens. The concentration of exosomes was previously confirmed [12], and DCs pulsed with exosomes (40 µg/mL) exhibited a superior antitumor effect in orthotopic murine HCC models.
Flow cytometry analysis
Flow cytometry was performed to determine the number of T lymphocytes in the tumor tissue. A single-cell suspension of tumor tissue was generated, as described previously, by digestion with collagenase type IV (0.05 mg/mL; Gibco, Invitrogen) and 40% Percoll (Solarbio, Beijing, China) to enrich tumor-infiltrating lymphocytes [12]. The collected cells were stained with fluorescently labeled monoclonal Abs: FITC-conjugated CD3e (clone 145-2C11), APC-conjugated CD8a (clone 53-6.7) and PE-conjugated PD-1 (clone J43). All Abs were purchased from eBioscience (San Diego, CA, USA) and detected using a flow cytometer with a four-color BD Accuri C6 (BD Biosciences, CA, USA). The analysis was performed using the BD Accuri C6 software (BD Biosciences).
Immunohistochemistry
Tumor tissues were routinely embedded in paraffin and cut into 4-μm-thick sections for immunohistochemical staining of CD8. The tumor sections were first deparaffinized in xylene and then rehydrated using a graded alcohol series. Antigen retrieval was subsequently performed at 100 °C in citrate buffer for 30 min followed by treatment with 3% H2O2 for 10 min to inhibit endogenous peroxidase activity. The sections were blocked with 10% goat serum for 15 min and then stained with primary anti-mouse CD8 (ab22378, 1:1000; Abcam) polyclonal Abs overnight at 4 °C. The next day, the sections were treated with a secondary Ab (KPL, 074-1506, Ab to rabbit IgG) for 30 min at 37 °C and then stained with diaminobenzidine, followed by counterstaining with hematoxylin.
Cytokine detection using enzyme-linked immunosorbent assay (ELISA)
The serum levels of cytokines including interleukin (IL)-2, IL-10, tumor necrosis factor-α (TNF-α), interferon-γ (IFN-γ), transforming growth factor-β (TGF-β), and α-fetoprotein (AFP) were measured using ELISA kits by following the manufacturer's instructions.
Statistical analysis
All data are presented as mean ± standard deviation. The statistical significance of the differences between the groups was assessed using ANOVA. P values < 0.05 in a two-tailed test were considered statistically significant. Overall survival was evaluated using the Kaplan–Meier method. Statistical analyses were performed using SPSS 16.0.
Results
DC-TEX increased the number of CD8 + T cells and upregulated the levels of cytokines in orthotopic HCC mice
To verify whether DC-TEX activates the T-cell immune response, we first examined the number of CD8 + T cells and effector cytokine production levels after DC-TEX treatment in an orthotopic HCC mouse model. The number of CD8 + T cells in the tumor tissue was determined using flow cytometry at 0, 24, 72, 120, and 168 h after injection with DC-TEX. The results demonstrated that the number of CD8 + T cells in tumor tissue initially increased and peaked at 72 h, whereas it started to decrease at 120 h (Fig. 1A and B). Additionally, we evaluated the levels of cytokines including IFN-γ, IL-2, TNF-α, IL-10, and TGF-β in the serum using ELISA. T-cell activation with DC-TEX increased the production of several cytokines, including IFN-γ, IL-2, and TNF-α. Interestingly, the levels of IFN-γ, IL-2, and TNF-α peaked at 72 h (Fig. 1C–E). DC-TEX has been reported to alter the tumor environment by decreasing the levels of IL-10 and TGF-β. In this study, we also found that the levels of IL-10 and TGF-β decreased after DC-TEX treatment (Fig. 1F, G). We observed variations in the levels of CD8 + T cells and cytokines after the injection of DC-TEX (exosome characteristics are presented in Supplementary Figure S1 A and B) in orthotopic HCC mice.
Fig. 1.

CD8 + T cell numbers and cytokine production levels increased after DC-TEX injection in vivo. A–B The number of CD8 + T cells in tumor tissues. After injecting DC-TEX, CD8 + T cells were collected at 0, 24, 72, 120, and 168 h by flow cytometry. C–E Serum IFN-γ, IL-2, and TNF-α levels were analyzed by ELISA. The process of T-cell activation produced several cytokines. IFN-γ, IL-2, and TNF-α levels peaked at 72 h but did not significantly increase at 120 and 168 h. F and G Serum IL-10 and TGF-β levels were significantly different at 0, 24, and 72 h but did not significantly decrease at 120 and 168 h (n = 6 mice/group, *P < 0.05, **P < 0.01, and ***P < 0.001)
PD-1 + CD8 + T cells were significantly elevated 72 h after injection of DC-TEX
To determine the time taken for CD8 + T cells to reach exhaustion, we analyzed PD-1 + CD8 + T cells in tumor tissues derived from HCC model mice using flow cytometry at different time points after DC-TEX treatment. The PD-1 + CD8 + T cell number peaked at 72 h after therapy with DC-TEX in the tumor tissue (Fig. 2A and B). The number of PD-1 + CD8 + T cells at 72 h was higher than that at 0 and 24 h (P < 0.05); no significant increase in cell numbers was observed further until 168 h, whereas a downward trend was observed post 168 h (P > 0.05). Additionally, we used mouse IgG1 K isotype control PE as the PD-1 Ab; however, no significant differences were observed at different time points (Supplementary Figure S2 A and B). T cells from the spleens of C57 mice were cocultured with DC-TEX and PD-1 expression at different time points (0–168 h) was observed. We found that PD-1 expression increased gradually during T cell activation (Fig. 2C, Supplementary Figure S3) from 0 to 72 h (P < 0.05). Quantitative reverse-transcription polymerase chain reaction (qRT-PCR) analysis revealed that PD-1 mRNA (PDCD1) showed the highest expression at 72 h (Fig. 2D). Consistently, the PD-1 protein also demonstrated the highest expression at 72 h in western blotting (Fig. 2E).
Fig. 2.

The variation of PD-1 expression in CD8 + T cells. A and B The number of PD-1 + CD8 + T cells in tumor tissues at different time points is presented. The trend showed that the number of PD-1 + CD8 + T cells increased significantly from 0 to 72 h but did not further increase from 72 to 168 h (P > 0.05) (n = 6 mice/group, **P < 0.01, ***P < 0.001). C T cells derived from the spleen of C57 mice were cocultured with DC-TEX, and the number of PD-1 + T cells significantly varied from 0 to 72 h (***P < 0.001). D qRT-PCR analysis revealed that PD-1 mRNA expression was highest at 72 h (*P < 0.05, **P < 0.01, and ***P < 0.001). E T cells and DC-TEX were cocultured and showed the highest expression of PD-1 at 72 h in western blotting
To confirm these results independently, we developed an orthotopic HCC model using immune-deficient BALB/c nude mice. First, the T cell population of BALB/c nude mice was restored by injecting T cells derived from the thymus. Next, DC-TEXs (DCs derived from the bone marrow of BALB/c mice) were administered to these mice and T cell proliferation and IFN-γ production was observed post treatment. We found that both observations recapitulated previous results; both the PD-1 + CD8 + T cell numbers in the tumor tissues and the cytokine IFN-γ level peaked at 72 h (Supplementary Figure S4).
Treatment with PD-1 Ab at different time points after DC-TEX injection has different antitumor efficacies
Thus far, we have shown that DC-TEX treatment significantly stimulates CD8 + T cell proliferation and cytokine production. We also showed the evidence of T cell exhaustion via its expression of PD-1. Therefore, we tested whether the combination of DC-TEX and PD-1 inhibition would provide a better antitumor effect. We assessed the efficacy of PD-1 Ab administration at 0, 24, 72, 120, and 168 h after DC-TEX injection. On day 14 after the implantation of tumor tissue into C57 mice, we performed MRI to confirm the sizes of tumors in the established orthotopic HCC model mice (Supplementary Figure S5 A and B) prior to DC-TEX injection. The treatment schedule is presented in Supplementary Figure S6. DC-TEXs (4 × 10⁶) were injected intravenously, and 200 µg PD-1 Ab was injected intraperitoneally thrice at weekly intervals. On day 40, the tumor weights were evaluated, and the 72 h group presented a superior result (Fig. 3A and B). Additionally, the number of CD8 + T cells (Fig. 3C) and the levels of IFN-γ, IL2, and TNF-α (Supplementary Figure S7 A–C) were significantly elevated in the 72 h group. We detected the level of AFP using an ELISA kit and found that the level in the 72 h group was significantly lower than that in the other groups (Fig. 3D). Furthermore, we observed the survival times of all groups, and the 72 h group showed significantly prolonged survival (Fig. 3E). These results demonstrate that the timing of PD-1 Ab administration after DC-TEX injection significantly influenced the antitumor efficacy of the combined therapy.
Fig. 3.

Treatment with PD-1 Ab and DC-TEX at different time points affected treatment efficacy. A and B Tumor weights measured in each group on day 40 after implantation were significantly lower in the 72 h group than in the other groups. C The number of CD8 + T cells in tumor tissues was detected by flow cytometry. D Serum AFP level, analyzed using an ELISA kit, was significantly lower in the 72 h group compared with the other groups. E The survival times of all groups were analyzed using the Kaplan–Meier method (n = 6 mice/group, *P < 0.05, **P < 0.01, and ***P < 0.001)
PD-1 Ab reversed the proliferative ability of PD-1 + CD8 + T cells
To verify whether PD-1 inhibition reversed the proliferative ability of PD-1 + CD8 + T cells in vitro, we separated CD8 + T cells from the spleens of C57 mice by magnetic activated cell sorting and cocultured them with DC-TEX (Supplementary Figure S8). CD8 + T cells derived from the spleen were labeled with 5,6-carboxyfluorescein diacetate succinimidy lester (CFSE) and cocultured with DC-TEX. Subsequently, PD-1 Ab was added to the coculture at different time points (0–168 h). The proliferation of CD8 + T cells significantly increased at 72 h (Fig. 4A and B). Additionally, effective cytolysis against Hepa1-6 cells showed a significant difference for different effector-to-target ratios, with treatment for 72 h demonstrating a superior antitumor effect (Fig. 4C). Subsequently, we selected 0 and 72 h time points to analyze granzyme B + CD8 + T cells and perforin + CD8 + T cells by flow cytometry, with significantly higher levels observed at 72 h than at 0 h (Fig. 4D, E). Additionally, the numbers of IFN-γ + CD8 + T cells and TNF-α + CD8 + T cells were higher at 72 h than at 0 h (Supplementary Figure S9). This confirmed the varying antitumor effects at different time points using PD-1 Ab.
Fig. 4.

PD-1 + CD8 + T cell proliferative ability was affected by PD-1 Ab in vitro. A and B The PD-1 + CD8 + T cells were labeled with CFSE and then cocultured with PD-1 Ab (20 µg/ml) to analyze their proliferative ability by flow cytometry. C Cytolysis assay for CD8 + T cells activated by DC-TEX plus PD-1 Ab at different time points against Hepa 1–6 cells at different ratios. D and E Analysis of granzyme B + CD8 + T cells and perforin + CD8 + T cells by flow cytometry (*P < 0.05 and ***P < 0.001)
Antitumor effect of PD-1 Ab and DC-TEX is mainly dependent on CD8 + T cell
The antitumor effect of DC-TEX is mediated by CD8 + T-cells. This is demonstrated by the fact that DC-TEX does not have an antitumor effect in BALB/c nude mice (Fig. 5A) [12]. To further confirm the role of CD8 + T cells, we blocked CD4 and CD8 with Abs separately and collectively in a C57 mouse tumor model to observe the antitumor effect of DC-TEX combined with PD-1 Ab under such circumstances. The antitumor effect was not affected after blocking CD4 (Fig. 5B), but disappeared after blocking CD8 alone or both CD4 and CD8 simultaneously (Fig. 5C and D). This verified that the antitumor effect of DC-TEX combined with the PD-1 Ab was mainly dependent on CD8 + T cells.
Fig. 5.
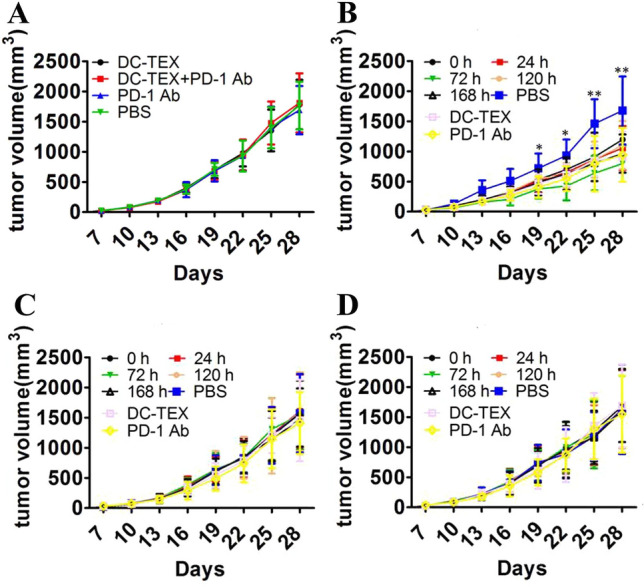
The antitumor effect of DC-TEX and PD-1 Ab was mediated by CD8 + T cells. Tumor volume measurements post treatment in HCC model in BALB/c nude mice (A) and HCC model established in C57 mice (B–D). A DC-TEX and PD-1 Ab did not show antitumor effect in T cell-deficient BALB/c nude mice. B CD4 Ab was used on days − 2, − 1, and 0 to block CD4 + T cells before DC-TEX and PD-1 Ab treatment. C CD8 Ab was used on days − 2, − 1, and 0 to block CD8 + T cells before DC-TEX and PD-1 Ab treatment. D CD4 and CD8 Abs were simultaneously used on days − 2, − 1, and 0 to block CD4 + T cells and CD8 + T cells before DC-TEX and PD-1 Ab treatment (n = 6 mice/group, *P < 0.05, **P < 0.01, and ***P < 0.001)
Combination of DC-TEX and PD-1 Ab suppresses tumor growth in a chemically induced HCC murine model
To determine whether the antitumor effects of DC-TEX and PD-1 Ab combined therapy were independent of the creation methods of tumor models, we further evaluated whether the combined therapy could suppress tumor growth in a chemically induced HCC model. C57 mice born on the 15th day were intraperitoneally injected with DENA 50 mg/kg body weight and fed for 28 weeks prior to treatment. We divided the mice into six groups: DC-TEX and PD-1 Ab (0, 72, and 120 h), DC-TEX, PD-1 Ab, and PBS control. The treatment schedule is shown in Supplementary Figure S10. The number of DC-TEXs and the dosage of PD-1 Ab were as previously described. The DC-TEX group was injected intravenously and the PD-1 Ab group was injected intraperitoneally into a chemically induced HCC model thrice at 7-day intervals. At week 32, immunohistochemical and flow cytometric analyses of CD8 + T cells were performed. We found that the 72 h group had a significantly higher number of these cells than the other groups (Fig. 6A and B). Moreover, the level of AFP in the 72 h group was significantly lower than that in the other groups (Fig. 6C). The levels of IFN-γ (Fig. 6D), IL-2, and TNF-α (Supplementary Figure S11) in the 72 h group were also significantly higher than those in the other groups. Liver weight was also significantly lower in the 72 h group than in the other groups (Fig. 6E and F).
Fig. 6.

The antitumor effect of DC-TEX and PD-1 Ab in a chemically induced HCC model. A The immunohistochemistry analysis of CD8 + T cells in tumor tissues (scale bar, 50 μm). B CD8 + T cells in tumor tissues were analyzed by flow cytometry. The number of CD8 + T cells in the 72 h group was significantly increased. C AFP levels, as assessed by ELISA, were significantly lower in the 72 h group than in other groups. D IFN-γ levels were significantly higher in the 72 h group than in other groups, as assessed by ELISA. E–F Measurements of liver weights in mice (n = 6 mice/group, *P < 0.05, **P < 0.01, and ***P < 0.001)
Discussion
HCC is one of the most common primary liver tumors, with high recurrence and metastasis rates and increasing incidence [20]. Surgical resection remains the primary treatment option for patients with HCC at present. Unfortunately, the recurrence rate of HCC following surgical resection remains high. In addition, most patients are diagnosed at an advanced stage, when treatment options are limited and rarely effective.
Immunotherapy has an apparent advantage in HCC treatment. For example, treatment with DC-based cancer vaccines has been demonstrated to be an appealing approach that takes advantage of antitumor immune responses [21]. These responses primarily depend on cytotoxic T lymphocytes (CTLs) [22]. The number of tumor antigen-specific T cells is important for eliminating tumor cells, and in some studies, this number aided in the prognosis of patients with HCC [23, 24]. In most cases, although many tumor antigen-specific T cells are present in tumor tissues, tumors continue to grow. One of the primary explanations for this phenomenon is that the tumor microenvironment weakens the antitumor immune responses of tumor antigen-specific T cells [25].
Some studies have demonstrated that tumor antigen-specific T cells suppress tumor growth in HCC [26–28]. In these studies, antigen-specific T-cells were activated by tumor antigens and exhibited increased proliferation and cytokine secretion. These results demonstrate that treatment with DC-TEX significantly increased the number of antigen-specific T cells and levels of cytokines. In our study, we observed that the number of CD8 + T cells was significantly increased after DC-TEX treatment. We also found that PD-1 + CD8 + T cells showed a similar increasing trend. This result is consistent with the fact that PD-1 is expressed on T cells when they are stimulated by the antigen [29]. This may also explain the pressing question as to why significantly elevated antigen-specific T cell population rarely promotes tumor regression [30, 31].
Some studies have confirmed that the PD-L1/PD-1 axis plays an important role in immune escape and negative immune regulation [32, 33]. PD-1 present mainly on activated T cells binds to PD-L1 and induces T cell exhaustion. The antitumor effect of exhausted T cells is significantly decreased. Blocking PD-1 and PD-L1 binding can restore the ability of exhausted CD8 + T cells to proliferate, secrete cytokines, and attack tumors with a remarkable and durable objective response [23, 34, 35]. In our study, the PD-1 Ab treatment group showed a distinct antitumor effect compared with the PBS control group. This indicates that the PD-1 Ab can block PD-1 and PD-L1 binding in spontaneous antigen-specific CTLs. Compared to the PBS group, the number of CD8 + T cells was significantly increased in the PD-1 Ab treatment group; cytokine levels revealed a similar increase.
PD-1 mRNA and protein expression levels are correlated with activation-induced apoptosis in murine thymocytes and show time-dependent upregulation [36]. In our study, the timing of PD-1 Ab administration after DC-TEX treatment affected its efficacy. This indicates that T cell exhaustion induced by DC-TEX could be restored by blocking the interaction between PD-1 and PD-L1. The cytokine and cytolytic activity-producing abilities of PD-1 + CD8 + T cells were weakened or inhibited when PD-1 + CD8 + T cells were bound to PD-L1 in the tumor tissue [37]. Fourcade et al. demonstrated that vaccines could activate tumor antigen-specific CD8 + T cells and induce higher IFN-γ production and lytic function. PD-1 is upregulated in antigen-specific CD8 + T cells. This indicates that the upregulated expression of the inhibitory receptor PD-1 on antigen-specific CD8 + T cells correlates with treatment with tumor vaccines [38].
Remarkably, a rational combination treatment comprising DC-TEX, activating tumor-specific T cells, and PD-1 Ab, inhibiting the PD-1 checkpoint, presented a superior antitumor response. Sierro et al. demonstrated that recombinant lentiviral vectors could induce specific antitumor CD8 + T cells and that these specific antitumor CD8 + T cells also expressed PD-1 and failed to produce cytokines. Blocking the PD-1 and PD-L1 inhibitory pathway enhances the efficacy of vaccination with recombinant lentiviral vectors in a mouse model [39]. After the PD-1 and PD-L1 inhibitory pathway was blocked by the PD-1 Ab, antitumor CD8 + T cells in a state of exhaustion were rescued and cytokine production and proliferation were restored [40]. An important observation was that the tumor antigen-specific IFN-γ produced by T cells plays an important role in determining the success of therapeutic tumor vaccines [41]. DC-TEX stimulates T-cell proliferation and antitumor effects until T cells begin to exhaust. Therefore, PD-1 Ab administration before T-cell exhaustion may not have any synergistic effect. Therefore, we tested different timings of PD-1 Ab administration and found that the timing is indeed critical for PD-1 Ab efficacy.
In summary, our study demonstrates that PD-1 Ab elevates antitumor efficacy by restoring exhausted tumor antigen specific-CD8 + T cells activated by DC-TEX. The timing of PD-1 Ab administration played an important role in restoring exhausted antigen specific-CD8 + T cells. The combination of DC-TEX and PD-1 Abs showed superior results in inducing an antitumor response to HCC in mice.
Supplementary Information
Below is the link to the electronic supplementary material.
Acknowledgements
This work was supported by the Peking Union Medical College Innovation Research Team Fund, the Union Young Fund of Peking Union Medical College (3332016105) and the Sci-tech Development Project of Shandong Medicine and Health (2016WS0552) and the Natural Science Foundation of Shandong (ZR2017PH024) and the National Natural Science Foundation of China (81702821).
Author contributions
CC and YP performed the experiments, analyzed the data and prepared the manuscript. CZ and WZ aided the data analysis and manuscript preparation. YQ contributed data analysis. SS designed and supervised the study, analyzed the data, prepared and revised the manuscript. All authors read and approved the final manuscript.
Declarations
Conflict of interest
The authors declare that they have no conflict of interests.
Footnotes
Publisher's Note
Springer Nature remains neutral with regard to jurisdictional claims in published maps and institutional affiliations.
References
- 1.Siegel R, Naishadham D, Jemal A (2019) Cancer statistics, 2019. CA Cancer J Clin 69(1):7–34 [DOI] [PubMed] [Google Scholar]
- 2.Hou J, Zhang H, Sun B et al (2020) The immunobiology of hepatocellular carcinoma in humans and mice: basic concepts and therapeutic implications. J Hepatol 72(1):167–182 [DOI] [PubMed] [Google Scholar]
- 3.Schmidt TM, Liu LI, Abraham IE et al (2011) Efficacy and safety of sorafenib in a racially diverse patient population with advanced hepatocellular carcinoma. Anticancer Res 38(7):4027–4034 [DOI] [PubMed] [Google Scholar]
- 4.Juengpanich S, Topatana W, Chen Lu et al (2020) Role of cellular, molecular and tumor microenvironment in hepatocellular carcinoma: possible targets and future directions in the regorafenib era. Int J Cancer 147(7):1778–1792 [DOI] [PubMed] [Google Scholar]
- 5.Iñarrairaegui M, Melero I (2018) Immunotherapy of hepatocellular carcinoma: facts and hopes. Clin Cancer Res 24(7):1518–1524 [DOI] [PubMed] [Google Scholar]
- 6.Zhen Lu, Zuo B, Jing R et al (2017) Dendritic cell-derived exosomes elicit tumor regression in autochthonous hepatocellular carcinoma mouse models. J Hepatol 67(4):739–748 [DOI] [PubMed] [Google Scholar]
- 7.Zhang Q, Huang H, Zheng F et al (2020) Resveratrol exerts antitumor effects by downregulating CD8 + CD122 + Tregs in murine hepatocellular carcinoma. Oncoimmunology 9(1):1829346 [DOI] [PMC free article] [PubMed] [Google Scholar]
- 8.Zhou H, Li Wu (2017) The development and function of dendritic cell populations and their regulation by miRNAs. Protein Cell 8(7):501–513 [DOI] [PMC free article] [PubMed] [Google Scholar]
- 9.Merad M, Salmon H (2015) A dendritic-cell brake on antitumour immunity. Nature 523:294–295 [DOI] [PMC free article] [PubMed] [Google Scholar]
- 10.Gurunathan S, Kang M-H, Jeyaraj M et al (2019) Review of the isolation, characterization, biological function, and multifarious therapeutic approaches of exosomes. Cells 8(4):307 [DOI] [PMC free article] [PubMed] [Google Scholar]
- 11.Wolfers J, Lozier A, Raposo G et al (2001) Tumor-derived exosomes in cancer metastasis risk diagnosis and metastasis therapy. Nat Med 7:297–303 [DOI] [PubMed] [Google Scholar]
- 12.Rao Q, Zuo B, Lu Z et al (2016) Tumor-derived exosomes elicit tumor suppression in murine hepatocellular carcinoma models and humans in vitro. Hepatology 64(2):456–472 [DOI] [PubMed] [Google Scholar]
- 13.Gholami MD, Kardar GA, Saeedi Y et al (2017) Exhaustion of T lymphocytes in the tumor microenvironment: significance and effective mechanisms. Cell Immunol 322:1–14 [DOI] [PubMed] [Google Scholar]
- 14.Celis-Gutierrez J, Blattmann P, Zhai Y et al (2019) Quantitative interactomics in primary T cells provides a rationale for concomitant PD-1 and BTLA coinhibitor blockade in cancer immunotherapy. Cell Rep 27(11):3315–3330 [DOI] [PMC free article] [PubMed] [Google Scholar]
- 15.Kim H-D, Song G-W, Park S et al (2018) Association between expression level of PD1 by tumor-infiltrating CD8 + T cells and features of hepatocellular carcinoma. Gastroenterology 155(6):1936–1950 [DOI] [PubMed] [Google Scholar]
- 16.Chiu DK-C, Yuen VW-H, Cheu JW-S et al (2020) Hepatocellular carcinoma cells up-regulate PVRL1, stabilizing PVR and inhibiting the cytotoxic T-cell response via TIGIT to mediate tumor resistance to PD1 inhibitors in mice. Gastroenterology 159(2):609–623 [DOI] [PubMed] [Google Scholar]
- 17.Fourcade J, Sun Z, Benallaoua M et al (2010) Upregulation of Tim-3 and PD-1 expression is associated with tumor antigen-specific CD8+ T cell dysfunction in melanoma patients. J Exp Med 207(10):2175–2186 [DOI] [PMC free article] [PubMed] [Google Scholar]
- 18.Wang X, Yang X, Zhang C et al (2020) Tumor cell-intrinsic PD-1 receptor is a tumor suppressor and mediates resistance to PD-1 blockade therapy. Proc Natl Acad Sci U S A 117(12):6640–6650 [DOI] [PMC free article] [PubMed] [Google Scholar]
- 19.Tumeh PC, Harview CL, Yearley JH et al (2014) PD-1 blockade induces responses by inhibiting adaptive immune resistance. Nature 515:568–571 [DOI] [PMC free article] [PubMed] [Google Scholar]
- 20.Torre LA, Bray F, Siegel RL et al (2015) Global cancer statistics, 2012. CA Cancer J Clin 65(2):87–108 [DOI] [PubMed] [Google Scholar]
- 21.Wculek SK, Cueto FJ, Mujal AM et al (2014) Dendritic cells in cancer immunology and immunotherapy. Curr Opin Immunol 27:26–32 [DOI] [PubMed] [Google Scholar]
- 22.Copier J, Dalgleish A (2020) Overview of tumor cell-based vaccines. Nat Rev Immunol 20(1):7–24 [DOI] [PubMed] [Google Scholar]
- 23.Li G, Liu D, Cooper TK et al (2017) Successful chemoimmunotherapy against hepatocellular cancer in a novel murine model. J Hepatol 66:75–85 [DOI] [PMC free article] [PubMed] [Google Scholar]
- 24.Brunner SM, Rubner C, Kesselring R et al (2015) Tumor-infiltrating, interleukin-33-producing effector-memory CD8(+) T cells in resected hepatocellular carcinoma prolong patient survival. Hepatology 61:1957–1967 [DOI] [PubMed] [Google Scholar]
- 25.Di Blasio S, van Wigcheren GF, Becker A et al (2020) The tumour microenvironment shapes dendritic cell plasticity in a human organotypic melanoma culture. Nat Commun 11(1):2749 [DOI] [PMC free article] [PubMed] [Google Scholar]
- 26.Chen Lu, Rong D, Zhang B et al (2019) Current perspectives on the immunosuppressive tumor microenvironment in hepatocellular carcinoma: challenges and opportunities. Mol Cancer 18(1):130 [DOI] [PMC free article] [PubMed] [Google Scholar]
- 27.Hendrickson PG, Olson M, Luetkens T et al (2019) The promise of adoptive cellular immunotherapies in hepatocellular carcinoma. Oncoimmunology 9(1):1673129 [DOI] [PMC free article] [PubMed] [Google Scholar]
- 28.Flecken T, Schmidt N, Hild S et al (2014) Immunodominance and functional alterations of tumor-associated antigen-specific CD8+ T-cell responses in hepatocellular carcinoma. Hepatology 59:1415–1426 [DOI] [PMC free article] [PubMed] [Google Scholar]
- 29.Agata Y, Kawasaki A, Nishimura H et al (1996) Expression of the PD-1 antigen on the surface of stimulated mouse T and B lymphocytes. Int Immunol 8(5):765–772 [DOI] [PubMed] [Google Scholar]
- 30.Rosenberg SA, Yang JC, Restifo NP (2004) Cancer immunotherapy: moving beyond current vaccines. Nat Med 10:909–915 [DOI] [PMC free article] [PubMed] [Google Scholar]
- 31.Jacquelot N, Yamazaki T, Roberti MP et al (2019) Sustained Type I interferon signaling as a mechanism of resistance to PD-1 blockade. Cell Res 29(10):846–861 [DOI] [PMC free article] [PubMed] [Google Scholar]
- 32.Hailemichael Y, Dai Z, Jaffarzad N et al (2013) Persistent antigen at vaccination sites induces tumor-specific CD8(+) T cell sequestration, dysfunction and deletion. Nat Med 19:465–472 [DOI] [PMC free article] [PubMed] [Google Scholar]
- 33.Danilova L, Wang H, Sunshine J et al (2016) Association of PD-1/PD-L axis expression with cytolytic activity, mutational load, and prognosis in melanoma and other solid tumors. Proc Natl Acad Sci U S A 113:E7769–E7777 [DOI] [PMC free article] [PubMed] [Google Scholar]
- 34.Mariathasan S, Turley SJ, Nickles D et al (2018) TGFβ attenuates tumour response to PD-L1 blockade by contributing to exclusion of T cells. Nature 554(7693):544–548 [DOI] [PMC free article] [PubMed] [Google Scholar]
- 35.Sprinzl MF, Galle PR (2017) Current progress in immunotherapy of hepatocellular carcinoma. J Hepatol 66:482–484 [DOI] [PubMed] [Google Scholar]
- 36.Vibhakar R, Juan G, Traganos F et al (1997) Activation-induced expression of human programmed death-1 gene in T-lymphocytes. Exp Cell Res 232(1):25–28 [DOI] [PubMed] [Google Scholar]
- 37.Wu X, Zhang H, Xing Q et al (2014) PD-1(+) CD8(+) T cells are exhausted in tumours and functional in draining lymph nodes of colorectal cancer patients. Br J Cancer 111:1391–1399 [DOI] [PMC free article] [PubMed] [Google Scholar]
- 38.Fourcade J, Sun Z, Pagliano O et al (2014) PD-1 and Tim-3 regulate the expansion of tumor antigen-specific CD8+ T cells induced by melanoma vaccines. Cancer Res 74:1045–1055 [DOI] [PMC free article] [PubMed] [Google Scholar]
- 39.Sierro SR, Donda A, Perret R et al (2011) Combination of lentivector immunization and low-dose chemotherapy or PD-1/PD-L1 blocking primes self-reactive T cells and induces antitumor immunity. Eur J Immunol 41:2217–2228 [DOI] [PubMed] [Google Scholar]
- 40.Inada Y, Mizukoshi E, Seike T et al (2019) Characteristics of immune response to tumor-associated antigens and immune cell profile in patients with hepatocellular carcinoma. Hepatology 69(2):653–665 [DOI] [PubMed] [Google Scholar]
- 41.Finck A, Gill SI, June CH (2020) Cancer immunotherapy comes of age and looks for maturity. Nat Commun 11(1):3325 [DOI] [PMC free article] [PubMed] [Google Scholar]
Associated Data
This section collects any data citations, data availability statements, or supplementary materials included in this article.