Abstract
Lung adenocarcinoma (LUAD), the most common type of cancer, is hard to diagnose and has an unfavorable prognosis. Tumor mutation burden (TMB) is a useful predictor and can also determine the efficacy of immunotherapy in various cancers. The present study focused on unraveling the association between immune infiltration and TMB and developing an immune- and TMB-related prognostic model to predict LUAD patients’ prognosis. The results revealed that the immune-related prognostic model (IPM) based on TMB was capable of classifying LUAD patients in all cohorts into different risk groups. The IPM was useful and had a significant correlation with LUAD patients’ overall survival (OS). Based on the multivariate Cox analysis results, the IPM was proved to be an independent predictive biomarker. Furthermore, the five hub genes and the immune-related model were related to different immune infiltrating cells. The IPM was related to immune checkpoints. At last, an effective nomogram was established to predict LUAD patients’ prognosis. To conclude, our IPM is effective in predicting LUAD patients’ prognosis and provides novel insights into immunotherapy for LUAD.
Supplementary Information
The online version contains supplementary material available at 10.1007/s00262-021-03066-4.
Keywords: Tumor mutation burden, Lung adenocarcinoma, Prognosis, Immunology, Immune prognostic model
Introduction
Lung cancer, the most prevalent human cancer globally, has a high mortality rate. It can be classified as two main subtypes: non-small-cell lung carcinoma (NSCLC) accounts for about 85% and small-cell lung carcinoma (SCLC) accounts for about 15% [1]. LUAD belongs to NSCLC and accounts for approximately forty percent of all patients [2]. The investigation of LUAD has attracted considerable attention because the 5-year survival rate is still very low with the advancement and development in diagnosis and treatment, such as immunotherapy [3–5]. LUAD is caused by many factors, including cigarette smoking, air pollution, genetic alteration, etc. Besides, due to the strong invasiveness and rapid metastasis of LUAD, the survival rate of patients who were initially diagnosed with metastatic cancer in fifth year is merely 5% [6]. Thus, it is urgent to explore the accurate molecular mechanism and identify novel biomarkers to predict LUAD patients’ prognosis, contributing to more effective and precise treatment.
Tumor-infiltrating immune cells (TIICs) can be classified into two subtypes: the adaptive immune cells and the innate immune cells. TIICs, the essential components within the tumor microenvironment (TME), contribute to the development of various cancers [7]. For instance, tumor-infiltrating macrophages (TAMs) could affect the metabolism of cancer cells, thus mediating the antineoplastic effects in many cancers [8]. Moreover, tumor-infiltrating B cells (TIBs) can be used as a specific biomarker to stratify LUAD with different driver mutations, which reveals close relationships between the isotypes and patients’ prognosis [9]. Due to the detailed and comprehensive studies of the TME, immunotherapy has become an emerging cancer therapy and attracted special attention [10, 11]. Immune checkpoint blockade is an effective immunotherapy in NSCLC, which comprises the inhibition of cytotoxic T-lymphocyte antigen 4 (CTLA-4) and programmed cell death ligand 1/protein 1 (PD-L1/PD-1) [12]. According to recent research, high expression of PD-L1/PD-1 was related to better LUAD patients’ OS [13]. Moreover, FDA has approved a variety of immune checkpoint inhibitors (ICIs) as the second-line treatment for NSCLC, including atezolizumab targeting PD-L1 and nivolumab targeting PD-1 [14]. However, due to the different biological and molecular characteristics of diverse subtypes, ICIs can only benefit approximately twenty percent of patients with NSCLC. In contrast, a great number of patients address a limited response or even fail to respond at all [15]. Therefore, it is urgent to find more biomarkers of immunotherapy and explore the exact mechanism of the immune response in LUAD research.
Tumor mutation burden (TMB) could serve as a useful indicator to predict several ICIs treatment response across cancers, including NSCLC [16]. Some studies have revealed that TMB and the PD-L1 expression may cooperate to contribute to predicting responses of ICIs treatment in some cancers [17]. Moreover, another study showed that TMB is positively related to better prognosis among patients treated with ICIs across diverse types of cancers [18]. Although TMB may perform well to predict ICIs treatment response to certain types of cancer, several fundamental problems of the detailed mechanism remain unsolved. More comprehensive research is urgently required to better evaluate whether TMB is helpful to predict ICIs treatment response and patients’ prognosis. However, there is a lack of studies aimed at analyzing the correlation between TMB and immune infiltration of LUAD are lack. Thus, our research focused on further exploring the correlation between immune response and TMB in LUAD.
In our study, mRNA expression and somatic mutation data of LUAD were obtained via The Cancer Genome Atlas (TCGA) database. We then evaluated the correlation of immune landscape and TMB in LUAD and established an IPM for LUAD. Furthermore, data from the Gene Expression Omnibus (GEO) database was selected to evaluate IPM’s prognostic value. The correlation of the IPM and immune infiltration levels was also analyzed. This study contributes by developing a promising prognostic model and selecting hub genes as the potential biomarkers for LUAD, which has the potential clinical importance to benefit the patients suffered from LUAD.
Materials and methods
Gene expression data, somatic mutation data and clinical information
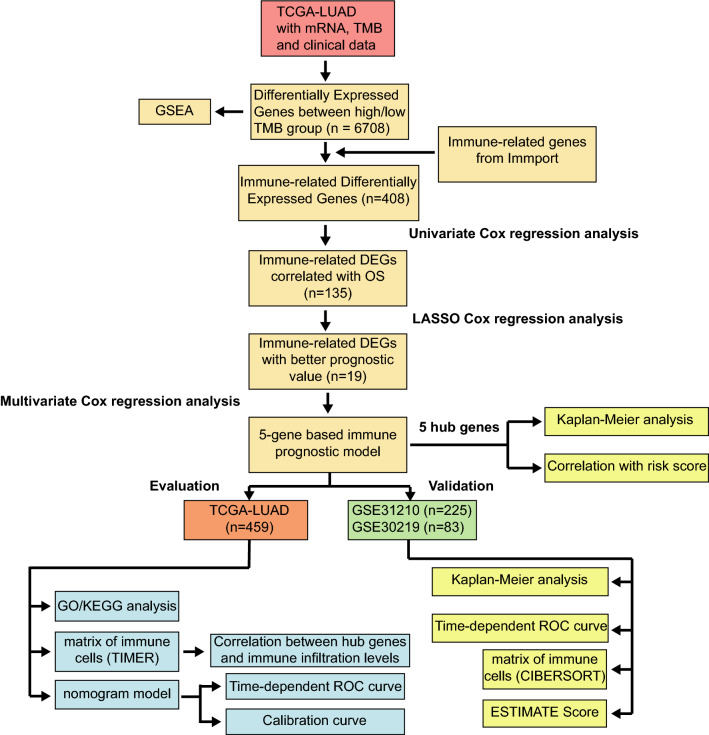
As for the training cohort, mRNA expression profiles, somatic mutation data and related clinical data of LUAD were accessed from the TCGA database via UCSC Xena (https://xena.ucsc.edu/). The somatic mutation data were analyzed via the “maftools” R package (version 2.2.10) [19]. The TMB scores were obtained by calculating the total number of mutations/exon length (38 Mb). The mRNA expression data and related clinical parameters used for validation cohorts were accessed from the GEO database (http://www.ncbi.nlm.nih.gov/geo/), including GSE30219 dataset [20] and GSE31210 [21]. Moreover, we performed log2 transformations for all mRNA expression data. When duplicate RNA expression values were found, we calculated and retained the average expression value. And samples whose survival time < 30 days were excluded in this study. Finally, 459 cases from the TCGA cohort, 83 cases from the GSE 30,219 cohort and 225 cases from the GSE31210 cohort were further analyzed. The flowchart of this research was revealed in Fig. 1. The LUAD patients’ clinical parameters from these three cohorts are shown in Table 1.
Fig. 1.
Flowchart of the study. TMB, tumor mutation burden; DEGs, differently expressed genes; ROC, receiver operating characteristic; LASSO, least absolute shrinkage and selection operator
Table 1.
Clinical characteristics of LUAD patients in training and validation cohorts
| Characteristics | TCGA-LUAD (Training set) | GSE30219 (Validation set 1) | GSE31210 (Validation set 2) | ||||
|---|---|---|---|---|---|---|---|
| Number of cases | Percent % | Number of cases | Percent % | Number of cases | Percent % | ||
| Total | 459 | 83 | 225 | ||||
| Age | > 60 | 314 | 68.4 | 46 | 55.4 | 118 | 52.4 |
| ≤ 60 | 145 | 31.6 | 37 | 44.6 | 107 | 47.6 | |
| Gender | Male | 214 | 46.6 | 65 | 78.3 | 104 | 46.2 |
| Female | 245 | 53.4 | 18 | 21.7 | 121 | 53.8 | |
| Pathological Stage | Stage I | 249 | 54.2 | 167 | 74.2 | ||
| Stage II | 111 | 24.2 | 58 | 25.8 | |||
| Stage III | 78 | 17 | 0 | 0 | |||
| Stage IV | 21 | 4.6 | 0 | 0 | |||
| Tstage | T1 | 158 | 34.4 | 69 | 83.1 | ||
| T2 | 243 | 52.9 | 12 | 14.5 | |||
| T3 | 41 | 9 | 2 | 2.4 | |||
| T4 | 17 | 3.7 | 0 | 0 | |||
| Nstage | N0 | 302 | 65.8 | 80 | 96.4 | ||
| N1 | 88 | 19.2 | 3 | 3.6 | |||
| N2 | 67 | 14.6 | 0 | 0 | |||
| N3 | 2 | 0.4 | 0 | 0 | |||
| Mstage | M0 | 83 | 100 | ||||
| M1 | 0 | 0 | |||||
| EGFR mutation | Mutation | 126 | 56 | ||||
| Wild-type | 99 | 44 | |||||
| KRAS mutation | Mutation | 20 | 8.9 | ||||
| Wild-type | 205 | 91.1 | |||||
Gene set enrichment analysis (GSEA)
In the TCGA cohort, GSEA was performed for the DEGs between high- and low TMB groups, which was utilized to determine the difference of immune-associated biological pathways between high- (n = 229) and low TMB groups (n = 230) via the “clusterProfiler” R package (version 3.14.3) [22]. FDR < 0.1 and p < 0.05 were set to determine which enrichment pathway is statistically significant.
Differentially expressed genes (DEGs) based on TMB
We regarded the median value of TMB to define the high- and low TMB groups. Patients with TMB higher than the median value were in the high TMB group, while the other in the low TMB group. We screened for TMB-related DEGs between high- and low TMB groups via “limma” R package (version 3.42.2) [23]. The cutoff value to identify DEGs were |fold change|> 1 and p < 0.05. And DEGs were intersected with the immune genes of the Immport database (https://immport.niaid.nih.gov/) for subsequent analysis.
Construction and validation of the immune-related prognostic model
We screened for immune-related DEGs with prognostic value using univariate Cox regression analysis via the “survival” R package (version: 3.2-7). The genes with p < 0.05 in the univariate Cox regression analysis were subjected to the least absolute shrinkage and selection operator (LASSO) Cox regression analysis via the “glmnet” R package (version 4.0-2) [24]. Next, multivariate Cox regression analysis was conducted within selected genes. Five key genes were finally identified to build the IPM. The prognostic model was established using five key genes and the coefficients of multivariate Cox regression: risk score = βgene1 * Exprgene1 + ⋯ + βgene5 * Exprgene5, where β refers to the coefficients and Expr refers to the expression value. The “survminer” R package (version 0.4.8) was utilized to identify the optimal cutoff value. Low- and high-risk groups were classified in the TCGA cohort based on the cutoff value. Using the “survminer” R package (version 0.4.8), we then evaluated this model’s prognostic value via the Kaplan–Meier analysis in all three cohorts. And, we analyzed the predictive ability of this IPM on the basis of the time-dependent receiver operating characteristic (ROC) curves in all cohorts via the “survivalROC” R package (version: 1.0.3).
Functional enrichment analysis
We identify DEGs by using “limma” R package in the TCGA cohort to analyze different biological processes (BPs) and pathways between different risk groups [23]. And we identified DEGs with |fold change|> 1 and p-value < 0.05. Subsequently, we carried out the Gene Ontology (GO) enrichment analyses based on the upregulated and downregulated genes, respectively, via the “clusterProfiler” R package [22].
Analysis of immune infiltrating cells and immune checkpoints
The TIMER database (https://cistrome.shinyapps.io/timer) is used to investigate immune cell infiltration [25]. We first evaluated the relationship between the immune infiltration and key genes’ expression levels, and OS, respectively [25]. CIBERSORT was then applied to further explore relative proportions of twenty-two infiltrating immune cells in the GSE31210 cohort [26]. In order to analyze the role our IPM played in immune infiltration, we also evaluated the fractions of twenty-two infiltrating immune cells, respectively, via CIBERSORT between different risk groups in the Sangerbox online tool (http://sangerbox.com/Index) [26]. ESTIMATE is an algorithm designed to estimate the immune score and be utilized to indicate the fractions of immune infiltrating cells [27]. We calculated the immune score, ESTIMATE score and stromal score in the validation cohort via the “estimate” R package (version 1.0.13). We then compared the differences of these scores between different risk groups. Besides, we evaluated various immune checkpoints expression between the different risk groups and calculated the correlation of expression levels and our IPM.
Nomogram development and evaluation to predict prognosis in LUAD
We utilized the univariate and multivariate Cox regression analysis together to explore whether our IPM was independent among other predictive characteristics, including gender, TMB, age, N stage, T stage and pathological stage. Next, a nomogram was construct to predict the survival probability at 1-, 3- and 5-year via “rms” R package (version 6.0-1). The accuracy was validated via the Calibration curves and time-dependent ROC curves. Besides, the concordance index was used to evaluate our nomogram’s discrimination.
Statistical analysis
All of the statistical analyses were conducted via the R software (version 3.6.2). The Spearman’s correlation was applied for the analysis of the correlation. The Wilcoxon test was utilized to compare the difference between these two risk groups. p < 0.05 was regarded as statistically significant.
Results
Somatic mutation profiles of LUAD
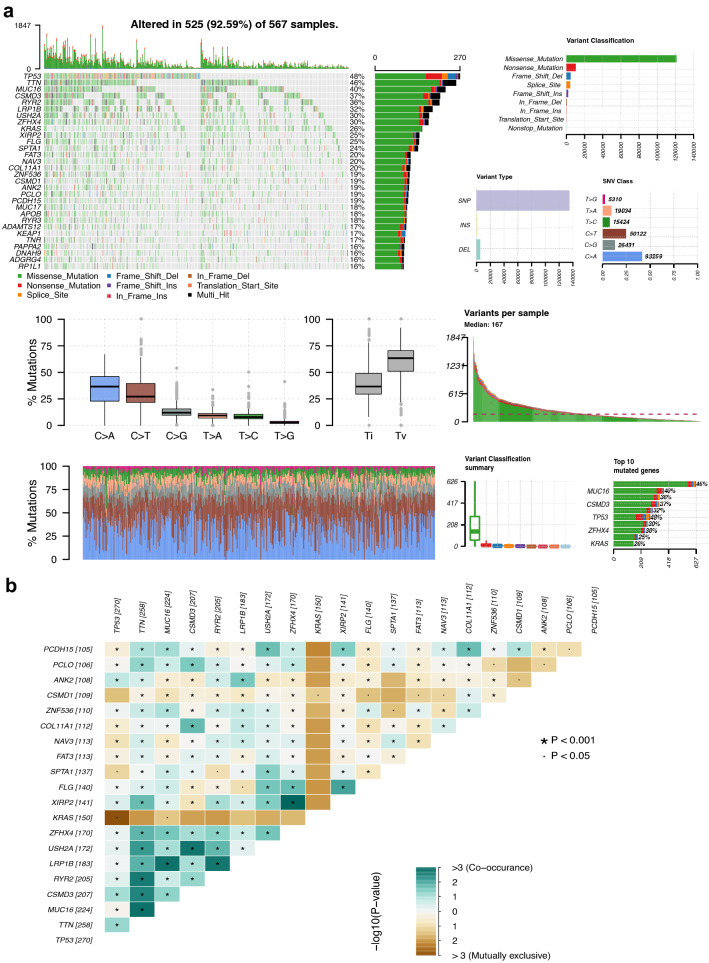
567 LUAD patients were subjected to the analysis of somatic mutation profiles via the “maftools” R package. TP53 (48%), TTN (46%) and MUC16 (40%) had the top three mutant frequency in LUAD samples in the waterfall plot. Moreover, the most frequent variant classification is the missense mutation, the most frequent single nucleotide variant (SNV) is C > A, and single nucleotide polymorphisms (SNPs) have a much higher proportion than deletion or insertion (Fig. 2a). The co-occurrence of the top 25 mutated genes is revealed in Fig. 2b. Subsequently, 459 of the 567 patients with the prognostic data were subjected to the following analysis.
Fig. 2.
Summary of LUAD somatic mutation. a Somatic mutation profiles in LUAD patients, including diverse mutation types for various genes, variant classifications, variant types and SNV classes. b The co-occurrence of the top 25 mutated genes. SNV, single nucleotide variant; SNP, single nucleotide polymorphism
Differentially expressed genes (DEGs) between low/high TMB groups
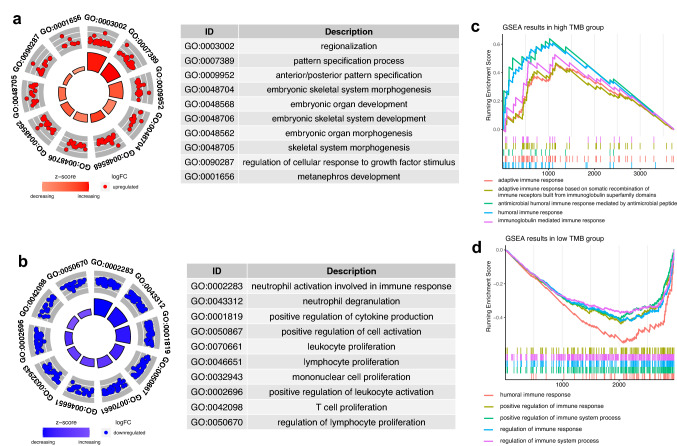
In total, 6708 genes were chosen as the DEGs between high- and low TMB groups, among which 3739 genes were highly expressed in high TMB group and 2969 genes were the opposite. Next, 408 immune DEGs were obtained via the intersection (Fig. 7c). And, GSEA for the DEGs was performed between these two groups, which revealed that 635 BPs were highly enriched in the high TMB group and 150 BPs were highly enriched in another group. Top 5 immune-related BPs were selected in the high TMB group (Fig. 4c) and another group (Fig. 4d), suggesting the immune response in the TME of LUAD.
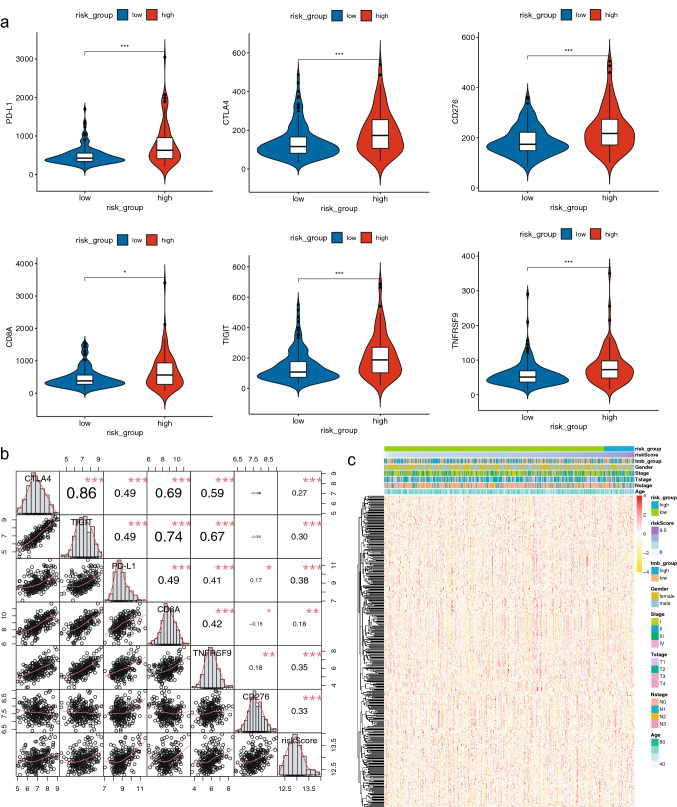
Fig. 7.
Correlation of the IPM with immune genes. a Comparison immunotherapy-related genes expression between different risk groups. b Correlation of the IPM with several important immune checkpoints. c Heatmap of the immune-related DEGs between high- and low TMB groups. ∗: p < 0.05, ∗∗ : p < 0.01 and ∗∗∗ : p < 0.001
Fig. 4.
GO and GSEA of the IPM. a–b GO analysis of highly expressed genes in different risk groups. c–d GSEA of highly expressed genes in the high- and low TMB group
Development and evaluation of the IPM based on the training cohort
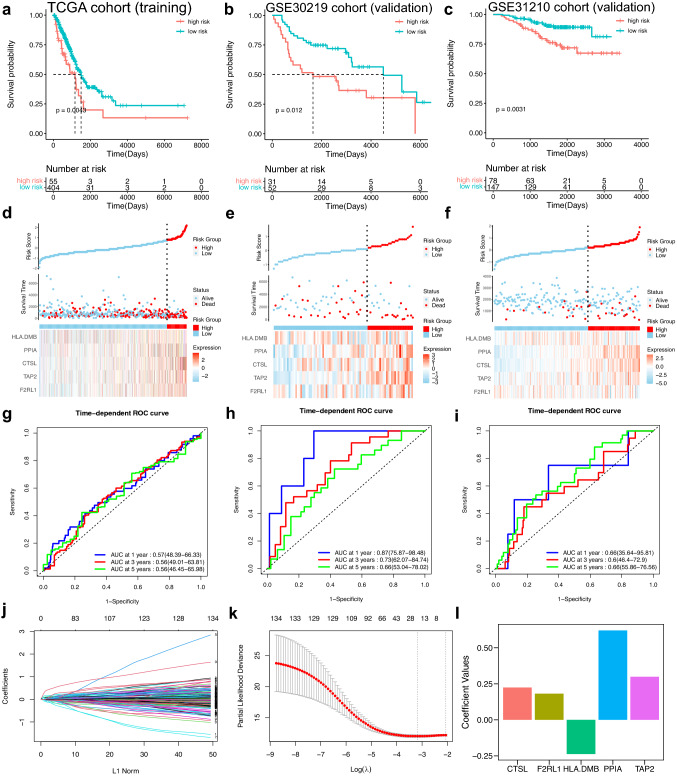
The prognostic value of 408 immune-related DEGs was explored via univariate Cox regression analysis in the LUAD patients. The results revealed that 135 immune genes were suitable (p < 0.05) (Supplementary file 3: supplementary Table 1). Next, LASSO Cox regression analysis was applied to select 19 immune genes (Fig. 3j–k). Finally, multivariate Cox regression analysis was applied and five immune genes were chosen (Table 2). The expression levels of F2RL1, CTSL, PPIA, TAP2 were negatively associated with LUAD patients’ OS and HLA-DMB expression was positively associated with LUAD patients’ OS. The Kaplan–Meier analysis of these five immune-related genes indicated the same results (Supplementary file 2: supplementary Fig. 1a). And, the Gene Expression Profiling Interactive Analysis (GEPIA) database was further applied to evaluate these five genes (Supplementary file 2: supplementary Fig. 1b). According to the result of the multivariate Cox regression analysis, the prognostic model for the LUAD patients was built as follows: risk score = 0.1815815 * ExprF2RL1 + 0.2241316 * ExprCTSL + 0.6202300 * ExprPPIA + 0.2990650 * ExprTAP2 − 0.2372524 * ExprHLA-DMB (Fig. 3l). Subsequently, LUAD patients in the TCGA cohort were divided into different risk groups (Fig. 3d). The Kaplan–Meier analysis was performed, which revealed that patients with high-risk scores had a unfavorable prognosis (Fig. 3a). Furthermore, according to time-dependent ROC curves, AUCs at different years were 0.57 (1-year), 0.56 (3-year) and 0.56 (5-year), respectively (Fig. 3g).
Fig. 3.
Establishment and validation of the IPM. a–c The Kaplan–Meier analysis of the IPM in TCGA cohort, GSE30219 cohort and GSE31210 cohort. d–f The distribution of different risk groups and the heatmap of hub genes in TCGA cohort, GSE30219 cohort and GSE31210 cohort. g–i Time-dependent ROC curves of the IPM in TCGA cohort, GSE30219 cohort and GSE31210 cohort. j–k The process of LASSO Cox analysis. (L) Coefficient values for hub genes
Table 2.
Multivariate Cox regression analysis of the immune-related genes in TCGA
| Genes | Coefficient | HR | 95%CI | p-value |
|---|---|---|---|---|
| F2RL1 | 0.18158149 | 1.2 | 1.06–1.36 | 0.005 |
| TAP2 | 0.29906504 | 1.35 | 1.09–1.67 | 0.006 |
| CTSL | 0.2241316 | 1.25 | 1.07–1.47 | 0.005 |
| PPIA | 0.62023003 | 1.86 | 1.35–2.56 | 0 |
| HLA.DMB | − 0.2372524 | 0.79 | 0.68–0.91 | 0.001 |
Validation and evaluation of the IPM based on GEO validation cohorts
The GEO validation cohorts (GSE30219 and GSE31210) were utilized for subsequent validation to figure out whether the IPM was a robust predictive model. LUAD patients’ risk scores were obtained via the equation and patients were stratified into different risk groups based on the optimal cutoff value (Fig. 3e, f). The Kaplan–Meier analysis was applied in these two validation cohorts, which indicated that the prognosis of patients with high-risk scores was unfavorable (Fig. 3b, c). Besides, AUCs of the time-dependent ROC curves reached 0.87, 0.73 and 0.66 at 1, 3, 5 years, respectively, in GSE30219 (Fig. 3h), and reached 0.66, 0.6, 0.66 at 1, 3, 5 years, respectively, in GSE31210 (Fig. 3i).
Analysis of BPs related to the IPM
We have found that 359 genes were highly expressed in the high-risk group and 341 genes were highly expressed in the low-risk group (|fold change|> 1, p-value < 0.05). Next, we performed GO analysis to analyze the underlying BPs of the DEGs in the different risk groups. The results showed that 28 BPs (Fig. 4a) were enriched in the high-risk group and 478 BPs (Fig. 4b) and were enriched in the other group.
Correlation between immune infiltration and selected key genes
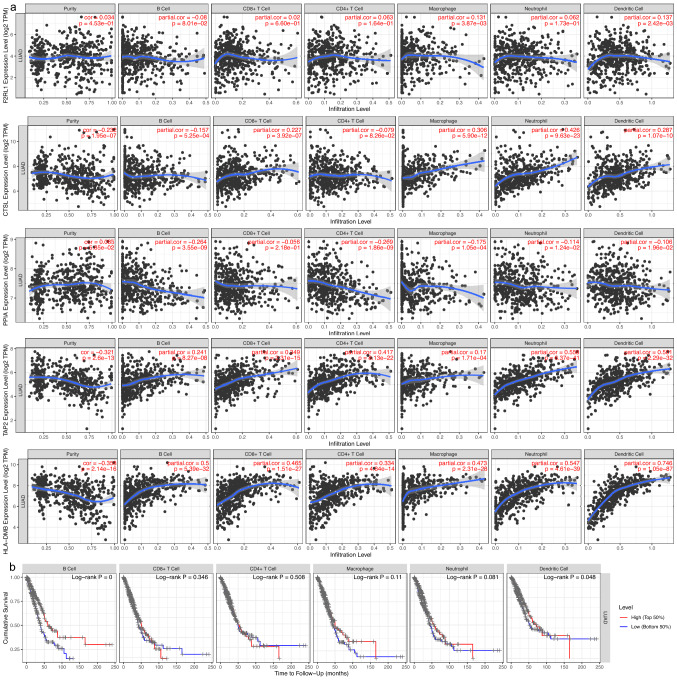
The correlation analysis showed that expression levels of five key genes (F2RL1, CTSL, PPIA, TAP2 and HLA-DMB) of the IPM were notably related to immune infiltrating levels from the TIMER database. F2RL1, CTSL, TAP2 and HLA-DMB expression were positively related to immune infiltrating levels, while PPIA expression was negatively related to immune infiltrating levels (Fig. 5a). Moreover, the Kaplan–Meier analysis showed that the infiltrating levels of dendritic cells and B cells were positively related to patients’ OS in the training cohort (Fig. 5b).
Fig. 5.
Immune infiltrating cells were correlated with hub genes expression and prognosis in LUAD. a F2RL1, CTSL, TAP2 and HLA-DMB expression were positively related to the immune infiltration, while PPIA expression was the opposite. b The Kaplan–Meier analysis revealed that B cells and dendritic cells were positively related to LUAD patients’ OS (p < 0.05)
The immune landscape of LUAD patients in different risk groups
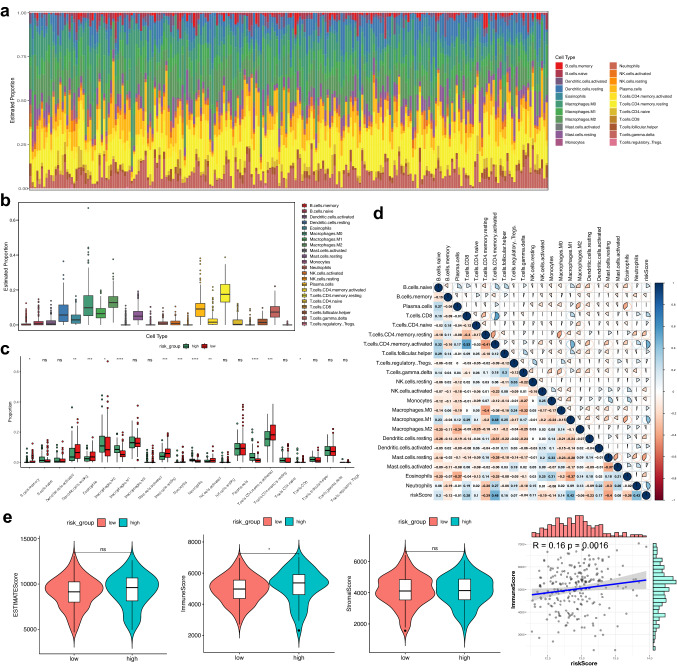
The immune infiltrating levels of twenty-two immune cells vary between different risk groups in the GS31210 cohort (Fig. 6a). The results indicated that infiltrating immune cells’ differences may function as an intrinsic characteristic to represent individual diversity (Fig. 6b). Next, proportions of the immune cells were compared in the two risk groups (Fig. 6c). Moreover, we found that the various infiltrating immune cell proportions correlated weakly to moderately and the risk score was closely related to immune infiltration (Fig. 6d). We further calculated the ESTIMATE score of the LUAD patients in the GSE31210 cohort and the results illustrated that immune score of the low-risk group were significantly lower, and the immune score was correlated with the risk score (Fig. 6e). The above results indicated that the immune infiltrating levels of LUAD might act as effective immune biomarkers for the treatment and have clinical significance.
Fig. 6.
Analysis of immune infiltrating cell fractions and immune-related scores between different risk groups. a The proportions of twenty-two immune infiltrating cells. b Boxplots reveal the fractions of the twenty-two immune infiltrating cells. c Boxplots reveal the diverse fractions of immune infiltrating cells between the different risk groups. d Correlation matrix of the immune infiltrating cells and the risk score. e The difference of immune score, ESTIMATE score, stromal score, and tumor purity between different risk groups. Ns: p ≥ 0.05, ∗: p < 0.05, ∗∗ : p < 0.01, ∗∗∗ : p < 0.001
Immune checkpoints serve as promising biomarkers in cancer immunotherapy. We focused on the correlation of our IPM and expression levels of some important immunotherapy-related genes (PD-L1, CTLA-4, CD276, CD8A, TIGIT and TNFRSF9) in the GSE31210 cohort. The expression levels of all these immunotherapy-related genes were significantly higher in patients with high-risk scores (Fig. 7a). Results of the correlation analysis revealed that the IPM was positively correlated with all these immunotherapy-related genes (Fig. 7b). Therefore, the immune-related model is potentially associated with the immunotherapy-related gene expression in LUAD.
Construction and evaluation of a nomogram on the basis of the IPM
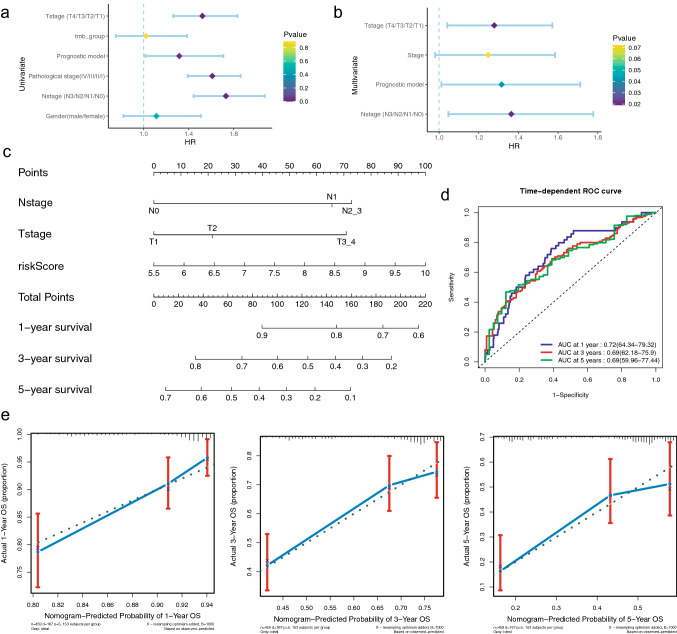
To determine whether our immune-related model and other clinical parameters were independent to predict prognosis, univariate and multivariate Cox analyses were utilized in the TCGA cohort (Fig. 8a, b). Results showed that the Nstage, Tstage and IPM were highly correlated with LUAD patients’ OS (Table 3). Next, a nomogram was constructed on the basis of our IPM and the pathological stage in the TCGA training cohort (Fig. 8c). In addition, calibration plots indicated that the perfect concordance between the nomogram and the actual overall survival probabilities, suggesting that our nomogram has the stable capacity to predict LUAD patients’ prognosis (Fig. 8e). Moreover, results of time-dependent ROC curves revealed that AUCs at different years were 0.72 (1-year), 0.69 (3-year), 0.69 (5-year), respectively, indicating the nomogram’s excellent sensitivity and specificity (Fig. 8d). All the results revealed that this nomogram was suitable to predict LUAD patients’ prognosis.
Fig. 8.
Development and evaluation of the nomogram in the training cohort. a Univariate Cox analyses of correlation between clinical parameters and OS. b Multivariate Cox analyses of correlation between clinical parameters and OS. c The nomogram to predict 1-, 3- and 5-year LUAD patients’ OS. d Time-dependent ROC curves utilized to evaluate the nomogram. e Calibration curves utilized to evaluate the performance of the nomogram
Table 3.
Univariate and multivariate Cox regression analysis of the clinical factors in TCGA
| Characteristics | Univariate analysis | Multivariate analysis | ||
|---|---|---|---|---|
| HR (95%CI) | p-value | HR (95%CI) | p-value | |
| Nstage | 1.731 (1.443–2.076) | 0 | 1.364 (1.047–1.778) | 0.021 |
| Tstage | 1.522 (1.264–1.833) | 0 | 1.278 (1.041–1.571) | 0.019 |
| Stage | 1.610 (1.392–1.862) | 0 | 1.247 (0.98–1.585) | 0.072 |
| Gender | 1.113 (0.821–1.508) | 0.492 | ||
| TMB | 1.022 (0.753–1.386) | 0.89 | ||
| Risk Score | 1.317 (1.015–1.709) | 0.038 | 1.315 (1.011–1.712) | 0.042 |
Discussion
As mentioned in recent studies, genomic variations are among the predominant causes of LUAD [5]. Although advanced methods have been utilized, it is still challenging to treat LUAD patients accurately due to the considerable heterogeneity of molecular, pathological and clinical aspects. Lately, immunotherapy has become a novel method to treat patients with various aggressive cancers, including LUAD [28]. Besides, many publications have revealed that TME plays an indispensable role in LUAD, which may also contribute to the research of immunotherapy [29]. Although immunotherapy can benefit a few LUAD patients, it lacks the necessary molecular targets to determine the efficacy of immunotherapy. Therefore, it is incredibly vital to find more reliable molecular targets related to immunotherapy, which can identify patients who are sensitive to immunotherapy in the early period of the treatment.
Recent publications have shown that TMB could determine immunotherapeutic responses of various cancers, including LUAD [16]. Xiang et al. have found that TMB and copy number alteration can work together to accurately predict the response of immune checkpoint inhibitors in KRAS-mutant LUAD, indicating that high copy number alteration and low TMB can be useful indicators of adverse prognosis [30]. However, there is not enough research to evaluate the correlation of TMB and immune infiltration in LUAD. Previous studies found that TMB may correlate with NSCLC patients’ OS, which the prognosis was improved explicitly in patients with high TMB when they received anti-PD-L1 treatment [31]. Moreover, other research has shown that TMB can be a predictor of immunotherapy and benefit patients with high TMB, suggesting that TMB is closely related to cancer immunity [17]. Additionally, GSEA results showed that both low- and high TMB groups enriched some immune-related biological processes, indicating the difference of TMB may be related to different immune responses in LUAD. We hypothesized that the combination of TMB and immunity might be novel prognostic indicator in LUAD.
The prognostic model built in this study contained five immune-related genes. F2RL1, also known as protease-activated receptor 2 (PAR2), serves as an important factor in inflammatory and tumorigenesis, especially in colorectal cancer [32]. Precisely, F2RL1 can reconstruct TME to promote tumor progression via inhibiting tumor-promoting myeloid cells in colorectal cancer [32]. Cathepsin L (CTSL) is a lysosomal cysteine proteinase that plays a vital role in multiple types of pathological processes, which is highly expressed in various cancers, including ovarian cancer [33] and acute myeloid leukemia [34]. Studies have indicated that CTSL can be a therapeutic target in various cancers and associated treatment aimed to obstruct bone resorption and metastatic process [35]. Peptidylprolyl isomerase A (PPIA) is one of cyclophilins and functions in various pathological processes, such as cell signaling and protein folding [36]. Yang et al. have reported that PPIA was highly expressed and could activate ERK1/2 signal in SCLC, which may be a the potential prognostic biomarker in LUAD [37]. Peptide transporter involved in antigen processing 2 (TAP2) usually works with other antigens in the progression of many diseases, such as human leukocyte antigen (HLA). Previous studies have found that TAP2 was downregulated in the HLA-I negative prostate cancer, which induced the immune escape and correlated with poor prognosis [38]. HLA-DMB, the β chain of the major histocompatibility complex (MHC) class II protein, has been proved to be expressed in antigen-presenting cells. Michael et al. reported that HLA-DMB was highly expressed with abundant tumor-penetrating CD8 T lymphocytes in advanced serous ovarian cancer, which was proved to lengthen patients’ OS [39]. To defend against the infection of human T-cell leukemia virus type-1 (HTLV-1), HLA-DMB could regulate autophagosome accumulation to modulate HTLV-1 expression [40]. However, the accurate role that these genes play in LUAD are still uncertain and need to be explored.
To evaluate the relationship between prognosis and immune infiltration, we used the CIBERSORT to analyze immune cell proportions and calculated immune-related scores in different risk groups. Previous studies showed that B cell infiltration was positively related to LUAD patients’ OS [41]. The results showed that the abundance of resting memory CD4 T cells, activated NK cells, monocytes, resting mast cells, eosinophils, memory B cells and resting dendritic cells were prominently higher in patients low-risk scores, indicating multiple types of immune infiltrating cells might be predictive biomarkers in LUAD. Choi et al. showed that the high immune-related score was related to the favorable OS of LUAD patients [42]. Our results revealed that immune score were positively associated with the IPM. One immune-related pathways were contained by the top 5 pathways enriched in the high-risk group, whereas no immune-related pathway in another group. Many immune checkpoint inhibitors have been evaluated and proved to be effective in treating cancer [43]. Our study integrated analyzed their associations with the immune-related model. The results revealed that some immune checkpoint (like PD-L1) expression was different between high- and low-risk groups. Therefore, our IPM was closely related to the immune checkpoint expression and may be highly correlated with the immune checkpoint inhibitor treatment in LUAD patients. Furthermore, the above results indicated that our IPM performed well to predict the OS and immune infiltration in LUAD.
No research has focused on the association between immune infiltration and TMB and built a TMB-related IPM in LUAD. Therefore, our IPM contributes to the research of immune infiltration in TME and the immunotherapy for LUAD. Some limitations did exist in this research. First of all, this study was a retrospective study and our results were supposed to be validated by some prospective studies with detailed clinical information in future. Second, more comprehensive biological investigations of the hub genes are warranted because our IPM was established according to five immune genes. Third, the IPM was constructed according to above genes’ expression values so that the intra-tumor heterogeneity may cause sampling bias.
Conclusion
Overall, we were the first to construct an immune- and TMB-related prognostic model with five key genes, which can be an distinct prognostic biomarker and classify LUAD patients into different risk groups. Besides, the IPM also revealed immune infiltration levels in LUAD patients. Our findings may provide novel insights into precisely predicting LUAD patients’ prognosis and contribute to the understanding of personalized immunotherapy regimens in LUAD.
Supplementary Information
Below is the link to the electronic supplementary material.
Abbreviations
- CGP
Cancer gene panel
- CTLA-4
Cytotoxic T-lymphocyte antigen 4
- CTSL
Cathepsin L
- GEO
Gene expression omnibus
- HTLV-1
Human T-cell leukemia virus type-1
- ICIs
Immune checkpoint inhibitors
- IPM
Immune-related prognostic model
- LASSO
Least absolute shrinkage and selection operator
- LUAD
Lung adenocarcinoma
- NSCLC
Non-small-cell lung carcinoma
- OS
Overall survival
- PAR2
Protease-activated receptor 2
- PD-L1/PD-1
Programmed cell death ligand 1/protein 1
- PPIA
Peptidyl prolyl isomerase A
- SCLC
Small-cell lung carcinoma
- TAMs
Tumor-infiltrating macrophages
- TAP2
Peptide transporter involved in antigen processing 2
- TCGA
The cancer genome atlas
- TIBs
Tumor-infiltrating B cells
- TIICs
Tumor-infiltrating immune cells
- TMB
Tumor mutation burden
- TME
Tumor microenvironment
- Tregs
T cells regulatory
- WES
Whole-exome sequencing
Authors' contributions
BZ and SG designed and supervised the study. BZ analyzed the data and wrote the original draft. SG edited the draft. All authors have read and approved the final manuscript.
Funding
The study was funded by Institutional Fundamental Research Funds (2018PT32033), the Ministry of Education Innovation Team Development Project (IRT-17R10) and ETHICON·Excellent in surgery grant (2018-011-ZZ).
Availability of data and material
All datasets presented in this study are included in the article/supplementary material. GEO data was downloaded from the GEO database (https://www.ncbi.nlm.nih.gov/gds/) under the accession number(s) GSE30219, GSE31210. TCGA RNA-seq data was downloaded from the TCGA database (https://gdc.cancer.gov/) under the accession number(s) LUAD-FPKM.
Declarations
Ethical approval
Since this was a retrospective study and all the data were collected from a public database TCGA and GEO, therefore, ethical approval was not required.
Informed consent
All the analyzed data used in our research were collected from a public database, such as TCGA and GEO; therefore, informed consent was not required for this analysis.
Footnotes
Publisher's Note
Springer Nature remains neutral with regard to jurisdictional claims in published maps and institutional affiliations.
References
- 1.Siegel RL, Miller KD, Jemal A. Cancer statistics, 2020. CA Cancer J Clin. 2020;70:7–30. doi: 10.3322/caac.21590. [DOI] [PubMed] [Google Scholar]
- 2.Coudray N, Ocampo PS, Sakellaropoulos T, Narula N, Snuderl M, Fenyö D, Moreira AL, Razavian N, Tsirigos A. Classification and mutation prediction from non-small cell lung cancer histopathology images using deep learning. Nat Med. 2018;24:1559–1567. doi: 10.1038/s41591-018-0177-5. [DOI] [PMC free article] [PubMed] [Google Scholar]
- 3.Ettinger DS, Wood DE, Aggarwal C, et al. NCCN guidelines insights: non-small cell lung cancer, version 1.2020. J Natl Compr Cancer Netw. 2019;17:1464–1472. doi: 10.6004/jnccn.2019.0059. [DOI] [PubMed] [Google Scholar]
- 4.Li F, Huang Q, Luster TA, et al. In Vivo Epigenetic CRISPR screen identifies Asf1a as an immunotherapeutic target in Kras-Mutant lung adenocarcinoma. Cancer Discov. 2020;10:270–287. doi: 10.1158/2159-8290.Cd-19-0780. [DOI] [PMC free article] [PubMed] [Google Scholar]
- 5.Xu JY, Zhang C, Wang X, et al. Integrative proteomic characterization of human lung adenocarcinoma. Cell. 2020;182:245–61.e17. doi: 10.1016/j.cell.2020.05.043. [DOI] [PubMed] [Google Scholar]
- 6.Doll KM, Rademaker A, Sosa JA. Practical guide to surgical data sets: surveillance, epidemiology, and end results (SEER) database. JAMA Surg. 2018;153:588–589. doi: 10.1001/jamasurg.2018.0501. [DOI] [PubMed] [Google Scholar]
- 7.Hinshaw DC, Shevde LA. The tumor microenvironment innately modulates cancer progression. Cancer Res. 2019;79:4557–4566. doi: 10.1158/0008-5472.Can-18-3962. [DOI] [PMC free article] [PubMed] [Google Scholar]
- 8.Vitale I, Manic G, Coussens LM, Kroemer G, Galluzzi L. Macrophages and metabolism in the tumor microenvironment. Cell Metab. 2019;30:36–50. doi: 10.1016/j.cmet.2019.06.001. [DOI] [PubMed] [Google Scholar]
- 9.Isaeva OI, Sharonov GV, Serebrovskaya EO, Turchaninova MA, Zaretsky AR, Shugay M, Chudakov DM. Intratumoral immunoglobulin isotypes predict survival in lung adenocarcinoma subtypes. J Immunother Cancer. 2019;7:279. doi: 10.1186/s40425-019-0747-1. [DOI] [PMC free article] [PubMed] [Google Scholar]
- 10.Riley RS, June CH, Langer R, Mitchell MJ. Delivery technologies for cancer immunotherapy. Nat Rev Drug Discov. 2019;18:175–196. doi: 10.1038/s41573-018-0006-z. [DOI] [PMC free article] [PubMed] [Google Scholar]
- 11.Kennedy LB, Salama AKS. A review of cancer immunotherapy toxicity. CA Cancer J Clin. 2020;70:86–104. doi: 10.3322/caac.21596. [DOI] [PubMed] [Google Scholar]
- 12.Téglási V, Reiniger L, Fábián K, et al. Evaluating the significance of density, localization, and PD-1/PD-L1 immunopositivity of mononuclear cells in the clinical course of lung adenocarcinoma patients with brain metastasis. Neuro Oncol. 2017;19:1058–1067. doi: 10.1093/neuonc/now309. [DOI] [PMC free article] [PubMed] [Google Scholar]
- 13.Ma K, Qiao Y, Wang H, Wang S. Comparative expression analysis of PD-1, PD-L1, and CD8A in lung adenocarcinoma. Ann Transl Med. 2020;8:1478. doi: 10.21037/atm-20-6486. [DOI] [PMC free article] [PubMed] [Google Scholar]
- 14.Malhotra J, Jabbour SK, Aisner J. Current state of immunotherapy for non-small cell lung cancer. Transl Lung Cancer Res. 2017;6:196–211. doi: 10.21037/tlcr.2017.03.01. [DOI] [PMC free article] [PubMed] [Google Scholar]
- 15.Schoenfeld AJ, Hellmann MD. Acquired resistance to immune checkpoint inhibitors. Cancer Cell. 2020;37:443–455. doi: 10.1016/j.ccell.2020.03.017. [DOI] [PMC free article] [PubMed] [Google Scholar]
- 16.Wang Z, Duan J, Cai S, et al. Assessment of blood tumor mutational burden as a potential biomarker for immunotherapy in patients with non-small cell lung cancer with use of a next-generation sequencing cancer gene panel. JAMA Oncol. 2019;5:696–702. doi: 10.1001/jamaoncol.2018.7098. [DOI] [PMC free article] [PubMed] [Google Scholar]
- 17.Chan TA, Yarchoan M, Jaffee E, Swanton C, Quezada SA, Stenzinger A, Peters S. Development of tumor mutation burden as an immunotherapy biomarker: utility for the oncology clinic. Ann Oncol. 2019;30:44–56. doi: 10.1093/annonc/mdy495. [DOI] [PMC free article] [PubMed] [Google Scholar]
- 18.Samstein RM, Lee CH, Shoushtari AN, et al. Tumor mutational load predicts survival after immunotherapy across multiple cancer types. Nat Genet. 2019;51:202–206. doi: 10.1038/s41588-018-0312-8. [DOI] [PMC free article] [PubMed] [Google Scholar]
- 19.Mayakonda A, Lin DC, Assenov Y, Plass C, Koeffler HP. Maftools: efficient and comprehensive analysis of somatic variants in cancer. Genome Res. 2018;28:1747–1756. doi: 10.1101/gr.239244.118. [DOI] [PMC free article] [PubMed] [Google Scholar]
- 20.Rousseaux S, Debernardi A, Jacquiau B, et al. Ectopic activation of germline and placental genes identifies aggressive metastasis-prone lung cancers. Sci Transl Med. 2013;5:186ra66. doi: 10.1126/scitranslmed.3005723. [DOI] [PMC free article] [PubMed] [Google Scholar]
- 21.Okayama H, Kohno T, Ishii Y, et al. Identification of genes upregulated in ALK-positive and EGFR/KRAS/ALK-negative lung adenocarcinomas. Cancer Res. 2012;72:100–111. doi: 10.1158/0008-5472.Can-11-1403. [DOI] [PubMed] [Google Scholar]
- 22.Yu G, Wang LG, Han Y, He QY. clusterProfiler: an R package for comparing biological themes among gene clusters. OMICS. 2012;16:284–287. doi: 10.1089/omi.2011.0118. [DOI] [PMC free article] [PubMed] [Google Scholar]
- 23.Ritchie ME, Phipson B, Wu D, Hu Y, Law CW, Shi W, Smyth GK. limma powers differential expression analyses for RNA-sequencing and microarray studies. Nucleic Acids Res. 2015;43:e47. doi: 10.1093/nar/gkv007. [DOI] [PMC free article] [PubMed] [Google Scholar]
- 24.Simon N, Friedman J, Hastie T, Tibshirani R. Regularization paths for Cox's proportional hazards model via coordinate descent. J Stat Softw. 2011;39:1–13. doi: 10.18637/jss.v039.i05. [DOI] [PMC free article] [PubMed] [Google Scholar]
- 25.Li T, Fan J, Wang B, Traugh N, Chen Q, Liu JS, Li B, Liu XS. TIMER: a web server for comprehensive analysis of tumor-infiltrating immune cells. Cancer Res. 2017;77:e108–e110. doi: 10.1158/0008-5472.Can-17-0307. [DOI] [PMC free article] [PubMed] [Google Scholar]
- 26.Chen B, Khodadoust MS, Liu CL, Newman AM, Alizadeh AA. Profiling tumor infiltrating immune cells with CIBERSORT. Methods Mol Biol. 2018;1711:243–259. doi: 10.1007/978-1-4939-7493-1_12. [DOI] [PMC free article] [PubMed] [Google Scholar]
- 27.Yoshihara K, Shahmoradgoli M, Martínez E, et al. Inferring tumour purity and stromal and immune cell admixture from expression data. Nat Commun. 2013;4:2612. doi: 10.1038/ncomms3612. [DOI] [PMC free article] [PubMed] [Google Scholar]
- 28.Santarpia M, Aguilar A, Chaib I, et al. Non-small-cell lung cancer signaling pathways, metabolism, and PD-1/PD-L1 antibodies. Cancers (Basel) 2020 doi: 10.3390/cancers12061475. [DOI] [PMC free article] [PubMed] [Google Scholar]
- 29.Tan Q, Huang Y, Deng K, et al. Identification immunophenotyping of lung adenocarcinomas based on the tumor microenvironment. J Cell Biochem. 2020;121:4569–4579. doi: 10.1002/jcb.29675. [DOI] [PubMed] [Google Scholar]
- 30.Xiang L, Fu X, Wang X, Li W, Zheng X, Nan K, Tian T. A Potential biomarker of combination of tumor mutation burden and copy number alteration for efficacy of immunotherapy in KRAS-mutant advanced lung adenocarcinoma. Front Oncol. 2020;10:559896. doi: 10.3389/fonc.2020.559896. [DOI] [PMC free article] [PubMed] [Google Scholar]
- 31.Gandara DR, Paul SM, Kowanetz M, et al. Blood-based tumor mutational burden as a predictor of clinical benefit in non-small-cell lung cancer patients treated with atezolizumab. Nat Med. 2018;24:1441–1448. doi: 10.1038/s41591-018-0134-3. [DOI] [PubMed] [Google Scholar]
- 32.Ke Z, Wang C, Wu T, Wang W, Yang Y, Dai Y. PAR2 deficiency enhances myeloid cell-mediated immunosuppression and promotes colitis-associated tumorigenesis. Cancer Lett. 2020;469:437–446. doi: 10.1016/j.canlet.2019.11.015. [DOI] [PubMed] [Google Scholar]
- 33.Zhang W, Wang S, Wang Q, Yang Z, Pan Z, Li L. Overexpression of cysteine cathepsin L is a marker of invasion and metastasis in ovarian cancer. Oncol Rep. 2014;31:1334–1342. doi: 10.3892/or.2014.2967. [DOI] [PubMed] [Google Scholar]
- 34.Pandey G, Bakhshi S, Thakur B, Jain P, Chauhan SS. Prognostic significance of cathepsin L expression in pediatric acute myeloid leukemia. Leuk Lymphoma. 2018;59:2175–2187. doi: 10.1080/10428194.2017.1422865. [DOI] [PubMed] [Google Scholar]
- 35.Sudhan DR, Siemann DW. Cathepsin L targeting in cancer treatment. Pharmacol Ther. 2015;155:105–116. doi: 10.1016/j.pharmthera.2015.08.007. [DOI] [PMC free article] [PubMed] [Google Scholar]
- 36.Nigro P, Pompilio G, Capogrossi MC. Cyclophilin A: a key player for human disease. Cell Death Dis. 2013;4:e888. doi: 10.1038/cddis.2013.410. [DOI] [PMC free article] [PubMed] [Google Scholar]
- 37.Yang H, Chen J, Yang J, Qiao S, Zhao S, Yu L. Cyclophilin A is upregulated in small cell lung cancer and activates ERK1/2 signal. Biochem Biophys Res Commun. 2007;361:763–767. doi: 10.1016/j.bbrc.2007.07.085. [DOI] [PubMed] [Google Scholar]
- 38.Carretero FJ, Del Campo AB, Flores-Martín JF, et al. Frequent HLA class I alterations in human prostate cancer: molecular mechanisms and clinical relevance. Cancer Immunol Immunother. 2016;65:47–59. doi: 10.1007/s00262-015-1774-5. [DOI] [PMC free article] [PubMed] [Google Scholar]
- 39.Callahan MJ, Nagymanyoki Z, Bonome T, et al. Increased HLA-DMB expression in the tumor epithelium is associated with increased CTL infiltration and improved prognosis in advanced-stage serous ovarian cancer. Clin Cancer Res. 2008;14:7667–7673. doi: 10.1158/1078-0432.Ccr-08-0479. [DOI] [PMC free article] [PubMed] [Google Scholar]
- 40.Wang J, Song D, Liu Y, et al. HLA-DMB restricts human T-cell leukemia virus type-1 (HTLV-1) protein expression via regulation of ATG7 acetylation. Sci Rep. 2017;7:14416. doi: 10.1038/s41598-017-14882-z. [DOI] [PMC free article] [PubMed] [Google Scholar]
- 41.Iglesia MD, Parker JS, Hoadley KA, Serody JS, Perou CM, Vincent BG. Genomic analysis of immune cell infiltrates across 11 tumor types. J Natl Cancer Inst. 2016 doi: 10.1093/jnci/djw144. [DOI] [PMC free article] [PubMed] [Google Scholar]
- 42.Choi H, Na KJ. Integrative analysis of imaging and transcriptomic data of the immune landscape associated with tumor metabolism in lung adenocarcinoma: clinical and prognostic implications. Theranostics. 2018;8:1956–1965. doi: 10.7150/thno.23767. [DOI] [PMC free article] [PubMed] [Google Scholar]
- 43.Nishino M, Ramaiya NH, Hatabu H, Hodi FS. Monitoring immune-checkpoint blockade: response evaluation and biomarker development. Nat Rev Clin Oncol. 2017;14:655–668. doi: 10.1038/nrclinonc.2017.88. [DOI] [PMC free article] [PubMed] [Google Scholar]
Associated Data
This section collects any data citations, data availability statements, or supplementary materials included in this article.
Supplementary Materials
Data Availability Statement
All datasets presented in this study are included in the article/supplementary material. GEO data was downloaded from the GEO database (https://www.ncbi.nlm.nih.gov/gds/) under the accession number(s) GSE30219, GSE31210. TCGA RNA-seq data was downloaded from the TCGA database (https://gdc.cancer.gov/) under the accession number(s) LUAD-FPKM.


