

Abstract
Introduction
Immune checkpoint inhibitors (ICIs) have significantly improved the prognosis of non-small cell lung cancer (NSCLC). However, only a limited proportion of patients can benefit from this therapy, and clinically useful predictive biomarkers remain to be elucidated.
Methods
Blood was collected from 189 patients with NSCLC before and six weeks after the initiation of ICI treatment (anti-PD-1 or anti-PD-L1 antibody). Soluble PD-1 (sPD-1) and PD-L1 (sPD-L1) in plasma before and after treatment were analyzed to evaluate their clinical significance.
Results
Cox regression analysis demonstrated that higher sPD-L1 levels before treatment significantly predicted unfavorable progression-free survival (PFS; HR 15.4, 95% CI 1.10–86.7, P = 0.009) and overall survival (OS; HR 11.4, 95% CI 1.19–52.3, P = 0.007) in NSCLC patients treated with ICI monotherapy (n = 122) but not in those treated with ICIs combined with chemotherapy (n = 67: P = 0.729 and P = 0.155, respectively). In addition, higher sPD-1 levels after treatment were significantly associated with better OS (HR 0.24, 95% CI 0.06–0.91, P = 0.037) in patients treated with anti-PD-1 monotherapy, whereas higher sPD-L1 levels after treatment were significantly associated with worse PFS (HR 6.09, 95% CI 1.42–21.0, P = 0.008) and OS (HR 42.6, 95% CI 6.83–226, P < 0.001). The levels of sPD-L1 at baseline closely correlated with those of other soluble factors, such as sCD30, IL-2Ra, sTNF-R1, and sTNF-R2, which are known to be released from the cell surface by zinc-binding proteases ADAM10/17.
Conclusions
These findings suggest the clinical significance of pretreatment sPD-L1 as well as posttreatment sPD-1 and sPD-L1 in NSCLC patients treated with ICI monotherapy.
Supplementary Information
The online version contains supplementary material available at 10.1007/s00262-023-03464-w.
Keywords: Soluble PD-1, Soluble PD-L1, Anti-PD-1 antibody, Anti-PD-L1 antibody, Non-small cell lung cancer (NSCLC)
Introduction
Lung cancer is the leading cause of cancer-related death. Recently, immune checkpoint inhibitors (ICIs), which work through the suppression of immune inhibitory pathways in T cells and the enhancement of antitumor responses, have demonstrated high efficacy in several cancers, including non-small cell lung cancer (NSCLC) [1, 2]. After randomized phase 3 trials, nivolumab and pembrolizumab, which are monoclonal antibodies (Abs) against programmed cell death protein 1 (PD-1), have become standard treatments for patients with advanced NSCLC [3–5]. However, the response rates to them have been reported to be limited. In addition, due to the possibility of severe immune-related adverse events (AEs) and high cost, patient selection should be recommended [1, 2]. Currently, the expression of programmed cell death ligand 1 (PD-L1), the ligand of PD-1, in tumor tissues has often been used as a predictive biomarker for treatment with anti-PD-1/PD-L1 Abs [6]. However, as several studies have reported that PD-1/PD-L1 Abs show a clinical benefit even in patients with tumors that do not express PD-L1, other predictive biomarkers remain to be developed [6]. In particular, since tumor tissues are sometimes difficult to obtain at the right time, especially in patients with advanced cancer, peripheral blood biomarkers that can be easily monitored in a minimally invasive manner would be preferred.
Soluble PD-1 (sPD-1) and soluble PD-L1 (sPD-L1) in plasma or serum have been reported as potential biomarkers in ICI-treated cancer patients; however, their clinical roles are still controversial [7–19]. The aim of this study was to clarify the clinical roles of plasma sPD-1 and sPD-L1 before and after ICI treatment in NSCLC patients. In particular, this is the first study to examine the differences in their clinical roles between NSCLC patients treated with ICI monotherapy and those treated with ICI combination therapy.
Materials and methods
Patients
This study included patients with NSCLC who were treated with anti-PD-1 Ab (pembrolizumab or nivolumab) or anti-PD-L1 Ab (atezolizumab) at Kanagawa Cancer Center (Yokohama, Japan) or Kurume University (Kurume, Japan) between May 2017 and February 2021. This study was conducted in accordance with the provisions of the Declaration of Helsinki and was approved by the Institutional Review Boards of Kanagawa Cancer Center (Approval numbers: 28-85 and 2019-131) and Kurume University (Approval number: 19240). Written informed consent was received from all participants prior to inclusion after the nature and possible consequences of this study had been explained.
The patients underwent assessment at baseline and received nivolumab (3 mg/kg body weight or 240 mg, every 2 weeks), pembrolizumab (200 mg, every 3 weeks), or atezolizumab (1200 mg, every 3 weeks) intravenously, with or without combined chemotherapy. They received treatment until intolerable toxicity or progressive disease (PD), which was evaluated according to the Response Evaluation Criteria in Solid Tumors (RECIST) version 1.1 using chest and abdominal computed tomography (CT) and cranial CT or magnetic resonance imaging (MRI). The PD-L1 expression in tumor cells in formalin-fixed paraffin-embedded tumor tissue sections was determined by immunohistochemistry (IHC) with an anti-PD-L1 antibody (PD-L1 IHC 22C3 pharmDx kit; Agilent Technologies. Japan, Tokyo, Japan). The tumor proportion score (TPS), which estimates the proportion of PD-L1-positive tumor cells among all viable tumor cells, was estimated in patients (n = 168), whose tumor tissues were available for IHC.
Measurement of sPD-1, sPD-L1 and other soluble immune mediators in plasma
After enrollment, peripheral blood samples were collected in tubes containing heparin as an anticoagulant from the patients before and six weeks after the initiation of anti-PD-1 or anti-PD-L1 Ab treatment. Plasma was separated by centrifugation from whole blood. The levels of sPD-1 in plasma were measured by ELISA (Human PD-1 ELISA Kit; RayBio, Norcross, GA) in accordance with the manufacturer’s instructions. The levels of sPD-L1 in plasma were also measured by ELISA (PD-L1/B7-H1 Quantikine ELISA Kit; R&D Systems, Minneapolis, MN) in accordance with the manufacturer’s instructions.
To comprehensively detect the levels of other soluble immune mediators (cytokines, cytokine receptors, etc.), a bead-based multiplex assay was used (Bio-Plex 200 system; Bio-Rad Laboratories, Hercules, CA) with 50-µl aliquots of fourfold-diluted plasma from 99 patients whose plasma samples were available for this assay, in accordance with the manufacturer’s instructions. An analyte kit (Bio-Plex Pro Human Inflammation Panel 1, Bio-Rad Laboratories) was used for measurement of the following 37 different soluble immune mediators: IL-2, IL-8, IL-10, IL-11, IL-12 (p40), IL-12 (p70), IL-19, IL-20, IL-22, IL-26, IL-27, IL-28A, IL-29, IL-32, IL-34, IL-35, IFN-α2, IFN-β, IFN-γ, APRIL, BAFF, sCD30, sCD163, chitinase 3-like-1, gp130, sIL-6Rα, LIGHT, MMP-1, MMP-2, MMP-3, osteocalcin, osteopontin, pentraxin-3, sTNF-R1, sTNF-R2, TSLP, TWEAK.
Statistical analysis
Progression-free survival (PFS) was defined as the period from the date of the first dose to the date of treatment failure (death or disease progression) or censoring at the final follow-up examination. Overall survival (OS) was defined as the period from the date of the first dose to the date of death from any cause or censoring at the final follow-up examination. A Cox regression model was used to evaluate the clinical significance of sPD-1, sPD-L1, and other factors. Kaplan‒Meier plots of PFS or OS were also used to demonstrate the clinical significance of sPD-1 or sPD-L1 levels, and intergroup comparisons were assessed using the log-rank test. Optimal cutoff values for sPD-1 or sPD-L1 before and after treatment were determined using the Cutoff Finder web application (https://molpathoheidelberg.shinyapps.io/CutoffFinder_v1) established by Budczies et al. [20]. This method fits Cox proportional hazard models to the dichotomized variable and survival variable. The optimal cutoff value was defined as the point with the most significant split by a log-rank test. Changes in sPD-1 and PD-L1 levels after treatment were compared between the subgroups using Student’s t-test. The Pearson correlation coefficient was used to determine the correlations between the levels of sPD-1 or sPD-L1 and those of other immune mediators or PD-L1 TPS in tumor tissues at baseline. P < 0.05 were considered to indicate statistical significance. All statistical analyses were conducted using JMP version 11 (SAS Institute Inc., Cary, NC).
Results
Patient characteristics
A total of 189 patients with NSCLC who were treated with anti-PD-1 Ab (pembrolizumab or nivolumab) or anti-PD-L1 Ab (atezolizumab) with or without chemotherapy between May 2017 and February 2021 were included (Supplementary Table 1). The median age was 70 (range, 37–96) years. Of the 189 patients, 144 (76.2%) were male and 45 (23.8%) were female; 122 (64.6%) had a good PS (Eastern Cooperative Oncology Group [ECOG] 0 or 1); 155 (82.0%) were current or former smokers; 134 (70.9%) and 55 (29.1%) had non-squamous and squamous cell carcinomas, respectively; 32 (16.9%) had EGFR mutation or ALK rearrangement. Of 168 patients whose tissue samples were available, PD-L1 expression was negative, weakly positive (1%–49% of tumor cells), and strongly positive (> 50% of tumor cells) in 32 (19.0%), 63 (37.5%), and 73 (43.5%) patients, respectively. For treatment, pembrolizumab, nivolumab, and atezolizumab were used in 116 (61.4%), 36 (19.0%), and 37 (19.6%) patients, respectively, and chemotherapeutic agents were combined in 67 patients (35.4%). Anti-PD-1 or anti-PD-L1 Ab was administered as the first-line, second-line, and third-line or further treatment in 100 (52.9%), 51 (27.0%), and 38 (20.1%) patients, respectively. Of the 181 patients evaluated by the RECIST criteria, the best overall responses of partial response (PR), stable disease (SD), and PD were observed in 62 (34.3%), 48 (26.5%), and 71 (39.2%) patients, respectively.
Clinical significance of pretreatment sPD-L1 levels in all NSCLC patients and subgroups of patients treated with ICIs
The clinical significance of sPD-1 and sPD-L1 before ICI treatment in all of 189 patients was evaluated by a Cox proportional hazards regression model (Supplementary Tables 1 and 2). A univariate analysis showed that sPD-L1 before treatment was significantly associated with PFS (P = 0.003) and OS (P < 0.001), whereas sPD-1 before treatment showed no significant association with PFS (P = 0.152) or OS (P = 0.258). In addition, a multivariate Cox regression analysis was further performed to evaluate the influence of sPD-1, sPD-L1, and other factors that had been shown to be significantly associated with PFS and OS in the univariate analysis (P < 0.05). sPD-L1 and the tumor expression of PD-L1 were significantly associated with PFS (hazard ratio [HR] 17.7, 95% confidence interval [CI] 2.43–129, P = 0.005; HR 0.58, 95% CI 0.39–0.86, P = 0.008, respectively) and OS (HR 13.3, 95% CI 1.61–57.1, P = 0.003; HR 0.57, 95% CI 0.36–0.88, P = 0.013, respectively).
The clinical significance of the pretreatment sPD-1 and sPD-L1 levels was further examined in subgroups stratified by other clinical factors, including the treatment line number, the type of PD-1/PD-L1 inhibitor, and the presence or absence of driver mutations. To determine the effects of treatment line number, patients were divided into the first-line therapy and second- or later-line therapy subgroups (Supplementary Table 3). In the first-line therapy subgroup (n = 100), a univariate analysis showed that higher sPD-L1 levels before treatment were significantly associated with shorter OS (P = 0.006) but not PFS (P = 0.293). In addition, in the second- or later-line therapy subgroup (n = 89), the sPD-L1 levels before treatment were significantly associated with both PFS (P = 0.002) and OS (P = 0.003). Regarding the sPD-1 levels, there were no significant associations with PFS or OS in the first-line therapy subgroup (PFS, P = 0.083; OS, P = 0.050) or the second- or later-line therapy subgroup (PFS, P = 0.640; OS, P = 0.790). Based on these results, it was considered that the clinical significance of the pretreatment sPD-L1 levels was not greatly affected by the treatment line number.
In addition, to determine the effects of different types of PD-1/PD-L1 inhibitors, patients were divided into the pembrolizumab (n = 116), nivolumab (n = 36), and atezolizumab (n = 37) subgroups (Supplementary Table 4). In the atezolizumab subgroup, a univariate analysis revealed a significant association between the sPD-L1 levels and OS (P = 0.037). In addition, in the pembrolizumab and nivolumab subgroups, the PD-L1 levels tended to show an association with OS (P = 0.086 and P = 0.109), although these associations were not statistically significant. Based on these results, it seemed that the clinical significance of the pretreatment sPD-L1 levels was not greatly affected by the type of ICIs. Furthermore, to determine the effects of driver (EGFR or ALK) mutations, patients were divided into subgroups according to the presence or absence of mutations (Supplementary Table 5). In a univariate analysis of the patients with mutations (n = 32), the sPD-1 and sPD-L1 levels showed no significant associations with PFS (P = 0.402 and P = 0.278, respectively) or OS (P = 0.650 and P = 0.823, respectively). In contrast, in patients without mutations (n = 157), the sPD-L1 levels were significantly associated with PFS (P = 0.001) and OS (P < 0.001), while the sPD-1 levels were not (PFS, P = 0.094; OS, P = 0.214). Based on these results, the pretreatment sPD-L1 levels were considered to be significantly associated with the clinical outcomes of NSCLC patients without mutations but not of those with mutations.
Clinical significance of pretreatment sPD-L1 levels in NSCLC patients treated with ICI monotherapy, but not with ICIs combined with chemotherapy
Among the 189 patients enrolled, 122 received ICI monotherapy without chemotherapy, whereas 67 received ICIs combined with chemotherapy. Therefore, to determine the effects of concomitant chemotherapy, the clinical significance of pretreatment sPD-1 and sPD-L1 was also examined in the subgroups with and without combined chemotherapy. In the subgroup treated with ICI monotherapy without chemotherapy (Tables 1 and 2), a univariate analysis showed that higher sPD-L1 levels before treatment were significantly associated with shorter PFS (P = 0.006) and OS (P = 0.001), but sPD-1 levels before treatment showed no significant association with PFS (P = 0.426) or OS (P = 0.670). In addition, when a multivariate Cox regression analysis was further performed to evaluate the influence of the pretreatment sPD-1 and sPD-L1 levels and other clinical factors significantly associated with PFS or OS in the univariate analysis (P < 0.05), higher sPD-L1 levels were significantly predictive of both unfavorable PFS (HR 15.4, 95% CI 1.10–86.7, P = 0.009) and OS (HR 11.4, 95% CI 1.19–52.3, P = 0.007) (Tables 1 and 2). The patients were divided into two groups depending on the sPD-L1 levels in the subgroup without chemotherapy, and PFS and OS were compared between these two groups. As shown in Fig. 1, PFS and OS were significantly longer in the sPD-L1low group than in the PD-L1high group (PFS: low 132 days vs. high 76 days, P = 0.019; OS: low 444 days vs. high 115 days, P < 0.001 [log-rank test]).
Table 1.
Clinical characteristics and their association with PFS in patients who received immune checkpoint inhibitor monotherapy
| Patient characteristics | Median (SD), Number (%) | Univariate | Multivariate | ||
|---|---|---|---|---|---|
| HR (95% CI) | P Value | HR (95% CI) | P Value | ||
| Age (years), Median (SD) | 71 (8.7) | 0.56 (0.16–2.02) | 0.371 | ||
| Sex, N (%) | |||||
| Male | 90 (75.0%) | 1 | |||
| Female | 30 (25.0%) | 1.40 (0.89–2.14) | 0.133 | ||
| PS, N (%) | |||||
| 0–1 | 58 (48.3%) | 1 | |||
| 2–3 | 62 (51.7%) | 0.88 (0.59–1.31) | 0.525 | ||
| Smoking, N (%) | |||||
| Former | 94 (78.3%) | 1 | |||
| Never | 26 (21.7%) | 1.40 (0.87–2.18) | 0.148 | ||
| Histology, N (%) | |||||
| Non-Squamous | 88 (73.3%) | 1 | |||
| Squamous | 32 (26.7%) | 0.93 (0.57–1.45) | 0.750 | ||
| Driver mutation, N (%) | |||||
| Wild type | 104 (86.7%) | 1 | |||
| EGFR or ALK | 16 (13.3%) | 1.93 (1.04–3.32) | 0.025 | 1.73 (0.91–3.06) | 0.075 |
| Tumor PD-L1 expression, N (%) | |||||
| 0–49% | 54 (45.0%) | 1 | 1 | ||
| 50—100% | 53 (44.2%) | 0.58 (0.38–0.89) | 0.013 | 0.56 (0.36–0.88) | 0.011 |
| NA | 13 (10.8%) | ||||
| PD-1/PD-L1 inhibitor, N (%) | |||||
| Pembrolizumab | 67 (55.8%) | 1 | |||
| Nivolumab | 33 (27.5%) | 1.02 (0.62–1.62) | 0.948 | ||
| Atezolizumab | 20 (16.7%) | 1.11 (0.63–1.85) | 0.712 | ||
| Treatment line, N (%) | |||||
| 1 | 49 (40.8%) | 1 | |||
| > 2 | 71 (59.2%) | 1.24 (0.83–1.89) | 0.299 | ||
| sPD-1 (before, pg/ml), Median (SD) | 205.1 (278.3) | 1.68 (0.41–5.30) | 0.426 | 2.00 (0.44–6.93) | 0.320 |
| sPD-L1 (before, pg/ml), Median (SD) | 57.7 (128.8) | 17.7 (1.32–99.2) | 0.006 | 15.4 (1.10–86.7) | 0.009 |
Categorical variables are shown as the distribution of corresponding patient numbers. Continuous variables are shown as the median and standard deviation (SD). The univariate and multivariate analyses were conducted using a Cox proportional hazards model for progression-free survival (PFS). Abbreviations: hazard ratio (HR), confidence interval (CI), performance status (PS), epidermal growth factor receptor (EGFR), anaplastic lymphoma kinase (ALK), not assessed (NA), soluble PD-1 (sPD-1), soluble PD-L1 (sPD-L1)
Table 2.
Clinical characteristics and their association with OS in patients who received immune checkpoint inhibitor monotherapy
| Patient characteristics | Median (SD), Number (%) | Univariate | Multivariate | ||
|---|---|---|---|---|---|
| HR (95% CI) | P Value | HR (95% CI) | P Value | ||
| Age (years), Median (SD) | 71 (8.6) | 0.94 (0.25–3.82) | 0.929 | ||
| Sex, N (%) | |||||
| Male | 91 (74.6%) | 1 | |||
| Female | 31 (25.4%) | 1.09 (0.65–1.75) | 0.743 | ||
| PS, N (%) | |||||
| 0–1 | 59 (48.4%) | 1 | |||
| 2–3 | 63 (51.6%) | 1.46 (0.93–2.30) | 0.100 | ||
| Smoking, N (%) | |||||
| Former | 95 (77.9%) | 1 | |||
| Never | 27 (22.1%) | 1.36 (0.80–2.23) | 0.233 | ||
| Histology, N (%) | |||||
| Non-Squamous | 90 (73.8%) | 1 | |||
| Squamous | 32 (26.2%) | 1. 13 (0.66–1.86) | 0.645 | ||
| Driver mutation, N (%) | |||||
| Wild type | 106 (86.9%) | 1 | |||
| EGFR or ALK | 16 (13.1%) | 1.36 (0.68–2.47) | 0.343 | ||
| Tumor PD-L1 expression, N (%) | |||||
| 0–49% | 54 (44.3%) | 1 | 1 | ||
| 50—100% | 55 (45.1%) | 0.54 (0.33–0.87) | 0.013 | 0.61 (0.34–1.07) | 0.087 |
| NA | 13 (10.7%) | ||||
| PD-1/PD-L1 inhibitor, N (%) | |||||
| Pembrolizumab | 69 (56.6%) | 1 | |||
| Nivolumab | 33 (27.0%) | 1.50 (0.88–2.49) | 0.129 | ||
| Atezolizumab | 20 (16.4%) | 1.31 (0.70–2.33) | 0.379 | ||
| Treatment line, N (%) | |||||
| 1 | 51 (41.8%) | 1 | |||
| > 2 | 71 (58.2%) | 1.75 (1.10–2.86) | 0.022 | 1.34 (0.76–2.40) | 0.318 |
| sPD-1 (before, pg/ml), Median (SD) | 201.3 (276.4) | 1.38 (0.25–5.16) | 0.670 | 1.51 (0.25–6.37) | 0.615 |
| sPD-L1 (before, pg/ml), Median (SD) | 57.7 (127.8) | 17.8 (1.89–80.1) | 0.001 | 11.4 (1.19–52.3) | 0.007 |
Categorical variables are shown as the distribution of corresponding patient numbers. Continuous variables are shown as the median and standard deviation (SD). The univariate and multivariate analyses were conducted using a Cox proportional hazards model for overall survival (OS). Abbreviations: hazard ratio (HR), confidence interval (CI), performance status (PS), epidermal growth factor receptor (EGFR), anaplastic lymphoma kinase (ALK), not assessed (NA), soluble PD-1 (sPD-1), soluble PD-L1 (sPD-L1)
Fig. 1.
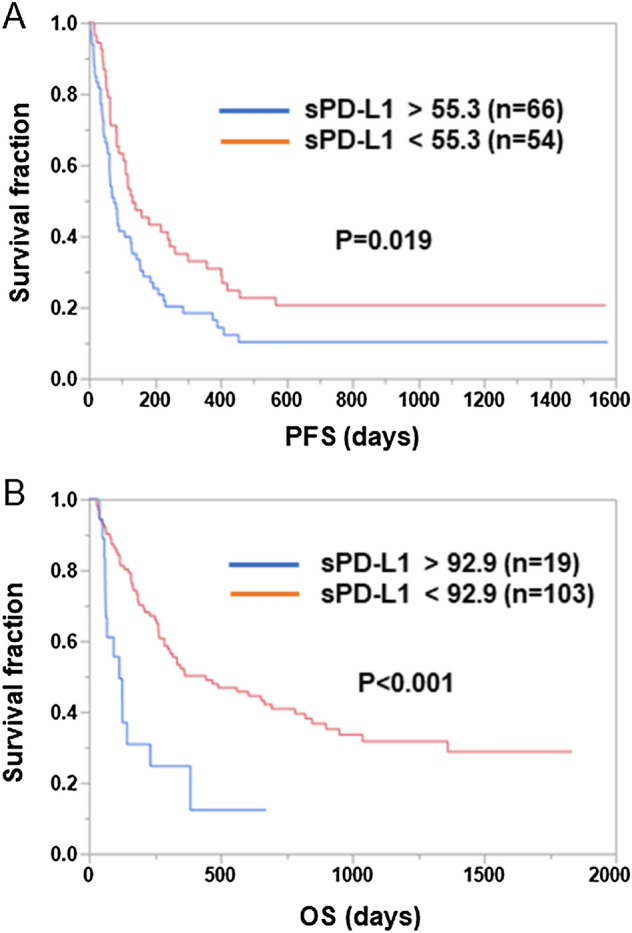
Associations between pretreatment sPD-L1 levels and PFS or OS in NSCLC patients treated with ICI monotherapy. Patients treated with ICI monotherapy were divided into two groups based on the pretreatment sPD-L1 levels. Optimal cutoff values for PFS and OS were determined using the Cutoff Finder web application. Kaplan–Meier plots of PFS (A) and OS (B) for the low and high sPD-L1 groups are shown. Differences were statistically analyzed using the log-rank test
In contrast, in the subgroup treated with ICI combined with chemotherapy (Table 3), a univariate analysis showed that neither the pretreatment sPD-1 levels nor the sPD-L1 levels were significantly associated with PFS (P = 0.228 and P = 0.729, respectively) or OS (P = 0.143 and P = 0.155, respectively). These results suggested that the sPD-L1 levels at baseline were significantly associated with PFS and OS in NSCLC patients treated with ICI monotherapy but not in those treated with ICIs combined with chemotherapy.
Table 3.
Clinical characteristics and their association with PFS or OS in patients who received immune checkpoint inhibitors combined with chemotherapy
| Patient characteristics | Median (SD), Number (%) | PFS | OS | ||
|---|---|---|---|---|---|
| HR (95% CI) | P Value | HR (95% CI) | P Value | ||
| Age (years), Median (SD) | 67 (9.5) | 2.05 (0.40–9.75) | 0.378 | 1.13 (0.19–6.53) | 0.894 |
| Sex, N (%) | |||||
| Male | 53 (79.1%) | 1 | 1 | ||
| Female | 14 (20.9%) | 1.58 (0.77–3.02) | 0.185 | 1.87 (0.89–3.68) | 0.081 |
| PS, N (%) | |||||
| 0–1 | 63 (94.0%) | 1 | 1 | ||
| 2–3 | 4 (6.0%) | 0.25 (0.01–1.13) | 0.167 | 0.91 (0.15–2.99) | 0.898 |
| Smoking, N (%) | |||||
| Former | 60 (89.6%) | 1 | 1 | ||
| Never | 7 (10.4%) | 1.94 (0.73–4.35) | 0.140 | 1.37 (0.47–3.24) | 0.510 |
| Histology, N (%) | |||||
| non-Squamous | 44 (65.7%) | 1 | 1 | ||
| Squamous | 23 (34.3%) | 0.96 (0.50–1.74) | 0.890 | 1. 14 (0.56–2.20) | 0.706 |
| Driver mutation, N (%) | |||||
| Wild type | 51 (76.1%) | 1 | 1 | ||
| EGFR or ALK | 16 (23.9%) | 1.15 (0.59–2.13) | 0.666 | 0.74 (0.32–1.54) | 0.449 |
| Tumor PD-L1 expression, N (%) | |||||
| 0–49% | 41 (61.2%) | 1 | 1 | ||
| 50—100% | 18 (26.9%) | 0.53 (0.25–1.05) | 0.085 | 0.56 (0.22–1.22) | 0.170 |
| NA | 8 (11.9%) | ||||
| PD-1/PD-L1 inhibitor, N (%) | |||||
| Pembrolizumab | 47 (70.1%) | 1 | 1 | ||
| Nivolumab | 3 (4.5%) | 0.44 (0.02–2.06) | 0.357 | 1.88X10⁻⁹ (0–0.91) | 0.040 |
| Atezolizumab | 17 (25.4%) | 1.19 (0.61–2.18) | 0.600 | 1.08 (0.51–2.13) | 0.828 |
| Treatment line, N (%) | |||||
| 1 | 49 (73.1%) | 1 | 1 | ||
| > 2 | 18 (26.9%) | 1.86 (0.99–3.37) | 0.046 | 1.61 (0.79–3.15) | 0.174 |
| sPD-1 (before, pg/ml), Median (SD) | 181.4 (284.7) | 2.42 (0.46–8.66) | 0.228 | 3.51 (0.50–15.5) | 0.143 |
| sPD-L1 (before, pg/ml), Median (SD) | 56.9 (36.7) | 1.36 (0.19–6.23) | 0.729 | 3.78 (0.46–18.9) | 0.155 |
Categorical variables are shown as the distribution of corresponding patient numbers. Continuous variables are shown as the median and standard deviation (SD). The univariate analyses were conducted using a Cox proportional hazards model for progression-free survival (PFS) or overall survival (OS). Abbreviations: hazard ratio (HR), confidence interval (CI), performance status (PS), epidermal growth factor receptor (EGFR), anaplastic lymphoma kinase (ALK), not assessed (NA), soluble PD-1 (sPD-1), soluble PD-L1 (sPD-L1)
Clinical significance of posttreatment sPD-1 and sPD-L1 levels in NSCLC patients treated with anti-PD-1 Ab monotherapy
As shown in Fig. 2, the increase in sPD-1 levels after treatment with anti-PD-1 Ab (pembrolizumab or nivolumab) was significantly higher than that after treatment with anti-PD-L1 Ab (atezolizumab) (p < 0.001). In contrast, the increase in sPD-L1 levels after treatment with anti-PD-L1 Ab (atezolizumab) was significantly greater than that after treatment with anti-PD-1 Ab (pembrolizumab or nivolumab) (p < 0.001). Therefore, posttreatment sPD-1 and sPD-L1 levels were evaluated in the subgroups treated with anti-PD-1 Ab monotherapy (nivolumab or pembrolizumab, n = 102) or anti-PD-L1 Ab (atezolizumab, n = 20).
Fig. 2.

Changes in sPD-1 and sPD-L1 levels after treatment with anti-PD-1 Ab (pembrolizumab or nivolumab) or anti-PD-L1 Ab (atezolizumab). The changes in sPD-1 (A) and sPD-L1 (B) levels after treatment were compared between the subgroups treated with anti-PD-1 Ab (pembrolizumab or nivolumab [Pem/Nivo], N = 139) or anti-PD-L1 Ab (atezolizumab [Atezo], N = 34) using Student’s t-test. Data are shown in box plot format. The bottom and top of the box represent the first and third quartiles, and the band and “X” inside the box correspond to the median and mean, respectively. Whiskers indicate the variability outside the upper and lower quartiles. Outliers are plotted as individual points
In the subgroup treated with anti-PD-1 Ab monotherapy, sPD-1 levels after treatment were significantly associated with OS (P = 0.002) but not with PFS (P = 0.171), while sPD-L1 levels showed significant associations with both PFS (P = 0.004) and OS (P < 0.001). In addition, in this subgroup, the change in the sPD-1 levels after treatment was significantly associated with OS (P = 0.002) but not with PFS (P = 0.144), while the change in the sPD-L1 levels after treatment showed significant associations with both PFS (P = 0.034) and OS (P = 0.006). When a multivariate Cox regression analysis was further performed to evaluate the influence of the posttreatment sPD-1 and sPD-L1 levels and other clinical factors that were found to be significantly associated with PFS or OS in the univariate analysis (P < 0.05), higher sPD-1 levels after treatment were significantly associated with better OS (HR 0.24, 95% CI 0.06–0.91, P = 0.037) and higher sPD-L1 levels after treatment were significantly associated with worse PFS (HR 6.09, 95% CI 1.42–21.0, P = 0.008) and OS (HR 42.6, 95% CI 6.83–226, P < 0.001) (Supplementary Tables 6 and 7).
The patients were divided into two groups depending on the posttreatment sPD-1 and sPD-L1 levels in the subgroup with anti-PD-1 Ab monotherapy, and PFS and OS were compared between these two groups. As shown in Fig. 3, both PFS and OS were significantly shorter in the sPD-1low group than in the sPD-1high group (PFS: low 62 days vs. high 165 days, P = 0.002; OS: low 183 days vs. high 821 days, P < 0.001 [log-rank test]). In contrast, both PFS and OS were significantly longer in the sPD-L1low group than in the sPD-L1high group (PFS: low 239 days vs. high 64 days, P < 0.001; OS: low 653 days vs. high 118 days, P < 0.001 [log-rank test]).
Fig. 3.

Associations between posttreatment sPD-1 and sPD-L1 levels and PFS or OS in NSCLC patients treated with anti-PD-1 Ab monotherapy. (A, B) Patients treated with anti-PD-1 Ab monotherapy were divided into two groups based on their posttreatment sPD-1 levels. Optimal cutoff values for PFS and OS were determined using the Cutoff Finder web application. Kaplan–Meier plots of PFS (A) and OS (B) for the sPD-1low and sPD-1high groups are shown. Differences were statistically analyzed using the log-rank test. (C, D) Patients treated with anti-PD-1 Ab monotherapy were divided into two groups based on posttreatment sPD-L1 levels. Optimal cutoff values for PFS and OS were determined using the Cutoff Finder web application. Kaplan–Meier plots of PFS (C) and OS (D) for the sPD-L1low and sPD-L1high groups are shown. Differences were statistically analyzed using the log-rank test
In contrast, in the subgroup treated with anti-PD-L1 Ab (atezolizumab) monotherapy, neither the posttreatment sPD-1 levels nor sPD-L1 levels showed a significant association with PFS (P = 0.932 and P = 0.989, respectively) or OS (P = 0.304 and P = 0.843, respectively). In addition, no significant associations were observed between the posttreatment changes in sPD-1 and sPD-L1 levels and PFS (p = 0.054 and p = 0.842, respectively) or OS (p = 0.744 and p = 0.730, respectively) in this subgroup (data not shown).
Correlations between the levels of sPD-L1 and other soluble factors or the PD-L1 expression in tumor cells at baseline
Thirty-seven soluble immune mediators, such as cytokines and receptors, in plasma were analyzed before treatment to examine their correlation with sPD-1 and sPD-L1 levels. As shown in Fig. 4, the levels of sPD-L1 were well correlated (r > 0.65) with those of sCD30 (correlation coefficient (r) = 0.760, P < 0.001), IL-2Ra (r = 0.683, P < 0.001), sTNF-R1 (r = 0.659, P < 0.001), and sTNF-R2 (r = 0.719, P < 0.001) at baseline. In contrast, there were no high correlations (r > 0.5) between pretreatment sPD-1 levels and other soluble factors. In addition, the PD-L1 expression in tumor cells was evaluated to investigate the correlation with the sPD-1 and sPD-L1 levels at baseline. No correlation was observed between sPD-1 or sPD-L1 levels and the PD-L1 expression in tumor cells (PD-L1 TPS) (r = 0.057 and r = 0.163, respectively) (Fig. 4).
Fig. 4.

Correlations between the levels of sPD-L1 and other soluble factors or the PD-L1 expression in tumor cells before treatment. The correlations between the levels of sPD-L1 and other soluble factors, including sCD30, IL-2Ra, sTNF-R1, and sTNF-R2, before treatment were analyzed by Pearson’s correlation coefficient (n = 99). The correlations between the sPD-L1 and sPD-1 levels and the PD-L1 expression in tumor cells (TPS) before treatment were also analyzed by Pearson’s correlation coefficient (n = 168). The correlation coefficient (r) and P-value are shown
Discussion
There have been several reports on sPD-1 or sPD-L1 in plasma or serum from ICI-treated cancer patients; however, their clinical roles have been controversial [7–19]. In the present study, we examined the clinical roles of plasma sPD-1 and sPD-L1 in ICI-treated NSCLC patients. Interestingly, we demonstrated that plasma sPD-L1 levels at baseline were significantly associated with PFS and OS in NSCLC patients treated with ICI monotherapy but not in those treated with ICIs combined with chemotherapy. This is the first study to demonstrate a difference in the clinical significance of sPD-L1 between NSCLC patients treated with ICI monotherapy and those treated with ICI combination therapy. Our results suggested that concomitant chemotherapy might lessen the significance of sPD-L1 as a potential biomarker of ICI treatment, possibly because sPD-L1 levels do not affect the clinical responses to chemotherapeutic agents. Since plasma sPD-L1 from NSCLC patients was shown to bind to PD-1 [21], sPD-L1 might compete with ICIs and promote the exhaustion of activated T cells by binding to PD-1 expressed on the surface of T cells, as suggested previously [22]. In addition, we found that the sPD-L1 levels at baseline were significantly associated with the clinical outcomes of NSCLC patients without mutations but not of those with mutations. Since patients with mutations were more frequently (50%) treated with ICIs in combination with chemotherapy, it is possible that the clinical significance of sPD-L1 was reduced. Nevertheless, further studies are needed to confirm this finding, because the number of patients with mutations was relatively small in the current study.
Notably, treatment with anti-PD-1 Ab and anti-PD-L1 Ab drastically increased the plasma levels of sPD-1 and sPD-L1, respectively. Therefore, we analyzed the clinical roles of plasma levels of these molecules after treatment in the two different cohorts treated with anti-PD-1 Ab or anti-PD-L1 Ab monotherapy. In the cohort of patients treated with anti-PD-1 Ab monotherapy, sPD-1 levels after treatment showed clinical significance; higher sPD-1, as well as a greater increase in sPD-1, after treatment were significantly associated with longer OS. Similar to our findings, other studies also demonstrated that a posttreatment increase in sPD-1 was associated with better efficacy of anti-PD-1 Ab in melanoma [13] and NSCLC [16]. Based on these results, it may be possible that sPD-1 retains its ability to bind to membrane-bound PD-L1 on tumor cells and prevents its interaction with membrane-bound PD-1 on tumor-infiltrating T cells, thereby functioning as an endogenous PD-L1 inhibitor. This action of sPD-1 might restore antitumor T-cell function [23]. The precise mechanism of the drastic increase in sPD-1 levels after anti-PD-1 Ab treatment remains unknown, but the binding of anti-PD-1 Ab to sPD-1 might form an sPD-1-Ab complex and reduce its clearance from circulation, as reported in anti-TNF therapy [24].
In addition to sPD-1, plasma sPD-L1 levels after treatment also showed clinical significance in the cohort of anti-PD-1 Ab monotherapy; higher sPD-L1, as well as a greater increase in sPD-L1 after treatment, were significantly associated with worse OS. This finding might further support the notion that sPD-L1 promotes the exhaustion of activated T cells by binding to PD-1 on the surface of T cells. In contrast, neither the plasma sPD-1 and sPD-L1 levels at baseline nor those after treatment showed clinical significance in the cohort of patients who received anti-PD-L1 Ab monotherapy. Nevertheless, since the number of patients in this cohort was relatively small, more studies are necessary to confirm this finding.
In the current study, the sPD-L1 levels at baseline were not correlated with the PD-L1 expression in tumor cells, which is consistent with previous reports [8, 9]. It is therefore possible that sPD-L1 is generated and secreted by cells other than tumor cells, such as immune cells. Alternatively, the sPD-L1 levels may reflect the heterogeneity of the PD-L1 expression in entire tumor tissues or differences in tumor mass, although data to support this possibility are currently limited. It should be noted that the sPD-L1 levels were highly correlated with other soluble receptors, such as sCD30, sTNF-R1, sTNF-R2, and IL-2Ra, in plasma at baseline. These ligands of the TNF superfamily (sCD30, sTNF-R1, sTNF-R2) [25, 26] and IL-2Ra [27] were reported to be released from the cell surface by zinc-binding proteases, a disintegrin and metalloprotease (ADAM) 10 and/or ADAM17, whose activation leads to substrate cleavage proximal to the cell surface in a process called ectodomain ‘shedding’. In addition, Orme et al. showed that ADAM10 and ADAM17 cleave PD-L1 from the surface of malignant cells, thereby producing sPD-L1, which induces apoptosis in CD8+ T cells and compromises the killing of tumor cells by CD8+ T cells [28]. Therefore, the high correlations between sPD-L1 and other soluble receptors might be explained by the effects of ADAM10 and ADAM17. In addition, the different activities of ADAM10 and ADAM17, which reflect sPD-L1 levels, may be one of the reasons for the lower correlation between the sPD-L1 levels and PD-L1 expression in tumor cells. Considering the immune functions of these soluble receptors, it is possible that they modulate the immune microenvironment in collaboration with sPD-L1. Since sPD-L1 is associated with worse OS, combined treatment with ADAM10/ADAM17 inhibitors may improve the clinical efficacy of ICIs.
In summary, the current study demonstrated that pretreatment sPD-L1 levels in plasma were useful for predicting PFS and OS only in NSCLC patients undergoing ICI monotherapy. In addition, monitoring the changes in the plasma sPD-1 and sPD-L1 levels at the early stage during anti-PD-1 Ab monotherapy was also useful for predicting OS in NSCLC patients. Nevertheless, the present study contained several limitations. One limitation was that patients with different clinical characteristics, such as PS, driver mutations, tumor PD-L1 expression, and types of PD-1/PD-L1 inhibitors, were included, but the number of patients was relatively small, which made it difficult to perform sub-analyses to clarify their clinical effects. Secondly, the sources and mechanisms of the plasma sPD-1 and sPD-L1 production or secretion remain unclarified. Given the growing interest in biomarkers for patients with NSCLC treated with ICIs, further large-scale studies of patients are warranted to allow more detailed analyses and to confirm the usefulness of our results.
Supplementary Information
Below is the link to the electronic supplementary material.
Acknowledgements
This study was supported by AMED (Grant Number 22ae0101076h0004). We would like to thank Junya Otake, Megumi Abe, Akiko Orikasa, and Makoto Wakatsuki (Kanagawa Cancer Center Research Institute) for sample handling and data acquisition.
Author contributions
Hidetomo Himuro and Tetsuro Sasada conceived the study. Yoshiro Nakahara, Norikazu Matsuo, Shuji Murakami, Haruhiro Saito, and Koichi Azuma contributed to sample collection and patient data management. Hidetomo Himuro, Yuka Igarashi, Taku Kouro, Naoko Higashijima, Feifei Wei, Shun Horaguchi, Kayoko Tsuji, Yasunobu Mano, and Tetsuro Sasada analyzed the samples and data. Hidetomo Himuro and Tetsuro Sasada wrote the main manuscript text. All of the authors approved the final version of the manuscript.
Declarations
Competing interests
Yoshiro Nakahara received honoraria from Ono, Takeda, Eli Lilly, Kyowa Kirin, Boehringer Ingelheim, AstraZeneca, and Bristol Myers Squibb and research funds from Bristol Myers Squibb. Shuji Murakami received honoraria from AstraZeneca, Chugai, Boehringer Ingelheim, Taiho, Pfizer, MSD, and Ono. Haruhiro Saito received honoraria from Boehringer Ingelheim, Eli Lilly, Pfizer, AstraZeneca, Bristol Myers Squibb, Chugai, and Ono and research funds from AstraZeneca, Bristol Myers Squibb, Chugai, and Ono. Koichi Azuma received honoraria from AstraZeneca, MSD, Bristol Myers Squibb, Ono and Chugai. Tetsuro Sasada received honoraria from Chugai and Bristol Myers Squibb and research funds from Taiho and BrightPath Biotherapeutics. No other potential conflicts of interest were reported.
Footnotes
Publisher's Note
Springer Nature remains neutral with regard to jurisdictional claims in published maps and institutional affiliations.
Hidetomo Himuro and Yoshiro Nakahara have contributed equally.
References
- 1.Ribas A, Wolchok JD. Cancer immunotherapy using checkpoint blockade. Science. 2018;359:1350–1355. doi: 10.1126/science.aar4060. [DOI] [PMC free article] [PubMed] [Google Scholar]
- 2.Grant MJ, Herbst RS, Goldberg SB. Selecting the optimal immunotherapy regimen in driver-negative metastatic NSCLC. Nat Rev Clin Oncol. 2021;18:625–644. doi: 10.1038/s41571-021-00520-1. [DOI] [PubMed] [Google Scholar]
- 3.Borghaei H, Paz-Ares L, Horn L, Spigel DR, Steins M, Ready NE, Chow LQ, Vokes EE, Felip E, Holgado E, Barlesi F, Kohlhäufl M, Arrieta O, Burgio MA, Fayette J, Lena H, Poddubskaya E, Gerber DE, Gettinger SN, Rudin CM, Rizvi N, Crinò L, Blumenschein GR, Antonia SJ, Dorange C, Harbison CT, Graf Finckenstein F, Brahmer JR. Nivolumab versus docetaxel in advanced nonsquamous non-small-cell lung cancer. N Engl J Med. 2015;373:1627–1639. doi: 10.1056/NEJMoa1507643. [DOI] [PMC free article] [PubMed] [Google Scholar]
- 4.Brahmer J, Reckamp KL, Baas P, Crinò L, Eberhardt WE, Poddubskaya E, Antonia S, Pluzanski A, Vokes EE, Holgado E, Waterhouse D, Ready N, Gainor J, Arén Frontera O, Havel L, Steins M, Garassino MC, Aerts JG, Domine M, Paz-Ares L, Reck M, Baudelet C, Harbison CT, Lestini B, Spigel DR. Nivolumab versus docetaxel in advanced squamous-cell non-small-cell lung cancer. N Engl J Med. 2015;373:123–135. doi: 10.1056/NEJMoa1504627. [DOI] [PMC free article] [PubMed] [Google Scholar]
- 5.Herbst RS, Baas P, Kim DW, Felip E, Pérez-Gracia JL, Han JY, Molina J, Kim JH, Arvis CD, Ahn MJ, Majem M, Fidler MJ, de Castro G, Garrido M, Lubiniecki GM, Shentu Y, Im E, Dolled-Filhart M, Garon EB. Pembrolizumab versus docetaxel for previously treated, PD-L1-positive, advanced non-small-cell lung cancer (KEYNOTE-010): a randomised controlled trial. Lancet. 2016;387:1540–1550. doi: 10.1016/S0140-6736(15)01281-7. [DOI] [PubMed] [Google Scholar]
- 6.Doroshow DB, Bhalla S, Beasley MB, Sholl LM, Kerr KM, Gnjatic S, Wistuba II, Rimm DL, Tsao MS, Hirsch FR. PD-L1 as a biomarker of response to immune-checkpoint inhibitors. Nat Rev Clin Oncol. 2021;18:345–362. doi: 10.1038/s41571-021-00473-5. [DOI] [PubMed] [Google Scholar]
- 7.Zhou J, Mahoney KM, Giobbie-Hurder A, Zhao F, Lee S, Liao X, Rodig S, Li J, Wu X, Butterfield LH, Piesche M, Manos MP, Eastman LM, Dranoff G, Freeman GJ, Hodi FS. Soluble PD-L1 as a biomarker in malignant melanoma treated with checkpoint blockade. Cancer Immunol Res. 2017;5:480–492. doi: 10.1158/2326-6066.Cir-16-0329. [DOI] [PMC free article] [PubMed] [Google Scholar]
- 8.Kruger S, Legenstein ML, Rösgen V, Haas M, Modest DP, Westphalen CB, Ormanns S, Kirchner T, Heinemann V, Holdenrieder S, Boeck S. Serum levels of soluble programmed death protein 1 (sPD-1) and soluble programmed death ligand 1 (sPD-L1) in advanced pancreatic cancer. Oncoimmunology. 2017;6:e1310358. doi: 10.1080/2162402x.2017.1310358. [DOI] [PMC free article] [PubMed] [Google Scholar]
- 9.Costantini A, Julie C, Dumenil C, Hélias-Rodzewicz Z, Tisserand J, Dumoulin J, Giraud V, Labrune S, Chinet T, Emile JF, Giroux Leprieur E. Predictive role of plasmatic biomarkers in advanced non-small cell lung cancer treated by nivolumab. Oncoimmunology. 2018;7:e1452581. doi: 10.1080/2162402x.2018.1452581. [DOI] [PMC free article] [PubMed] [Google Scholar]
- 10.Music M, Iafolla MAJ, Ren AH, Soosaipillai A, Prassas I, Diamandis EP. Serum PD-1 Is elevated after pembrolizumab treatment but has no predictive value. Mol Cancer Ther. 2019;18:1844–1851. doi: 10.1158/1535-7163.Mct-19-0132. [DOI] [PubMed] [Google Scholar]
- 11.Ugurel S, Schadendorf D, Horny K, Sucker A, Schramm S, Utikal J, Pföhler C, Herbst R, Schilling B, Blank C, Becker JC, Paschen A, Zimmer L, Livingstone E, Horn PA, Rebmann V. Elevated baseline serum PD-1 or PD-L1 predicts poor outcome of PD-1 inhibition therapy in metastatic melanoma. Ann Oncol. 2020;31:144–152. doi: 10.1016/j.annonc.2019.09.005. [DOI] [PubMed] [Google Scholar]
- 12.Murakami S, Shibaki R, Matsumoto Y, Yoshida T, Goto Y, Kanda S, Horinouchi H, Fujiwara Y, Yamamoto N, Ohe Y. Association between serum level soluble programmed cell death ligand 1 and prognosis in patients with non-small cell lung cancer treated with anti-PD-1 antibody. Thorac Cancer. 2020;11:3585–3595. doi: 10.1111/1759-7714.13721. [DOI] [PMC free article] [PubMed] [Google Scholar]
- 13.Babačić H, Lehtiö J, Pico de Coaña Y, Pernemalm M, Eriksson H. In-depth plasma proteomics reveals increase in circulating PD-1 during anti-PD-1 immunotherapy in patients with metastatic cutaneous melanoma. J Immunother Cancer. 2020 doi: 10.1136/jitc-2019-000204. [DOI] [PMC free article] [PubMed] [Google Scholar]
- 14.Incorvaia L, Fanale D, Badalamenti G, Porta C, Olive D, De Luca I, Brando C, Rizzo M, Messina C, Rediti M, Russo A, Bazan V, Iovanna JL. Baseline plasma levels of soluble PD-1, PD-L1, and BTN3A1 predict response to nivolumab treatment in patients with metastatic renal cell carcinoma: a step toward a biomarker for therapeutic decisions. Oncoimmunology. 2020;9:1832348. doi: 10.1080/2162402x.2020.1832348. [DOI] [PMC free article] [PubMed] [Google Scholar]
- 15.Castello A, Rossi S, Toschi L, Mansi L, Lopci E. Soluble PD-L1 in NSCLC patients treated with checkpoint inhibitors and its correlation with metabolic parameters. Cancers. 2020 doi: 10.3390/cancers12061373. [DOI] [PMC free article] [PubMed] [Google Scholar]
- 16.Tiako Meyo M, Jouinot A, Giroux-Leprieur E, Fabre E, Wislez M, Alifano M, Leroy K, Boudou-Rouquette P, Tlemsani C, Khoudour N, Arrondeau J, Thomas-Schoemann A, Blons H, Mansuet-Lupo A, Damotte D, Vidal M, Goldwasser F, Alexandre J, Blanchet B. Predictive Value of Soluble PD-1, PD-L1, VEGFA, CD40 Ligand and CD44 for nivolumab therapy in advanced non-small cell lung cancer: a case-control study. Cancers. 2020 doi: 10.3390/cancers12020473. [DOI] [PMC free article] [PubMed] [Google Scholar]
- 17.Machiraju D, Wiecken M, Lang N, Hülsmeyer I, Roth J, Schank TE, Eurich R, Halama N, Enk A, Hassel JC. Soluble immune checkpoints and T-cell subsets in blood as biomarkers for resistance to immunotherapy in melanoma patients. Oncoimmunology. 2021;10:1926762. doi: 10.1080/2162402x.2021.1926762. [DOI] [PMC free article] [PubMed] [Google Scholar]
- 18.Krafft U, Olah C, Reis H, Kesch C, Darr C, Grünwald V, Tschirdewahn S, Hadaschik B, Horvath O, Kenessey I, Nyirady P, Varadi M, Modos O, Csizmarik A, Szarvas T. High Serum PD-L1 levels are associated with poor survival in urothelial cancer patients treated with chemotherapy and immune checkpoint inhibitor therapy. Cancers. 2021 doi: 10.3390/cancers13112548. [DOI] [PMC free article] [PubMed] [Google Scholar]
- 19.Ohkuma R, Ieguchi K, Watanabe M, Takayanagi D, Goshima T, Onoue R, Hamada K, Kubota Y, Horiike A, Ishiguro T, Hirasawa Y, Ariizumi H, Tsurutani J, Yoshimura K, Tsuji M, Kiuchi Y, Kobayashi S, Tsunoda T, Wada S. Increased plasma soluble PD-1 concentration correlates with disease progression in patients with cancer treated with anti-PD-1 antibodies. Biomedicines. 2021 doi: 10.3390/biomedicines9121929. [DOI] [PMC free article] [PubMed] [Google Scholar]
- 20.Budczies J, Klauschen F, Sinn BV, Győrffy B, Schmitt WD, Darb-Esfahani S, Denkert C. Cutoff Finder: a comprehensive and straightforward Web application enabling rapid biomarker cutoff optimization. PLoS One. 2012;7:e51862. doi: 10.1371/journal.pone.0051862. [DOI] [PMC free article] [PubMed] [Google Scholar]
- 21.Takeuchi M, Doi T, Obayashi K, Hirai A, Yoneda K, Tanaka F, Iwai Y. Soluble PD-L1 with PD-1-binding capacity exists in the plasma of patients with non-small cell lung cancer. Immunol Lett. 2018;196:155–160. doi: 10.1016/j.imlet.2018.01.007. [DOI] [PubMed] [Google Scholar]
- 22.Frigola X, Inman BA, Lohse CM, Krco CJ, Cheville JC, Thompson RH, Leibovich B, Blute ML, Dong H, Kwon ED. Identification of a soluble form of B7–H1 that retains immunosuppressive activity and is associated with aggressive renal cell carcinoma. Clin Cancer Res. 2011;17:1915–1923. doi: 10.1158/1078-0432.Ccr-10-0250. [DOI] [PMC free article] [PubMed] [Google Scholar]
- 23.Song MY, Park SH, Nam HJ, Choi DH, Sung YC. Enhancement of vaccine-induced primary and memory CD8(+) T-cell responses by soluble PD-1. J Immunother. 2011;34:297–306. doi: 10.1097/CJI.0b013e318210ed0e. [DOI] [PubMed] [Google Scholar]
- 24.Berkhout LC, Lami MJ, Ruwaard J, Hart MH, Heer PO, Bloem K, Nurmohamed MT, van Vollenhoven RF, Boers M, Alvarez DF, Smith CH, Wolbink GJ, Rispens T. Dynamics of circulating TNF during adalimumab treatment using a drug-tolerant TNF assay. Sci Transl Med. 2019 doi: 10.1126/scitranslmed.aat3356. [DOI] [PubMed] [Google Scholar]
- 25.Vahdat AM, Reiners KS, Simhadri VL, Eichenauer DA, Böll B, Chalaris A, Simhadri VR, Wiegmann K, Krell HW, Rose-John S, Engert A, von Strandmann EP, Hansen HP. TNF-alpha-converting enzyme (TACE/ADAM17)-dependent loss of CD30 induced by proteasome inhibition through reactive oxygen species. Leukemia. 2010;24:51–57. doi: 10.1038/leu.2009.230. [DOI] [PubMed] [Google Scholar]
- 26.Reddy P, Slack JL, Davis R, Cerretti DP, Kozlosky CJ, Blanton RA, Shows D, Peschon JJ, Black RA. Functional analysis of the domain structure of tumor necrosis factor-alpha converting enzyme. J Biol Chem. 2000;275:14608–14614. doi: 10.1074/jbc.275.19.14608. [DOI] [PubMed] [Google Scholar]
- 27.Kirschke S, Ogunsulire I, Selvakumar B, Schumacher N, Sezin T, Rose-John S, Scheffold A, Garbers C, Lokau J. The metalloprotease ADAM10 generates soluble interleukin-2 receptor alpha (sCD25) in vivo. J Biol Chem. 2022;298:101910. doi: 10.1016/j.jbc.2022.101910. [DOI] [PMC free article] [PubMed] [Google Scholar]
- 28.Orme JJ, Jazieh KA, Xie T, Harrington S, Liu X, Ball M, Madden B, Charlesworth MC, Azam TU, Lucien F, Wootla B, Li Y, Villasboas JC, Mansfield AS, Dronca RS, Dong H. ADAM10 and ADAM17 cleave PD-L1 to mediate PD-(L)1 inhibitor resistance. Oncoimmunology. 2020;9:1744980. doi: 10.1080/2162402x.2020.1744980. [DOI] [PMC free article] [PubMed] [Google Scholar]
Associated Data
This section collects any data citations, data availability statements, or supplementary materials included in this article.