Abstract
Immune checkpoint blockade (ICB) of the programmed cell death 1/programmed cell death ligand 1 (PD-1/PD-L1) immune checkpoint pathway has led to unprecedented advances in cancer therapy. However, the overall response rate of anti-PD-1/PD-L1 monotherapy is still unpromising, underscoring the need for predictive biomarkers. In this retrospective study, we collected pretreatment plasma samples from two independent cohorts of patients receiving ICB. To determine whether a signature of plasma cytokines could be associated with therapeutic efficacy, we systemically profiled cytokine clusters and functional groups in the discovery and validation datasets by using 59 multiplexed bead immunoassays and bioinformatics analysis. We first attempted to functionally classify the 59 immunological factors according to their biological classification or functional roles in the cancer-immunity cycle. Surprisingly, we observed that two signatures, the “checkpoint signature” and “trafficking of T-cell signature”, were higher in the response subgroup than in the nonresponse subgroup in both the discovery and validation cohorts. Moreover, enrichment of the “checkpoint signature” was correlated with improved overall survival and progression-free survival in both datasets. In addition, we demonstrated that increased baseline levels of three checkpoint molecules (PD-L1, T-cell immunoglobulin mucin receptor 3 and T-cell-specific surface glycoprotein CD28) were common peripheral responsive correlates in both cohorts, thus rendering this “refined checkpoint signature” an ideal candidate for future verification. In the peripheral blood system, the “refined checkpoint signature” may function as a potential biomarker for anti-PD-1/PD-L1 monotherapy in gastrointestinal (GI) cancers.
Supplementary information
The online version contains supplementary material available at (10.1007/s00262-021-02878-8).
Keywords: Immune checkpoint blockade, Predictive biomarker, Cytokine, Programmed cell death ligand 1, Biomarker
Introduction
There has been a major breakthrough in the field of immune checkpoint blockade (ICB) therapy in multiple cancer types in the last decade, but only a minority of patients derive a significant response to single-agent anti-programmed cell death 1/programmed cell death ligand 1 (anti-PD-1/PD-L1) antibodies, ranging from 10–40% [1, 2]. Therefore, great efforts have been dedicated to identifying predictors of the response or resistance to ICB immunotherapy [3]. In particular, the first candidate biomarker, PD-L1 protein expression, has been successfully applied to help stratify lung cancer and melanoma patients for ICB immunotherapy in many clinical trials [4]. Microsatellite instability (MSI) has been demonstrated to predict the response of solid tumors [5]. More recent biomarker candidates include genomic features such as tumor mutational burden (TMB) and copy number alteration (CNA) [6], the RNA signature of gene expression profiling (GEP) [7] and tumor infiltrating immune cells (TILs) using multiplex immunohistochemistry/ immunofluorescence (mIHC/IF) [8]. While the results have been satisfactory, all these biomarkers require tissue biopsy and still need to be validated in larger independent cohorts across different cancer types to assess their general applicability.
Notably, the ability to analyse “responsive features” through peripheral blood samples has displayed distinct advantages, especially in the absence of a tissue specimen. Cytokines are a broad category of small proteins that allow components of the immune system to communicate with one another to generate a coordinated, robust, but self-limited response [9]. Considering the ability of the immune system to recognize and attack cancer cells, there has been considerable interest in characterizing the predictive value of cytokines for cancer. Clinical data have revealed that simultaneous immunostimulation and immunosuppression occur in patients with advanced-stage cancer, with increased concentrations of the cytokines tumor necrosis factor α (TNFα), macrophage migration inhibitory factor (MIF), transforming growth factor β (TGFβ), interleukin 18 (IL18) and IL8 [10]. Importantly, correlations of circulating immunological factors, such as chemokines, cytokines and soluble immune checkpoint molecules, with the immune response have also been reported in lung cancer, melanoma and gastrointestinal (GI) cancers [11–14]. However, there are currently no validated peripheral biomarkers that can identify potential responders to anti-PD-1/PD-L1 immunotherapy in gastrointestinal cancers.
Indeed, cytokines usually exhibit the properties of pleiotropy, synergy, redundancy and cascade, in which one cytokine can act on various types of cells and different cytokines may exert the same functional effects [9, 15]. Hence, these peripheral factors may function in an integrated pattern in response to checkpoint blockade. We hypothesized that the pattern of cytokine covariation, designated as the immunological signature, may uncover novel biomarkers that can be used to predict the response to immune checkpoint inhibitor (ICI) immunotherapy.
In the current study, we recruited two independent cohorts of cancer patients. The baseline levels of 59 systematic immunological factors in the plasma samples of all patients were quantified. Individual cytokine expression and cytokine signatures were analyzed and correlated to the efficacy of ICB treatment. Notably, in the GI cancer discovery cohort, high baseline levels of the “checkpoint signature” and “trafficking of T-cell signature” were associated with an increased overall response rate (ORR) and improved prognosis. The predictive and prognostic values of these two signatures were further validated in an independent external GI cancer cohort.
Materials and methods
Patients and study design
The present investigation contained two independent cohorts. The discovery cohort was recruited from the Department of GI Oncology, The Fifth Medical Center, General Hospital of PLA. This study was approved by the Internal Review and the Committee of the Fifth Medical Center, General Hospital of the PLA and was performed in accordance with the Declaration of HELSINKI. The validation GI cohort was recruited from Zhongshan Hospital Affiliated to Fudan University, after the approval of Ethics Committee of Zhongshan Hospital Affiliated to Fudan University. All patients who failed or did not tolerate standard treatments were treated with anti-PD-1/PD-L1 monotherapy. Informed consent was obtained from each patient before sample collection.
Sample collection and multiplexed bead immunoassays
Plasma samples were collected before anti-PD-1/PD-L1 treatment. To isolate plasma, EDTA-anticoagulated whole blood samples were centrifuged (1000 × g, 15 min). A total of 59 immunological factors were simultaneously measured in plasma samples using the 45-ProcartaPlex Human Cytokine/Chemokine/Growth Factor Panel (Affymetrix, Inc., Santa Clara, CA, USA) and the 14-ProcartaPlex Human Immuno-Oncology Checkpoint Panel (Affymetrix, Inc.). To define potential “cytokine signatures” in the plasma, the 59 peripheral immune factors were classified into different subgroups according to their biological characterization (e.g., growth factors, chemokines, interferons, colony stimulatory factors, checkpoints) and immune functions (e.g., priming and activation, antigen presentation, trafficking of T-cells). After log2 transformation of the concentration value, a signature score was calculated by averaging the included cytokines. A detailed list of all detected cytokines and immune checkpoint molecules was presented in Supplementary Table S1.
Statistical analysis
Quantitative variables were presented as the mean ± standard deviation (SD). To determine differences between two subgroups of normally or nonnormally distributed quantitative variables, Student’s t-test and the Mann–Whitney U-test were performed, respectively. For categorical variables, which were presented as proportions, the chi-square test was used. Overall survival (OS) and progression-free survival (PFS) analyses were performed using the Kaplan–Meier method and log-rank test. Statistical analyses were conducted with SPSS 22.0 software (IBM, Armonk, NY, USA).
Results
Patient characteristics
The study included a total of 112 patients: 82 in the discovery cohort (mainly were GI cancers) and 30 in the validation cohort (GI cancers) (Fig. S1). The baseline and treatment characteristics of all participants were summarized in Table 1. All patients were treated with anti-PD-1 or anti-PD-L1 monotherapy from different clinical trials. ICB responders (complete response [CR] + partial response [PR]) and nonresponders (stable disease [SD] + progressive disease [PD]) were identified by using imaging studies or physical examinations according to the Response Evaluation Criteria in Solid Tumors (RECIST) v1.1.
Table 1.
Baseline characteristics
| Factor | Discovery cohort (n = 82) | Validation cohort (n = 30) |
|---|---|---|
| Age | ||
| Median (range) | 44 (21.0–70.0) | 54 (31.0–71.0) |
| < 60 | 61 (74.4%) | 18 (60.0%) |
| ≥ 60 | 21 (25.6%) | 12 (40.0%) |
| Sex | ||
| Male | 57 (69.5%) | 20 (66.7%) |
| Female | 25 (30.5%) | 10 (33.3%) |
| Cancer type | ||
| Gastric cancer (GC) | 2 (2.43%) | 9 (30.0%) |
| Colorectal cancer (CRC) | 10 (12.2%) | 11 (36.7%) |
| Esophageal cancer (EC) | 21 (25.6%) | 6 (20.0%) |
| Hepatocellular carcinoma (HCC) | 19 (23.2%) | 0 (0%) |
| Intrahepatic cholangiocarcinoma (ICC) | 3 (3.66%) | 0 (0%) |
| Neuroendocrine tumor (NET)/Neuroendocrine carcinoma (NEC) | 15 (18.3%) | 4 (13.3%) |
| Other | 11 (14.6%) | 0 (0%) |
| Treatment option | ||
| Anti-PD-1 therapy | 56 (68.3%) | 23 (76.7%) |
| Anti-PD-L1 therapy | 26 (31.7%) | 7 (23.3%) |
| Best response | ||
| Complete response | 0 (0%) | 2 (6.7%) |
| Partial response | 21 (25.6%) | 10 (33.3%) |
| Stable disease | 23 (28.0%) | 7 (23.3%) |
| Progressive disease | 38 (46.3%) | 11 (36.7%) |
Peripheral immune signatures predict the response to ICB in the discovery cohort
To identify peripheral immunological signatures associated with the response to anti-PD-1/PD-L1 therapy, a set of baseline plasma samples from 82 patients with multiple types of cancer was used as the discovery dataset. We first attempted to functionally characterize the 59 immunological factors (Table S1) according to their biological classification (e.g., interferons, chemokines, colony stimulating factors, growth factors, interleukins, tumor necrosis factors and checkpoint molecules), functional roles in the cancer-immunity cycle (e.g., antigen presentation, priming and activation, trafficking of T-cells, infiltration of T-cells into tumors and killing of cancer cells) [16] and cytokine subclasses (Th1, Th2, Th17 and Th9/Th17/Th22/Treg cytokines).
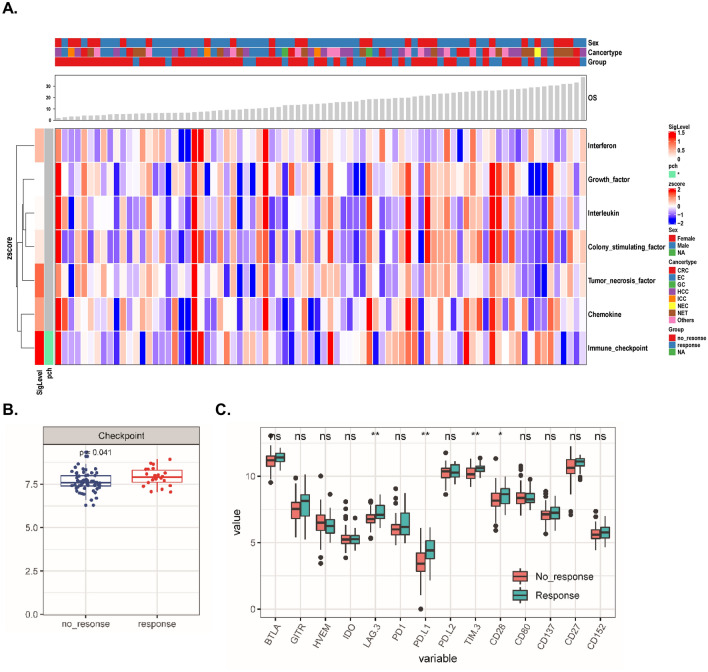
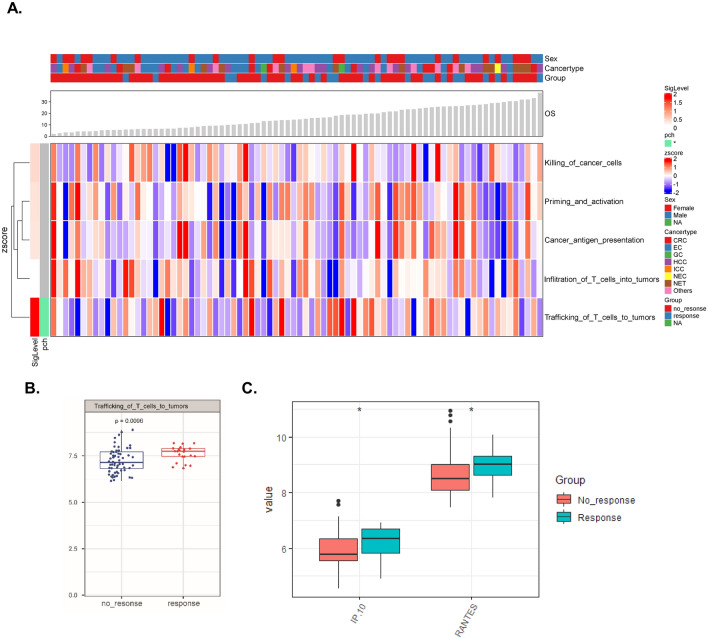
Next, we compared the expression levels of cytokines as well as various types of immunological signatures (Figs. 1, 2, S2, S3) between the response and nonresponse subgroups. Interestingly, we identified two signatures, the “checkpoint signature” included 14 soluble molecules: BTLA, IDO, LAG-3, PD1, PD-L1, PD-L2, TIM-3, CD152, GITR, HVEM, CD28, CD80, CD137, CD27 (Fig. 1a, b, P < 0.05) and the “trafficking of T-cell signature” (Fig. 2a, b, P < 0.01), that were elevated in the response subgroup compared to the nonresponse subgroup. However, no statistically significant alterations in the Th1, Th2, Th17 or Th9/Th17/Th22/Treg-related cytokines were observed (Fig. S3).
Fig. 1.
Classification and exploration of cytokine clusters in the discovery cohort. a Complex heatmap demonstrating the pattern of different cytokine clusters in the response and nonresponse subgroups (the definitions of cytokine clusters were summarized in Table S1). b Levels of the “checkpoint signature” in both subgroups. c The value (log2 transformed) of each cytokine belonging to the “checkpoint signature” in both subgroups was compared. *P < 0.05, **P < 0.01
Fig. 2.
Functional characterization of cytokine signatures in the discovery cohort. a Complex heatmap demonstrating the pattern of different functional cytokine signatures in the response and nonresponse subgroups (the definition of functional cytokine signatures was summarized in Table S1). b Levels of the “trafficking of T-cells into the tumor signature” in both subgroups. c The value (log2 transformed) of each cytokine belonging to the “trafficking of T-cells into the tumor signature” in both subgroups was compared. *P < 0.05
Moreover, we explored which cytokine was responsible for the upregulated immunological signatures in potential responders to ICB immunotherapy (Fig. S2). Four of the 14 detected plasma immune checkpoint molecules (BTLA, IDO, LAG-3, PD1, PD-L1, PD-L2, TIM-3, CD152, GITR, HVEM, CD28, CD80, CD137, CD27) were expressed at a higher level in the plasma samples from responders than from nonresponders (Fig. 1c). Concerning the “trafficking of T-cell signature”, both C–X–C motif chemokine 10 (CXCL10/IP10) and C–C motif chemokine 5 (CCL5/RANTES) levels were higher in the response subgroup than in the nonresponse subgroup (Fig. 2c).
Correlation between baseline immunological signatures and clinic outcome in the discovery cohort
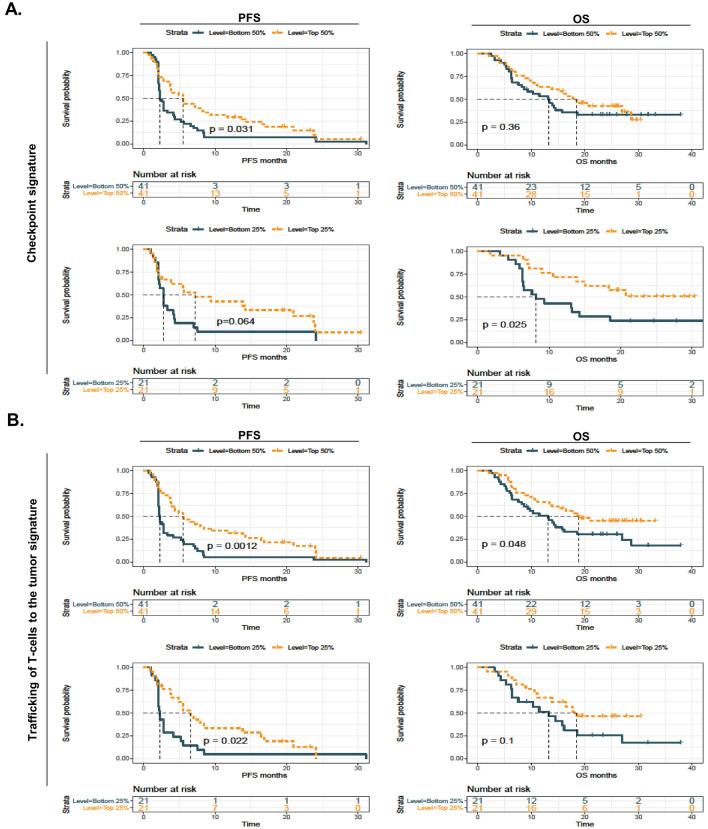
To determine the prognostic value of the two potential immunological signatures in the discovery cohort, we performed Kaplan–Meier estimator (Fig. 3) and multivariate survival (Fig. S4) analyses. As expected, high (top 50%) plasma levels of the “checkpoint signature” (Fig. 3a, upper panel) and the “trafficking of T-cell signature” (Fig. 3b, upper panel) were associated with prolonged PFS and OS, although the stratification power of the “checkpoint signature” for the OS curve did not attain statistical significance. When using the quartile cutoff point, we identified that high levels of the “checkpoint signature” were associated with improved OS (Fig. 3a, lower panel), and high levels of the “trafficking of T-cell signature” were correlated with prolonged PFS (Fig. 3b, lower panel). Moreover, the multivariate Cox proportional hazards analysis for PFS indicated that the two signatures were independent protective factors when adjusting for age, sex, cancer type and treatment (Fig. S4, P < 0.05 for both comparisons). Furthermore, our data revealed that the ORR was better in patients with high levels of the “checkpoint signature” or the “trafficking of T-cell signature” than in patients with low levels of these signatures (Fig. S5, median value as the cutoff point, Fisher’s test, P < 0.05 and P < 0.01, respectively).
Fig. 3.
High cytokine signature levels correlate with improved survival in the discovery cohort. a Kaplan–Meier (KM) survival analysis was used to compare progression-free survival (PFS, left panel) and overall survival (OS, right panel) in the “checkpoint signature”-high and -low subgroups when using different cutoff points (median or quartile). b KM survival analysis was used to compare PFS (left panel) and OS (right panel) in the “trafficking of T-cells into the tumor signature”-high and -low subgroups when using different cutoff points (median or quartile)
Confirmation of the immunological signatures in an external validation cohort
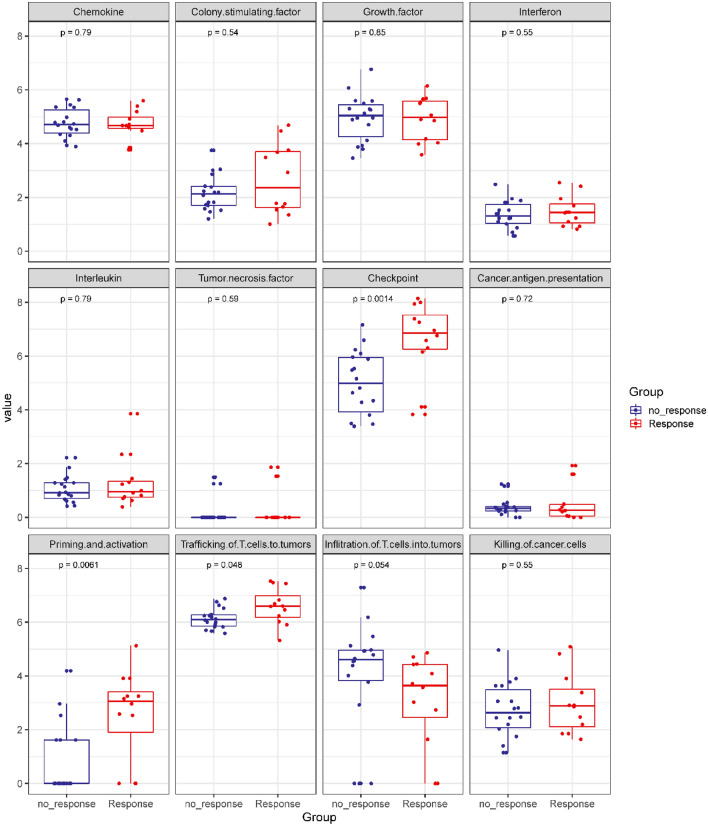
Aiming to validate the predictive and prognostic values of the two candidate immunological signatures, we subsequently assessed the distribution pattern of all cytokines and signatures in an external GI cancer cohort of patients who received anti-PD-1/PD-L1 monotherapy (n = 30, Fig. S6, S7 and S8). Intriguingly, baseline levels of the “checkpoint signature”, “priming and activation signature” and “trafficking of T-cell signature” were higher in the responders than in the nonresponders (Fig. 4).
Fig. 4.
Boxplot demonstrating the pattern of different cytokine clusters or functional cytokine signatures in the response and nonresponse subgroups in the validation cohort
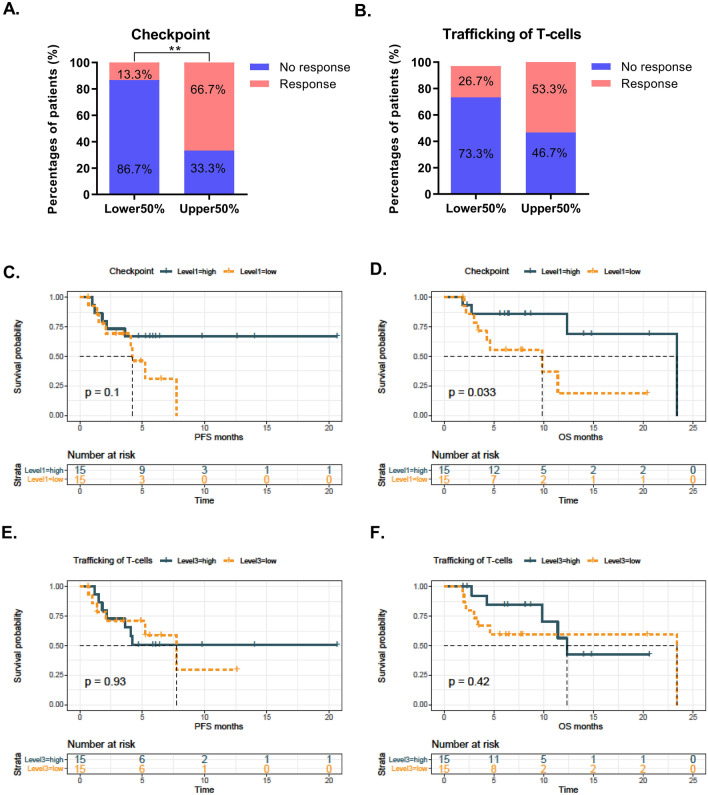
We then confirmed a remarkably higher ORR in patients with a higher “checkpoint signature” than in those with a lower “checkpoint signature” (Fig. 5a, 66.7% [10 of 15] vs. 13.3% [2 of 15], P < 0.01). Although a similar trend in the “trafficking of T-cell signatures” was observed (53.3% [8 of 15] vs. 26.7% [4 of 15]), the alteration did not attain statistical significance (Fig. 5b). In addition, Kaplan–Meier survival analysis revealed that a high “checkpoint signature” was associated with improved OS (log-rank test, P < 0.05) but not PFS (log-rank test, P > 0.05) (Fig. 5c, d). It should be noted that the median PFS of the high “checkpoint signature” subgroup was not attained, while the median PFS of the low “checkpoint signature” subgroup was less than 5 months, indicating that a larger sample size or adjustment of the cutoff point might be helpful to amplify its stratification power for PFS. However, no significant association between the “trafficking of T-cell signatures” and clinical outcome was identified (Fig. 5e, f).
Fig. 5.
Predictive and prognostic values of cytokine signatures in the validation cohort. a Overall response rate (ORR) in the “checkpoint signature”-high and -low subgroups. b ORR in the “trafficking of T-cell signature”-high and -low subgroups. c, d KM survival analysis was used to compare PFS (C) and OS (D) in the “checkpoint signature”-high and -low subgroups when using the median value as the cutoff point e, f. KM survival analysis was used to compare PFS (E) and OS (F) in the “trafficking of T-cells into the tumor signature”-high and -low subgroups when using the median value as the cutoff point. **P < 0.01
Refinement of the “checkpoint signature” and its performance in the two cohorts
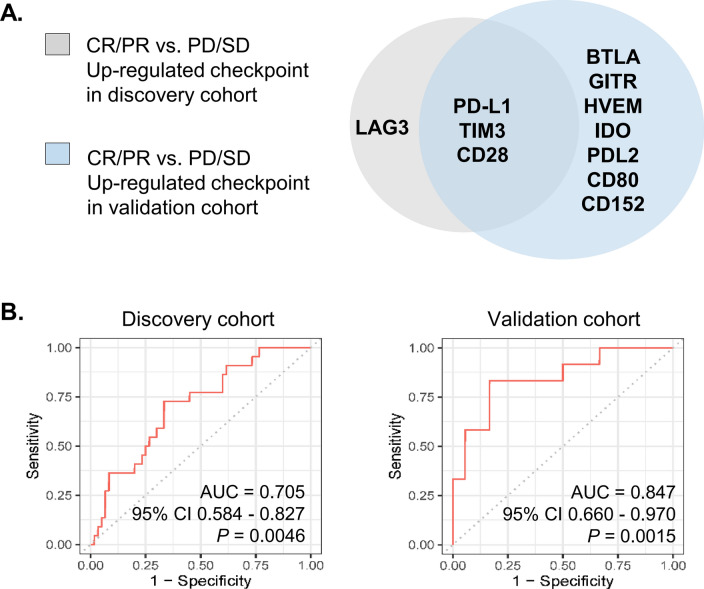
Next, we aimed to refine the “checkpoint signature” by comparing the deregulated plasma checkpoint molecules in both the discovery and validation cohorts. It should be noted that a number of checkpoint molecules (e.g., PD-L1, T-cell immunoglobulin mucin receptor 3 [TIM3], T-cell-specific surface glycoprotein CD28 [CD28], lymphocyte activation gene-3-protein [LAG3], B- and T-lymphocyte attenuator [BTLA] and cluster of differentiation 152 [CD152/CTLA4]) were enriched in responders to immunotherapy in either cohort. Venn diagram analysis revealed that increased baseline levels of three checkpoint molecules (PD-L1, TIM3 and CD28) were common peripheral responsive correlates in both cohorts (Fig. 6a). We therefore assessed the performance of the “refined 3-checkpoint signature” in predicting the response to monotherapy. Not unexpectedly, the AUC values for the “refined 3-checkpoint signature” in the discovery and validation cohorts were 0.705 (95% confidence interval [CI] 0.584–0.827, P = 0.0046) and 0.847 (95% CI 0.660–0.970, P = 0.0015), respectively (Fig. 6b). These observations indicate that the “3-checkpoint refined signature” is worthy of future exploration and further validation.
Fig. 6.
Refinement of checkpoint signature. a Three immune checkpoint molecules in the plasma (PD-L1, TIM3 and CD28) were upregulated in responders in both cohorts. A signature score was applied to quantify “the refined signature” (PD-L1, TIM3 and CD28) by averaging the included checkpoint molecules after log2 transformation of the concentration value. b Receiver operating characteristic (ROC) curve analyses of the refined signature score in the response (CR/PR) and nonresponse (SD/PD) subgroups in the discovery and validation cohorts, respectively.
Discussion
Cytokines are potent but complex immune mediators [17]. An essential characteristic of cytokine signaling is its degree of redundancy, in which multiple cytokines may exert overlapping activities [9]. For instance, type I interferons (IFNs), IFN-α and IFN-β, have multiple antitumor properties, including tumor cell killing and stimulating dendritic cells (DCs) and CD8 + T-cells [18, 19]. We therefore hypothesized that a group of cytokines, termed the peripheral immune signature, might function synergistically. In the present investigation, we identified that high baseline levels of the “checkpoint signature” in the plasma are predictive of the clinical response in cancer patients treated with anti-PD-1/PD-L1 monotherapy.
Individual peripheral immunological factors, including cytokines, chemokines and soluble immune checkpoint molecules, have been correlated with the response to ICB immunotherapy in different cancer types. Specifically, in a cohort of ipilimumab-treated small cell lung cancer (SCLC) patients, a high level of IL-8 and a low level of IL-2 at baseline were associated with a poor prognosis [11]. A correlation between the serum levels of soluble immune checkpoint molecules and the efficiency of immunotherapy in melanoma has also been identified [12]. Interestingly, here, we showed that the clinical response to immunotherapy in GI cancers may be associated with a cluster of plasma immune checkpoint molecules, including PD-L1, CD28, TIM3, LAG3 and CTLA4/CD152. Specifically, a higher response rate and better prognosis were identified in the “checkpoint signature”-high subgroup compared with the “checkpoint signature”-low subgroup in both the discovery and validation cohorts (Figs. 1, 3, 4). Collectively, our data indicate that the systemic “checkpoint signature” in the plasma may function as a novel predictive biomarker for anti-PD-1/PD-L1 therapy in GI cancers.
In the immune system, checkpoints can be classified into two subgroups: stimulatory molecules, such as CD28 and CD137, and inhibitory molecules, such as PD-L1, TIM3, CTLA-4 and LAG3 [20]. Notably, our data suggest that both stimulatory and inhibitory molecules may be correlated with the clinical response, since high plasma levels of PD-L1, TIM3 and CD28 were identified in responders in both cohorts (Fig. 6a). Indeed, researchers have reported the varied functions of these soluble receptors and ligands in the immune system. For instance, soluble PD-L1 (sPD-L1) can be produced and released by tumor cells and activated mature DCs (mDCs), while immature DCs and T-cells are refractory to releasing sPD-L1 [21]. Moderate pretreatment levels of sPD-L1 may indicate existing antitumor immune responses in some patients [22]. Soluble CD28 (sCD28) is one form of CD28 in the peripheral blood, and engagement of the sCD28 protein and CD80/CD86 molecules expressed on DCs could induce the secretion of IL-6 [23]. In leukemia, soluble TIM-3 prevents the secretion of interleukin-2 (IL-2), which is required for the activation of cytotoxic lymphoid cells [24]. However, the underlying mechanism by which the peripheral “checkpoint signature” correlates with the immune response remains largely unknown.
In conclusion, this study profiled the plasma levels of 59 peripheral immunological factors in two independent cohorts of patients with gastrointestinal cancers receiving anti-PD-1/PD-L1 monotherapy. We found that increased prior-to-treatment levels of the “checkpoint signature” in the plasma were associated with an improved clinical response and prognosis, indicating a pre-existing immune “responsive feature” in the peripheral blood sample. Future mechanistic and clinical studies would be helpful to expand the utility of the novel biomarker.
Supplementary information
Below is the link to the electronic supplementary material.
Abbreviations
- anti-PD-1
Anti-programmed cell death 1
- BTLA
B- and T-lymphocyte attenuator
- CNA
Copy number alteration
- CD152
Cluster of differentiation 152
- CR
Complete response
- GEP
Gene expression profiling
- GI
Gastrointestinal
- ICB
Immune checkpoint blockade
- ICI
Immune checkpoint inhibitor
- IF
Immunofluorescence
- IFNs
Interferons; DCs, dendritic cells
- IL18
Interleukin 18
- IL-2
Interleukin-2
- LAG3
Lymphocyte activation gene-3-protein
- mDCs
Mature DCs
- MIF
Migration inhibitory factor
- mIHC
Multiplex immunohistochemistry
- MSI
Microsatellite instability
- ORR
Overall response rate
- OS
Overall survival
- PD
Progressive disease
- PD-L1
Programmed cell death ligand 1
- PFS
Progression-free survival
- PR
Partial response
- RECIST
Response Evaluation Criteria in Solid Tumors
- sCD28
Soluble CD28
- SCLC
Small cell lung cancer
- SD
Standard deviation
- SD
Stable disease
- sPD-L1
Soluble PD-L1
- TGFβ
Transforming growth factor β
- TILs
Tumor infiltrating immune cells
- TIM3
T-cell immunoglobulin mucin receptor 3
- TMB
Tumor mutational burden
- TNFα
Tumor necrosis factor α
Funding
This work was supported by grant from the National Key Sci-Tech Special Project of China (No. 2018ZX10302207).
Data availability
All data generated or analyzed during this study are included in this article [and its supplementary information files].
Compliance with ethical standards
Conflicts of interest
The authors declare that they have no conflict of interest.
Ethical approval
This study was approved by the Internal Review and the Committee of the Fifth Medical Center, General Hospital of the PLA, Ethics Committee of Zhongshan Hospital Affiliated to Fudan University and was performed in accordance with the Declaration of HELSINKI.
Consent to participate
Informed consent was obtained from each patient before sample collection.
Consent for publication
We declare that this manuscript is original, has not been published before, and is not currently under consideration for publication elsewhere.
Footnotes
Publisher's Note
Springer Nature remains neutral with regard to jurisdictional claims in published maps and institutional affiliations.
Chuanhua Zhao, Lihong Wu and Dandan Liang contributed equally to this manuscript.
Contributor Information
Yiyi Yu, Email: flame520@hotmail.com.
Henghui Zhang, Email: zhhbao@ccmu.edu.cn.
Jianming Xu, Email: jmxu2003@yahoo.com.
References
- 1.Sharma P, Hu-Lieskovan S, Wargo JA, Ribas A. Primary, adaptive, and acquired resistance to cancer immunotherapy. Cell. 2017;168(4):707–723. doi: 10.1016/j.cell.2017.01.017. [DOI] [PMC free article] [PubMed] [Google Scholar]
- 2.Kim TK, Herbst RS, Chen L. Defining and understanding adaptive resistance in cancer immunotherapy. Trends Immunol. 2018;39(8):624–631. doi: 10.1016/j.it.2018.05.001. [DOI] [PMC free article] [PubMed] [Google Scholar]
- 3.Havel JJ, Chowell D, Chan TA. The evolving landscape of biomarkers for checkpoint inhibitor immunotherapy. Nat Rev Cancer. 2019 doi: 10.1038/s41568-019-0116-x. [DOI] [PMC free article] [PubMed] [Google Scholar]
- 4.Gong J, Chehrazi-Raffle A, Reddi S, Salgia R. Development of PD-1 and PD-L1 inhibitors as a form of cancer immunotherapy: a comprehensive review of registration trials and future considerations. J Immunother cancer. 2018;6(1):1–18. doi: 10.1186/s40425-018-0316-z. [DOI] [PMC free article] [PubMed] [Google Scholar]
- 5.Le DT, Durham JN, Smith KN, Wang H, Bartlett BR, Aulakh LK, Diaz LA. Mismatch repair deficiency predicts response of solid tumors to PD-1 blockade. Science. 2017;357(6349):409–413. doi: 10.1126/science.aan6733. [DOI] [PMC free article] [PubMed] [Google Scholar]
- 6.Havel JJ, Chowell D, Chan TA. The evolving landscape of biomarkers for checkpoint inhibitor immunotherapy. Nat Rev Cancer. 2019;19(3):133–150. doi: 10.1038/s41568-019-0116-x. [DOI] [PMC free article] [PubMed] [Google Scholar]
- 7.Cristescu R, Mogg R, Ayers M, Albright A, Murphy E, Yearley J, Sher X. Pan-tumor genomic biomarkers for PD-1 checkpoint blockade-based immunotherapy. Science. 2018 doi: 10.1126/science.aar3593. [DOI] [PMC free article] [PubMed] [Google Scholar]
- 8.Gettinger SN, Choi J, Mani N, Sanmamed MF, Datar I, Sowell R, Du VY, Kaftan E, Goldberg S, Dong W, Zelterman D, Politi K, Kavathas P, Kaech S, Yu X, Zhao H, Schlessinger J, Lifton R, Rimm DL, Chen L, Herbst RS, Schalper KA. A dormant TIL phenotype defines non-small cell lung carcinomas sensitive to immune checkpoint blockers. Nat Commun. 2018;9(1):3196. doi: 10.1038/s41467-018-05032-8. [DOI] [PMC free article] [PubMed] [Google Scholar]
- 9.Lee S, Margolin K. Cytokines in cancer immunotherapy. Cancers. 2011;3(4):3856–3893. doi: 10.3390/cancers3043856. [DOI] [PMC free article] [PubMed] [Google Scholar]
- 10.Lippitz BE. Cytokine patterns in patients with cancer: a systematic review. Lancet Oncol. 2013;14(6):e218–228. doi: 10.1016/s1470-2045(12)70582-x. [DOI] [PubMed] [Google Scholar]
- 11.Hardy-Werbin M, Rocha P, Arpi O, Taus A, Nonell L, Duran X, Villanueva X, Joseph-Pietras D, Nolan L, Danson S, Griffiths R, Lopez-Botet M, Rovira A, Albanell J, Ottensmeier C, Arriola E. Serum cytokine levels as predictive biomarkers of benefit from ipilimumab in small cell lung cancer. Oncoimmunology. 2019;8(6):e1593810. doi: 10.1080/2162402x.2019.1593810. [DOI] [PMC free article] [PubMed] [Google Scholar]
- 12.Leung AM, Lee AF, Ozao-Choy J, Ramos RI, Hamid O, O'Day SJ, Shin-Sim M, Morton DL, Faries MB, Sieling PA, Lee DJ. Clinical benefit from ipilimumab therapy in melanoma patients may be associated with serum CTLA4 levels. Frontiers in oncology. 2014;4:110. doi: 10.3389/fonc.2014.00110. [DOI] [PMC free article] [PubMed] [Google Scholar]
- 13.Wang L, Wang H, Chen H, Wang WD, Chen XQ, Geng QR, Xia ZJ, Lu Y. Serum levels of soluble programmed death ligand 1 predict treatment response and progression free survival in multiple myeloma. Oncotarget. 2015;6(38):41228–41236. doi: 10.18632/oncotarget.5682. [DOI] [PMC free article] [PubMed] [Google Scholar]
- 14.Lu Z, Zou J, Hu Y, Li S, Zhou T, Gong J, Li J, Zhang X, Zhou J, Lu M, Wang X, Peng Z, Qi C, Li Y, Li J, Li Y, Zou J, Du X, Zhang H, Shen L. Serological markers associated with response to immune checkpoint blockade in metastatic gastrointestinal tract cancer. JAMA Netw Open. 2019;2(7):e197621. doi: 10.1001/jamanetworkopen.2019.7621. [DOI] [PMC free article] [PubMed] [Google Scholar]
- 15.Ozaki K, Leonard WJ. Cytokine and cytokine receptor pleiotropy and redundancy. J Biol Chem. 2002;277(33):29355–29358. doi: 10.1074/jbc.R200003200. [DOI] [PubMed] [Google Scholar]
- 16.Chen DS, Mellman I. Oncology meets immunology: the cancer-immunity cycle. Immunity. 2013;39(1):1–10. doi: 10.1016/j.immuni.2013.07.012. [DOI] [PubMed] [Google Scholar]
- 17.Berraondo P, Sanmamed MF, Ochoa MC, Etxeberria I, Aznar MA, Perez-Gracia JL, Rodriguez-Ruiz ME, Ponz-Sarvise M, Castanon E, Melero I. Cytokines in clinical cancer immunotherapy. Br J Cancer. 2019;120(1):6–15. doi: 10.1038/s41416-018-0328-y. [DOI] [PMC free article] [PubMed] [Google Scholar]
- 18.Siegal FP, Kadowaki N, Shodell M, Fitzgerald-Bocarsly PA, Shah K, Ho S, Antonenko S, Liu YJ. The nature of the principal type 1 interferon-producing cells in human blood. Science. 1999;284(5421):1835–1837. doi: 10.1126/science.284.5421.1835. [DOI] [PubMed] [Google Scholar]
- 19.Guo J, Xiao Y, Iyer R, Lu X, Lake M, Ladror U, Harlan J. Empowering therapeutic antibodies with IFN-alpha for cancer immunotherapy. Plos One. 2019;14(8):e0219829. doi: 10.1371/journal.pone.0219829. [DOI] [PMC free article] [PubMed] [Google Scholar]
- 20.Gu D, Ao X, Yang Y, Chen Z, Xu X. Soluble immune checkpoints in cancer: production, function and biological significance. J Immunother Cancer. 2018;6(1):132. doi: 10.1186/s40425-018-0449-0. [DOI] [PMC free article] [PubMed] [Google Scholar]
- 21.Frigola X, Inman BA, Krco CJ, Liu X, Harrington SM, Bulur PA, Dietz AB, Dong H, Kwon ED. Soluble B7–H1: differences in production between dendritic cells and T cells. Immunol Lett. 2012;142(1–2):78–82. doi: 10.1016/j.imlet.2011.11.001. [DOI] [PMC free article] [PubMed] [Google Scholar]
- 22.Zhou J, Mahoney KM, Giobbie-Hurder A, Zhao F, Lee S, Liao X, Rodig S, Li J, Wu X, Butterfield LH, Piesche M, Manos MP, Eastman LM, Dranoff G, Freeman GJ, Hodi FS. Soluble PD-L1 as a biomarker in malignant melanoma treated with checkpoint blockade. Cancer Immunol Res. 2017;5(6):480–492. doi: 10.1158/2326-6066.cir-16-0329. [DOI] [PMC free article] [PubMed] [Google Scholar]
- 23.Sun Z, Yi L, Tao H, Huang J, Jin Z, Xiao Y, Feng C, Sun J. Enhancement of soluble CD28 levels in the serum of Graves' disease. Cent-Eur J Immunol. 2014;39(2):216–222. doi: 10.5114/ceji.2014.43726. [DOI] [PMC free article] [PubMed] [Google Scholar]
- 24.Goncalves Silva I, Yasinska IM, Sakhnevych SS, Fiedler W, Wellbrock J, Bardelli M, Varani L, Hussain R, Siligardi G, Ceccone G, Berger SM, Ushkaryov YA, Gibbs BF, Fasler-Kan E, Sumbayev VV. The Tim-3-galectin-9 secretory pathway is involved in the immune escape of human acute myeloid leukemia cells. EBioMedicine. 2017;22:44–57. doi: 10.1016/j.ebiom.2017.07.018. [DOI] [PMC free article] [PubMed] [Google Scholar]
Associated Data
This section collects any data citations, data availability statements, or supplementary materials included in this article.
Supplementary Materials
Data Availability Statement
All data generated or analyzed during this study are included in this article [and its supplementary information files].


