Abstract
M2 tumor-associated macrophages (M2-TAMs) promote cancer cell proliferation and metastasis in the TME. Our study aimed to elucidate the mechanism of increased frequency of M2-TAMs infiltration in the colorectal cancer (CRC)-TME, focusing on the resistance to oxidative stress through nuclear factor erythroid 2-related factor 2 (Nrf2) pathway. In this study, we evaluated the correlation between M2-TAM signature and mRNA expression of antioxidant related genes using public datasets, and the expression level of antioxidants in M2-TAMs by flow cytometry and the prevalence of M2-TAMs expressing antioxidants by immunofluorescence staining using surgically resected specimens of CRC (n = 34). Moreover, we generated M0 and M2 macrophages from peripheral blood monocytes and evaluated their resistance to oxidative stress using the in vitro viability assay. Analysis of GSE33113, GSE39582, and The Cancer Genome Atlas (TCGA) datasets indicated that mRNA expression of HMOX1 (heme oxygenase-1 (HO-1)) was significantly positively correlated with M2-TAM signature (r = 0.5283, r = 0.5826, r = 0.5833, respectively). The expression level of both Nrf2 and HO-1 significantly increased in M2-TAMs compared to M1- and M1/M2-TAMs in the tumor margin, and the number of Nrf2+ or HO-1+M2-TAMs in the tumor stroma significantly increased more than those in the normal mucosa stroma. Finally, generated M2 macrophages expressing HO-1 significantly resisted to oxidative stress induced by H2O2 in comparison with generated M0 macrophages. Taken together, our results suggested that an increased frequency of M2-TAMs infiltration in the CRC-TME is related to Nrf2–HO-1 axis mediated resistance to oxidative stress.
Supplementary Information
The online version contains supplementary material available at 10.1007/s00262-023-03406-6.
Keywords: M2-TAM, HO-1, Colorectal cancer, Oxidative stress
Introduction
Immunotherapy targeting PD-1 axis has recently been a major therapeutic strategy for patients with high microsatellite instability metastatic colorectal cancer (CRC); however, the efficacy rate of this treatment is approximately 30–60% [1, 2]. A reason for the limited efficacy is the immunosuppressive mechanisms in the CRC-TME, including the infiltration of immunosuppressive cells such as myeloid-derived suppressor cells, Treg cells, and M2 tumor-associated macrophages (M2-TAMs) [3–5]. In particular, M2-TAMs interfere with the function of cytotoxic T lymphocytes, produce immune suppressive cytokines such as IL-10 and TGF-β, and accelerate tumor growth, activity of Treg cells, angiogenesis, and epithelial-mesenchymal transition of tumor cells [6–12]. Thus, M2-TAMs are one of the key immunosuppressive cells and affect cancer cell proliferation and metastasis. Yu et al. recently reported that hepatic metastasis is strongly related to increase the M2-like gene signature score in mouse monocyte-derived macrophages [13], confirming that importance of M2-TAMs in the TME.
Among the cells existing in the TME, tumor cells, activated granulocytes, myeloid-derived suppressor cells, and TAMs produce significant amounts of reactive oxygen species (ROS) such as hydrogen peroxide (H2O2), superoxide, and nitric oxide [14–16]. It is well established that ROS induce apoptosis of natural killer cells and effector memory CD8+ T cells [17, 18]. In contrast, Mougiakakos et al. reported that Treg cells, which are key immunosuppressive cells in the TME, were less sensitive to H2O2-induced apoptosis compared to conventional CD4+ T cells [19]. Furthermore, we previously reported that the increased frequency of Treg cells infiltration in the TME of gastric cancer and esophageal squamous cell carcinoma was closely associated with their low sensitivity to H2O2-induced apoptosis [20].
Nuclear factor erythroid 2-related factor 2 (Nrf2) is a transcriptional factor that activates cellular antioxidant response [21]. Nrf2 generally binds to Kelch-like ECH-associating protein 1 in the cytoplasm, but under oxidative stress Nrf2 is separated from it and translocates into the nucleus, and then binds to the antioxidant response element, resulting in the production of antioxidants such as heme oxygenase-1 (HO-1), thioredoxin reductase 1 (TrxR1), glutathione, nicotinamide adenine dinucleotide phosphate hydrogen, and quinone oxidoreductases (NQO1) [21]. Increased cells in the TME under conditions of oxidative stress may produce a large amount of antioxidants through the Nrf2 pathway, and Treg cells were reported to produce a large amount of TrxR1 [19].
We recently reported a significant increase in the frequency of CD163+M2-TAMs infiltration in the CRC tumor stroma [22]. Furthermore, Consonni et al. also reported that HO-1+CD163+TAMs preferentially localized at the invasive margin of malignant melanoma [23]. However, the mechanism of this enrichment is not fully elucidated, and we postulated that the resistance to oxidative stress of CD163+M2-TAMs may be one of the mechanisms of their selective enrichment in the CRC-TME. Therefore, in this study, we investigated the resistance to oxidative stress mediated the Nrf2 pathway in M2-TAMs in the CRC-TME using the public database and surgically resected specimens of CRC. Furthermore, we generated M2 macrophages from peripheral blood monocytes in vitro and evaluated their resistance to ROS.
Materials and methods
Analysis of microarray and RNA-sequencing datasets
In this study, we used three datasets of CRC including GSE33113, GSE39582, and The Cancer Genome Atlas (TCGA) [24]. For GSE33113 and GSE39582 datasets that analyzed on Affymetrix microarray, normalized mRNA expression data of genes were downloaded from the Gene Expression Omnibus repository (http://www.ncbi.nlm.nih.gov/geo). For TCGA colorectal adenocarcinoma dataset (PanCancer Atlas), the RNA-sequencing data of genes were downloaded through cBioPortal (http://www.cbioportal.org/) [25]. We used samples containing all eight genes that constituted M2-TAM signature and calculated multi-gene expression signatures of M2-TAM in each dataset according to our previous paper (M2-TAM signature score) [22, 26]. We evaluated the correlation between the M2-TAM signature score and mRNA expression levels of HMOX1 (HO-1), TXNRD1 (TrxR1), NQO1 (NQO1), and HIF1A (hypoxia-inducible factor 1α (HIF-1α)), and between HMOX1 (HO-1) and HIF1A (HIF-1α) mRNA expression levels. To evaluate the correlation between hypoxia and M2-TAM signature score, mRNA expression level of HMOX1 (HO-1), we used the HALLMARK_Hypoxia (https://www.gsea-msigdb.org/gsea/msigdb/human/geneset/HALLMARK_HYPOXIA.html), which include 200 genes that response to hypoxia [27]
Patients
Thirty-four patients who underwent the resection of CRC at Fukushima Medical University Hospital between December 2020 and November 2021 were enrolled in this study. We excluded patients whose tumor diameter was less than 2 cm because we needed approximately 0.5–1 cm3 samples for flow cytometry analysis. Patients who had undergone preoperative treatment such as self-expanding metal stent, chemotherapy, and radiotherapy were also excluded as the stent induces local inflammation, and the preoperative chemotherapy and radiotherapy cause immune response in the TME [22, 28, 29].
Flow cytometry
The samples of normal mucosa and tumor margin from the fleshly resected surgical specimens (n = 34) were digested as previously described, and the collected cells from these samples were used for flow cytometry [22, 29]. Staining with following antibodies and fixation/permeabilization with FcR blocking (130-059-901; Miltenyi Biotec, Bergisch Gladbach, Germany) were performed according to the manufacturer’s preparation protocol. Antibodies for direct staining: APC/Cyanine7-conjugated anti-human CD14 mAb (mouse, clone HCD14, 325619; BioLegend, San Diego, CA, USA), PE/Cyanine7-conjugated anti-human CD163 mAb (mouse, clone GHI/61, 333613; BioLegend), PerCP/Cyanine5.5-conjugated anti-human CD11c mAb (mouse, clone 3.9, 301623; BioLegend), and Pacific Blue-conjugated annexin-V (R37177; Thermo Fisher Scientific, Waltham, MA, USA). Antibodies for intracellularly staining: APC-conjugated anti-human Nrf2 mAb (rabbit, clone EP1808Y, ab223927; abcam, Cambridge, UK) and PE-conjugated anti-human HO-1 mAb (mouse, clone HO-1–2, ab83214; abcam). The unstained sample was used as a negative control. The stained samples were measured using a BD FACS CantoII flow cytometer (BD Biosciences, San Jose, CA, USA), and the measured data were analyzed with FlowJo software version 10.5.3 (FlowJo, Ashland, OR, USA).
Immunofluorescence staining
The formalin-fixed paraffin-embedded whole tissue samples (n = 34) were used for staining, and images were obtained with following antibodies and evaluated according to our previous paper [22]. The primary antibodies: anti-human CD163 mAb (mouse, clone 10D6, NCL-L-CD163, 1:200; Leica biosystems, Newcastle upon Tyne, UK), anti-human HIF-1α mAb (rabbit, clone EP1215Y, ab51608, 1:500; abcam), Nrf2 mAb (rabbit, clone EP1808Y, ab62352, 1:250; abcam), HO-1 mAb (rabbit, clone EP1391Y, ab52947, 1:1000; abcam). The secondary antibodies: Alexa Fluor 488-conjugated anti-mouse polyclonal antibody (donkey, polyclonal, A-21202, 1:200; Thermo Fisher Scientific), Alexa Fluor 555-conjugated anti-rabbit polyclonal antibody (donkey, polyclonal, A-31572, 1:200; Thermo Fisher Scientific). The nuclei were stained with DAPI (D9542, 40 ng/ml; Sigma-Aldrich, St. Louis, MO, USA). CD163 was stained with green. HIF-1α, Nrf2, and HO-1 were stained with red, and DAPI was stained with blue.
Generation of human M2 macrophages
Monocytes were collected from peripheral blood of healthy volunteers using the Pan Monocyte Isolation Kit, human (Miltenyi Biotec) [22, 30]. The CD14-positive monocytes were cultured at 37℃ with 5% CO2 atmosphere in RPMI 1640 (Sigma-Aldrich) supplemented with 20 ng/ml of M-CSF (216-MC; R&D systems, Minneapolis, MN, USA), 10% heat-inactivated FBS, and penicillin/streptomycin for 6 days. After 6 days, we continued to culture the cells in the same medium for 3 days to generate M0 macrophages, while we added 20 ng/ml each of IL-4 (200–04; PeproTech, Rocky Hill, NJ, USA), IL-10 (200–10; PeproTech), and IL-13 (200–13; PeproTech) into the culture medium and continued to culture the cells for 3 days to generate M2 macrophages [31].
Viability assay
We used H2O2 (084–07441; Wako, Osaka, Japan) to induce the oxidative stress. H2O2 was diluted at several concentrations in RPMI 1640 and used within 5 min of preparation. The cells (5.0 × 10⁴) were cultured in 0.5 ml of RPMI 1640 with several concentrations of H2O2 in a 24-well tissue culture plate for 24 h at 37℃ with 5% CO2 atmosphere. Oxidative stress-induced cell death was evaluated by flow cytometry using 7-aminoactinomycin D (51–68981; BD Biosciences) and PE-conjugated annexin-V (51-65875X; BD Biosciences). The frequency of viable cells at 0 μM of H2O2 was used as a control.
Blocking assay
We purchased the THP-1 cell line, human monocytic cell line, from the Japanese Collection of Research Bioresources Cell Bank (Osaka, Japan) on 16/Feb/2021, and cultivated at 37℃ with 5% CO2 atmosphere in RPMI 1640 (Sigma-Aldrich) with 10% heat-inactivated FBS and penicillin/streptomycin. THP-1 cells and generated M2 macrophages were cultured with Nrf2 inhibitor (HY-101025; MedChemExpress, Monmouth Junction, NJ, USA) in culture medium for 48 h, and DMSO (Wako) was used as negative control and a vehicle.
Western blot
Western blot was performed with the following primary and secondary antibodies according to our previous paper [22]. The primary antibodies: Nrf2 mAb (rabbit, clone EP1808Y, ab62352, 1:1000; abcam), HO-1 mAb (rabbit, clone EP1391Y, ab52947, 1:2000; abcam), and β-actin mAb (mouse, clone AC-15, sc-69879, 1:10,000; Santa Cruz Biotechnology, Dallas, TX, USA). The secondary antibodies: horseradish peroxidase-linked anti-rabbit antibody (goat, polyclonal, #7074, 1:2000; Cell Signaling Technology, Danvers, MA, USA) or horseradish peroxidase-linked anti-mouse antibody (horse, polyclonal, #7076, 1:2000; Santa Cruz Biotechnology).
Statistical analysis
Statistical analyses were performed using Graphpad Prism 8 (Graphpad Software, La Jolla, CA, USA). Two groups were compared by the unpaired student’s t-test and multiple groups were compared by one-way analysis of variance followed by a Tukey's post hoc test. Spearman’s correlation coefficient was used to analyze the association between two groups, and significance was calculated with Fisher’s exact test. All error bars indicate mean ± standard deviation. A p-values less than 0.05 was considered to be significant.
Results
mRNA expression of HMOX1 (HO-1) was significantly positively correlated with M2-TAM signature
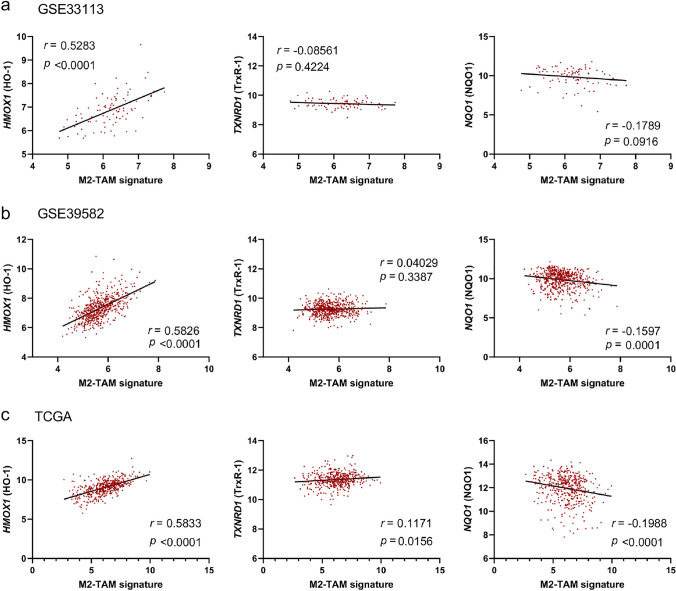
Previous papers have reported a significant increase in the frequency of CD163+TAMs infiltration in the TME [22, 23]. To evaluate the mechanism of this enrichment, we first evaluated the correlation between M2-TAM signature and mRNA expression of antioxidant related genes such as HMOX1 (HO-1), TXNRD1 (TrxR1), and NQO1 (NQO1) using public dataset [22, 26]. Analysis of three CRC datasets (GSE33113, GSE39582, and TCGA) showed that mRNA expression of HMOX1 (HO-1) was significantly positively correlated with M2-TAM signature (r = 0.5283, p < 0.0001; r = 0.5826, p < 0.0001; r = 0.5833, p < 0.0001, respectively) (Fig. 1a-c). On the other hand, there were no correlations between M2-TAM signature and mRNA expression of TXNRD1 (TrxR1) or NQO1 (NQO1) (Fig. 1a-c). Therefore, we focused on the expression of HO-1 as an antioxidant in M2-TAMs to investigate a mechanism of their selective enrichment in the CRC-TME in the following experiments.
Fig. 1.
Expression of antioxidant related genes in M2-TAMs. The correlation of mRNA expression of each HMOX1 (HO-1), TXNRD1 (TrxR1), and NQO1 (NQO1) with M2-TAM signature in GSE33113 dataset (n = 90) (a), GSE39582 (n = 566) (b), TCGA (n = 426) (c)
M2-TAMs in the CRC-TME expressed Nrf2 and HO-1
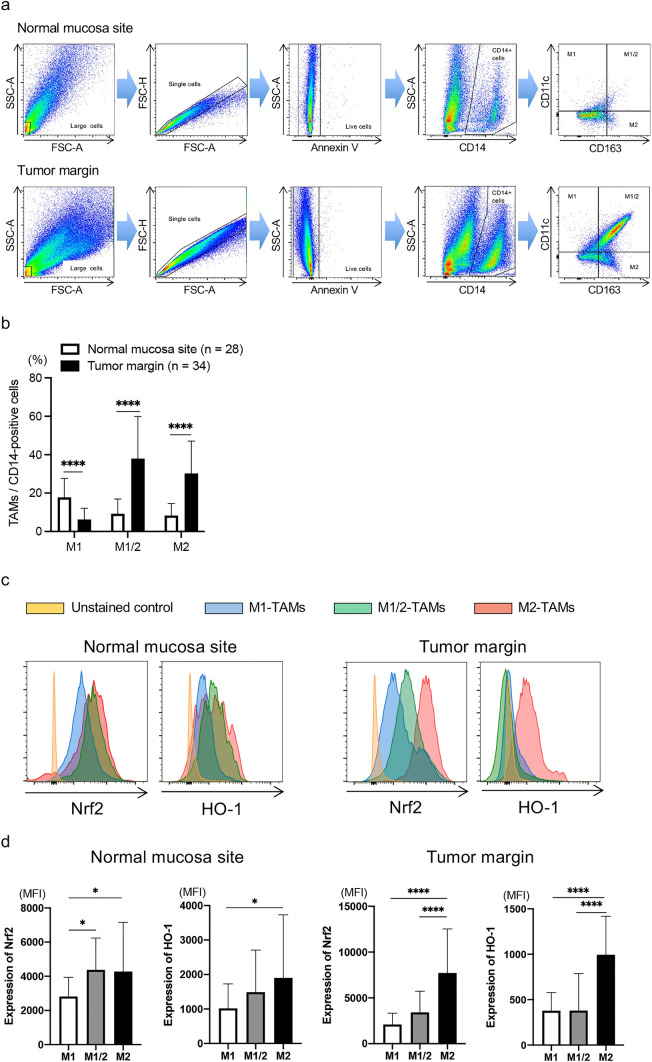
We evaluated the frequency of TAMs infiltration in the CRC-TME by flow cytometry. The clinical characteristics of enrolled patients (n = 34) are shown in Table 1. To evaluate the Nrf2 and HO-1 expression in TAMs in the normal mucosa site and tumor margin, we used forward scatter and side scatter to gate the population of large cells, followed by classification of annexin-V negative and CD14-expressing single cells into 4 groups using CD11c and CD163: CD11c+CD163–, M1-TAMs; CD11c–CD163+, M2-TAMs; CD11c+CD163+, M1/M2-TAMs (Fig. 2a) [22, 28, 30]. We analyzed samples that included more than 50 cells in each group of M1-TAMs, M2-TAMs, and M1/M2-TAMs. In line with our previous paper [22], the frequency of M2-TAMs infiltration in the tumor margin significantly increased compared with that in the normal mucosa site (p < 0.0001) (Fig. 2b). The frequency of M1/M2-TAMs infiltration also significantly increased in the tumor margin more than the normal mucosa site in this cohort (p < 0.0001) (Fig. 2b).
Table 1.
Clinical characteristics of enrolled patients
| Age (years) | |
| Mean | 69.7 |
| Range | 50–87 |
| Gender | |
| Male | 22 |
| Female | 12 |
| Tumor location | |
| Cecum | 1 |
| Ascending colon | 9 |
| Transverse colon | 1 |
| Sigmoid colon | 9 |
| Rectum | 14 |
| Pathology | |
| Papillary adenocarcinoma | 2 |
| Tubular adenocarcinoma | 28 |
| Poorly differentiated adenocarcinoma | 1 |
| Mucinous adenocarcinoma | 3 |
| Depth of invasion* | |
| Tl | 4 |
| T2 | 7 |
| T3 | 14 |
| T4 | 9 |
| Lymph node metastasis* | |
| N0 | 18 |
| N1 | 10 |
| N2 | 6 |
| TNM stage* | |
| I | 9 |
| II | 9 |
| III | 14 |
| IV | 2 |
*Depth of invasion, lymph node metastasis and TNM stage were determined according to the Union for International Cancer Control 8th Edition
Fig. 2.
Expression level of antioxidants in M2-TAMs. The frequency of TAMs and expression level of Nrf2 and HO-1 in TAMs were evaluated by flow cytometry. a The gating method to detect TAMs. b The summarized data of frequency of M1-, M1/M2-, and M2-TAMs infiltration in the normal mucosa site (n = 28) and tumor margin (n = 34). c Representative histograms of Nrf2 and HO-1 expressions in TAMs in the normal mucosa site (left) and tumor margin (right). d The summarized data of these expression levels in M1-, M1/M2-, and M2-TAMs in the normal mucosa site (left, n = 28) and tumor margin (right, n = 34). *p < 0.05, ****p < 0.0001
Next, we assessed the Nrf2 and HO-1 expression in TAMs, and representative histograms of these expressions in TAMs in the normal mucosa site and tumor margin are presented in Fig. 2c. The summarized data indicated that both Nrf2 and HO-1 expression levels in M2-TAMs significantly increased more than those in M1- and M1/M2-TAMs in the tumor margin (p < 0.0001 and p < 0.0001, respectively) (Fig. 2d right). Even in the normal mucosa site, these expression levels significantly increased in M2-TAMs compared to those in M1-TAMs (p < 0.05 and p < 0.05, respectively) (Fig. 2d left).
The prevalence of M2-TAMs expressing Nrf2 or HO-1 increased in the CRC-TME
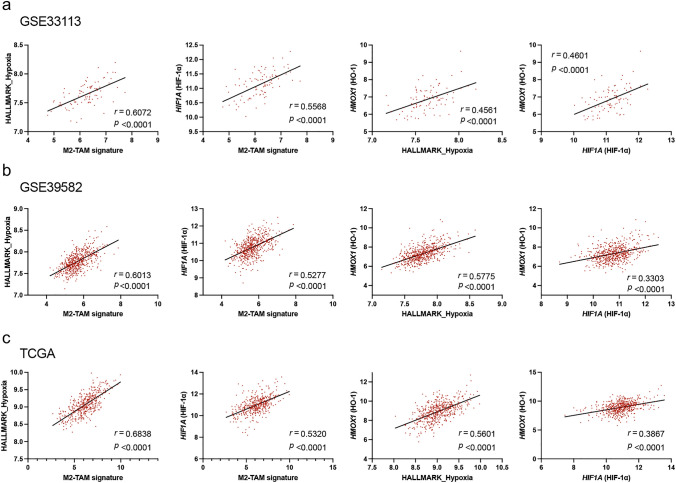
Since it was reported that the hypoxic TME activates HIF-1α and is related to the polarization of TAMs such as M1- or M2-type [7, 21, 32–34], we evaluated the correlation between M2-TAM signature and HALLMARK_Hypoxia or HIF1A (HIF-1α) mRNA expression. The analysis of GSE33113, GSE39582, and TCGA datasets showed that M2-TAM signature was significantly positively correlated with HALLMARK_Hypoxia (r = 0.6072, p < 0.0001; r = 0.6013, p < 0.0001; r = 0.6838, p < 0.0001, respectively) or HIF1A (HIF-1α) mRNA expression (r = 0.5568, p < 0.0001; r = 0.5277, p < 0.0001; r = 0.5320, p < 0.0001, respectively) (Fig. 3a-c). Furthermore, the analysis of same datasets also indicated that HMOX1 (HO-1) mRNA expression was significantly positively correlated with HALLMARK_Hypoxia (r = 0.4561, p < 0.0001; r = 0.5775, p < 0.0001; r = 0.5601, p < 0.0001, respectively) or HIF1A (HIF-1α) mRNA expression (r = 0.4601, p < 0.0001; r = 0.3303, p < 0.0001; r = 0.3867, p < 0.0001, respectively) (Fig. 3a-c).
Fig. 3.
Correlation between hypoxia and antioxidant related genes expression. The correlation between M2-TAM signature and HALLMARK_Hypoxia or HIF1A (HIF-1α) mRNA expression, and between HMOX1 (HO-1) mRNA expression and HALLMARK_Hypoxia or HIF1A (HIF-1α) mRNA expression was evaluated using GSE33113 dataset (n = 90) (a), GSE39582 (n = 566) (b), TCGA (n = 426) (c)
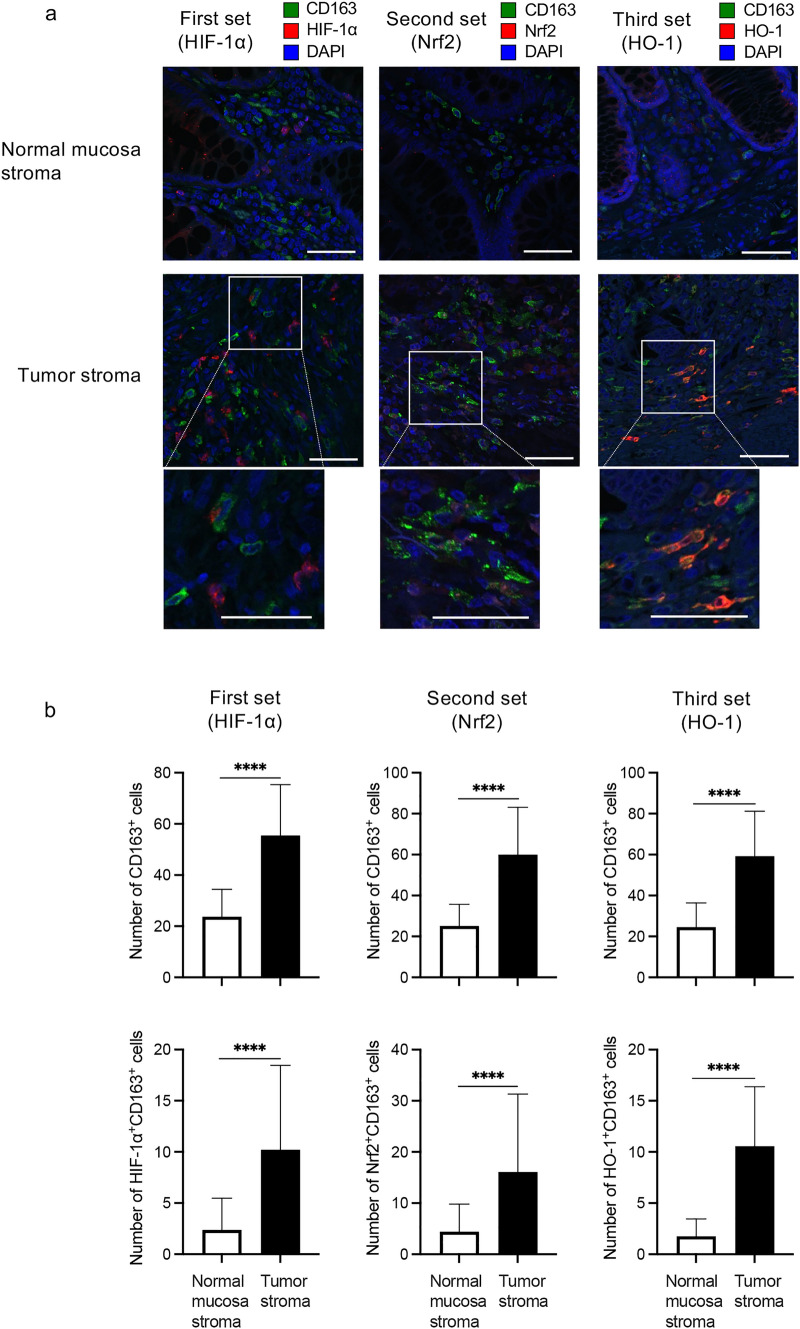
Subsequently, we assessed the prevalence of M2-TAMs expressing HIF-1α, Nrf2, or HO-1 in the CRC-TME by immunofluorescence staining. We prepared three sets of stains using serial sections: the first set including CD163, HIF-1α, and DAPI; the second set including CD163, Nrf2, and DAPI; and the third set including CD163, HO-1, and DAPI. The number of CD163+ cells (merge and green staining alone), and HIF-1α+CD163+, Nrf2+CD163+, and HO-1+CD163+ cells (merge or localized green plus red staining) were counted in three different fields at the stroma region of both normal mucosa and tumor sites (× 400). Representative images of each staining set are shown in Fig. 4a and the summarized data are presented in Fig. 4b. In line with our previous report [22], the number of CD163+ cells (M2-TAMs) and HIF-1α+CD163+ cells (HIF-1α+M2-TAMs) in the tumor stroma significantly increased more than those in the normal mucosa stroma in the first staining set (both p < 0.0001) (Fig. 4b left). In the second and third staining sets, the number of M2-TAMs in the tumor stroma also significantly increased more than that in the normal mucosa stroma (both p < 0.0001) (Fig. 4b middle and right upper). Furthermore, the number of Nrf2+ or HO-1+M2-TAMs in the tumor stroma significantly increased more than those in the normal mucosa stroma (both p < 0.0001) (Fig. 4b middle and right lower).
Fig. 4.
Frequency of M2-TAMs expressing HIF-1α, Nrf2, or HO-1. We made three sets of stains using serial sections: the first set including HIF-1α, CD163, and DAPI, the second set including Nrf2, CD163, and DAPI, and the third set including HO-1, CD163, and DAPI. The frequency of each M2-TAMs infiltration was evaluated by immunofluorescence staining. a Representative images of each immunofluorescence staining are shown and these images indicated the stromal region of each site. White scale bars indicate 100 μm and each bottom image is an enlarged image of the white-boxed region. b The summarized data of number of CD163+ cells (M2-TAMs), HIF-1α+CD163+ cells (HIF-1α+M2-TAMs), Nrf2+CD163+ cells (Nrf2+M2-TAMs), and HO-1+CD163+ cells (HO-1.+M2-TAMs) in both sites are shown. (n = 34). ****p < 0.0001
Generated M2 macrophages expressing HO-1 resisted to oxidative stress induced by H2O2
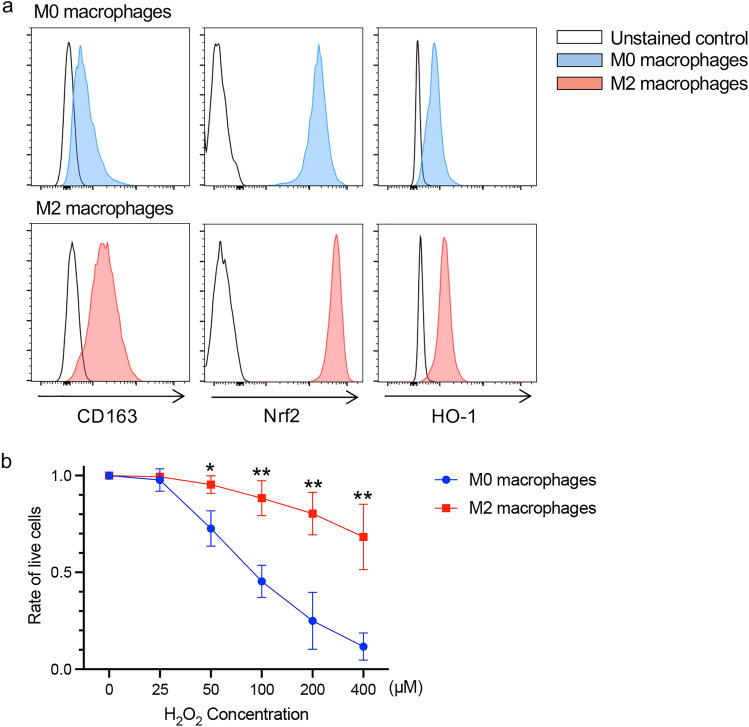
We generated M0 and M2 macrophages from peripheral blood monocytes by the generally established method [22, 30, 31]. The expression of CD163, Nrf2, and HO-1 on generated M2 macrophages increased in comparison with generated M0 macrophages evaluated by flow cytometry (Fig. 5a), and generated M2 macrophages significantly resisted to oxidative stress induced by H2O2 in comparison to generated M0 macrophages (Fig. 5b).
Fig. 5.
Sensitivity of generated M2 macrophages to oxidative stress. a The CD163, Nrf2, and HO-1 expression levels in M0/M2 macrophages generated from peripheral blood monocytes were evaluated by flow cytometry. b Summarized data of sensitivity of generated M0/M2 macrophages to oxidative stress induced by H2O2 (n = 3). The frequency of viable cells at 0 μM of H2O2 was used as a control. *p < 0.05, **p < 0.01
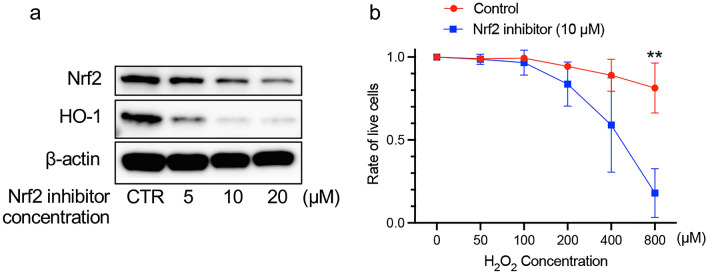
At the last, we evaluated the effects of Nrf2 inhibitor in THP-1 cells, human monocytic cell line, under oxidative stress conditions. Nrf2 inhibitor decreased Nrf2 and HO-1 protein expressions in THP-1 cells in a dose dependent manner during 48 h incubation (Fig. 6a). For the following experiment, THP-1 cells were treated with 10 μM of Nrf2 inhibitor for 48 h. THP-1 cells treated with Nrf2 inhibitor significantly increased their sensitivity to oxidative stress induced by H2O2 (Fig. 6b). Furthermore, Nrf2 inhibitor also tended to increase the sensitivity of generated M2 macrophages to oxidative stress (Supplementary Fig. S1).
Fig. 6.
Effect of Nrf2 inhibitor on the apoptosis induced by ROS in THP-1 cells. a The effect of Nrf2 inhibitor on the Nrf2 and HO-1 protein expressions in THP-1 cells was evaluated by western blot. For the following experiment, THP-1 cells were treated with 10 μM of Nrf2 inhibitor for 48 h. b The effect of Nrf2 inhibitor on the H2O2-induced apoptosis. The average of viability of THP-1 cells treated with DMSO (control) and 10 μM of Nrf2 inhibitor at 0 μM of H2O2 were 90.6% and 62.5%, respectively. The frequency of viable cells at 0 μM of H2O2 was used as a control. **p < 0.01
Discussion
In this study, we indicated that mRNA expression of HMOX1 (HO-1) was significantly positively correlated with M2-TAM signature in the analysis of three CRC datasets (GSE33113, GSE39582, and TCGA) (Fig. 1). Furthermore, in the analyses using surgically resected specimens of CRC (n = 34), we indicated that the expression level of both Nrf2 and HO-1 significantly increased in M2-TAMs compared to M1- and M1/M2-TAMs in the tumor margin (Fig. 2d right), and that the number of Nrf2+ or HO-1+M2-TAMs in the tumor stroma significantly increased more than those in the normal mucosa stroma (Fig. 4b lower middle and right). Finally, we showed that generated M2 macrophages expressing HO-1 had low sensitivity to H2O2-induced oxidative stress (Fig. 5b). Taken together, it was suggested that the increased frequency of M2-TAMs infiltration in the CRC-TME may be associated with their low sensitivity to oxidative stress induced by ROS.
Many reports have shown that M2-TAMs involved in the suppression of tumor immune responses in the TME through a number of mechanisms [6–12]. In particular, CD163+M2-TAMs suppressed the therapeutic efficacy of immunotherapy targeting for PD-1 axis for melanomas in a mouse model and were involved in hyper progressive disease in non-small cell lung cancer patients subsequent to immunotherapy blocking PD-1 axis [35, 36]. Recently, Consonni et al. reported that TAMs expressing both HO-1 and CD163 promoted tumor angiogenesis and epithelial-mesenchymal transition of tumor cells, and suppressed the function of CD8+ T cells, resulting in the formation of a pro-metastatic TME [23]. Furthermore, the inhibition of HO-1+CD163+TAMs infiltration into the tumor region prevented the formation of a pro-metastatic TME and improved the therapeutic efficacy of anti-PD-1 therapy [23]. Therefore, it is crucial to control M2-TAMs in the TME for enhancement of efficacy of immunotherapy. In this study, we revealed that CD163+M2-TAMs were selectively enriched in the CRC-TME and expressed a large amount of HO-1 (Figs. 2 and 4). It is assumed that HO-1+CD163+M2-TAMs suppresses immune responses in the TME. We speculate that controlling the increased frequency of HO-1+CD163+M2-TAMs in the TME is crucial to enhance the efficacy of immunotherapy for patients with CRC.
In this cohort, the M1/M2-TAMs population was observed frequently among the TAMs in the tumor margin (Fig. 2b). We have also previously confirmed the existence of M1/M2-TAMs in the CRC-TME [22, 28], and reported that the accumulation of M1/M2 adipose tissue macrophages was clearly correlated with body mass index and production of ROS [26]. Although the characteristics of M1/M2-TAMs were different from those of M1- and M2-TAMs regarding Nrf2–HO-1 axis (Figs. 2c-d). We believe that the evaluation of M1/M2-TAMs is necessary to elucidate the immune suppressive mechanism caused by TAMs in the CRC-TME. However, the function of this population is still unclear in the tumor immunology. We would like to advance the project to elucidate their function in the future plan.
HO-1+CD163+TAMs preferentially localized at the invasive margin of malignant melanoma depending on Nrf2 activation [23]. Sun et al. also reported that Nrf2 was an inducer of HO-1 in hemophagocytic macrophages [37]. Furthermore, Consonni et al. reported that the increase of HO-1+CD163+TAMs at the tumor region is dependent on activation of the nuclear factor-κB1–M-CSF-1-receptor–C3aR–Nrf2 axis [23]. In this study, we identified that the expression level of both Nrf2 and HO-1 increased in M2-TAMs and the number of Nrf2+ or HO-1+M2-TAMs increased in the CRC-TME (Figs. 2d right and 4b lower). Moreover, we also showed that generated M2 macrophages expressing HO-1 significantly resisted to oxidative stress induced by H2O2, and THP-1 cells, human monocytic cell line, and generated M2 macrophages resist H2O2-induced oxidative stress through the Nrf2–HO-1 axis (Figs. 5, 6, and Supplementary Fig. S1). These results including ours suggested that CD163+M2-TAMs express HO-1 though Nrf2 axis and can selectively survive in the CRC-TME through resistance to oxidative stress via Nrf2–HO-1 system.
Laoui et al. reported that TAMs expressing abundant M2 markers exist in regions where are more hypoxic in the TME, and those TAMs express high level of mRNA for hypoxia-regulated genes [38]. In this study, the analysis of three CRC datasets (GSE33113, GSE39582, and TCGA) indicated that M2-TAM signature was positively correlated with HALLMARK_Hypoxia and mRNA expression of HIF1A (HIF-1α) (Figs. 3a-c). In addition, we showed that the frequency of HIF-1α+M2-TAMs infiltration in the tumor stroma significantly increased in comparison with that in the normal mucosa stroma (Fig. 4b lower left). Interestingly, previous studies showed that HIF-1α signaling induces cellular localization of Nrf2 [39, 40], and Nrf2 signaling induces production of antioxidants including HO-1 [21]. These reports indicated that hypoxia may induce antioxidants such as HO-1 through Nrf2 axis in M2-TAMs. Actually, we identified in this study that mRNA expression of HIF1A (HIF-1α) was positively correlated with that of HMOX1 (HO-1) and the frequency of M2-TAMs expressing HIF-1α+, Nrf2+, or HO-1+ in the CRC-TME significantly increased more than those in the normal mucosa site (Figs. 3 and 4). These our results taken together with those of previous studies suggest that the upregulation of HO-1 expression in M2-TAMs may be related to Nrf2 pathway activated by HIF-1α signaling through hypoxia in the CRC-TME.
In conclusion, an increased frequency of M2-TAMs infiltration may be related to the Nrf2–HO-1 mediated resistance to oxidative stress in the CRC-TME.
Supplementary Information
Below is the link to the electronic supplementary material.
Acknowledgements
We thank Saori Naruse, Ayumi Nakajima, Eri Takahashi, Sakino Arai, and Masayo Sugeno for secretarial and technical assistance.
Abbreviations
- CRC
Colorectal cancer
- H2O2
Hydrogen peroxide
- HIF-1α
Hypoxia-inducible factor 1α
- HO-1
Heme oxygenase-1
- NQO1
Nicotinamide adenine dinucleotide phosphate hydrogen, and quinone oxidoreductases
- Nrf2
Nuclear factor erythroid 2-related factor 2
- ROS
Reactive oxygen species
- TAM
Tumor-associated macrophages
- TCGA
The Cancer Genome Atlas
- TrxR1
Thioredoxin reductase 1
Author contributions
KM, TN, and KK were involved in conception and design. MI, HOk, KS, TN, TK, HOn, SF, WS, MS, TM, and ZS were involved in acquisition of patient samples and information, and interpretation of results. MI, SN, and KS performed immunofluorescence staining and its evaluation. MI, SN, and HOk performed analysis of public dataset. MI and SN performed flow cytometric analysis. MI, KM, SN, and KK were involved in analysis of all data and drafting of the manuscript.
Funding
Japan Society for the Promotion of Science, KAKENHI, Grant Number: 21K16480.
Data availability
The data that support the findings of this study are available from the corresponding authors upon reasonable request.
Declarations
Competing interest
The authors declare no conflict of interest to disclose.
Ethical approval
This study was conducted in accordance with the ethical principles of the 1964 Declaration of Helsinki and its later amendments. All specimen collection and experimental procedures in this study were approved by the Institutional Research Ethics Committee at Fukushima Medical University School of Medicine (Reference No. 2020-223).
Consent to participate
Written informed consent was obtained from all patients for the use of tissue specimens and clinical data, and from the healthy donors for blood collection.
Footnotes
Publisher's Note
Springer Nature remains neutral with regard to jurisdictional claims in published maps and institutional affiliations.
References
- 1.Overman MJ, Mcdermott R, Leach JL, et al. Nivolumab in patients with metastatic DNA mismatch repair-deficient or microsatellite instability-high colorectal cancer (CheckMate 142): an open-label, multicentre, phase 2 study. Lancet Oncol. 2017;18:1182–1191. doi: 10.1016/S1470-2045(17)30422-9. [DOI] [PMC free article] [PubMed] [Google Scholar]
- 2.Overman MJ, Lonardi S, Wong KYM, et al. Durable clinical benefit with nivolumab plus ipilimumab in DNA mismatch repair-deficient/microsatellite instability-high metastatic colorectal cancer. J Clin Oncol. 2018;36:773–779. doi: 10.1200/JCO.2017.76.9901. [DOI] [PubMed] [Google Scholar]
- 3.Tanaka A, Sakaguchi S. Regulatory T cells in cancer immunotherapy. Cell Res. 2017;27:109–118. doi: 10.1038/cr.2016.151. [DOI] [PMC free article] [PubMed] [Google Scholar]
- 4.Veglia F, Perego M, Gabrilovich D. Myeloid-derived suppressor cells coming of age. Nat Immunol. 2018;19:108–119. doi: 10.1038/s41590-017-0022-x. [DOI] [PMC free article] [PubMed] [Google Scholar]
- 5.Ruffell B, Coussens LM. Macrophages and therapeutic resistance in cancer. Cancer Cell. 2015;27:462–472. doi: 10.1016/j.ccell.2015.02.015. [DOI] [PMC free article] [PubMed] [Google Scholar]
- 6.Mantovani A, Allavena P, Sica A, et al. Cancer-related inflammation. Nature. 2008;454:436–444. doi: 10.1038/nature07205. [DOI] [PubMed] [Google Scholar]
- 7.Mantovani A, Marchesi F, Malesci A, et al. Tumour-associated macrophages as treatment targets in oncology. Nat Rev Clin Oncol. 2017;14:399–416. doi: 10.1038/nrclinonc.2016.217. [DOI] [PMC free article] [PubMed] [Google Scholar]
- 8.Yang L, Zhang Y. Tumor-associated macrophages: from basic research to clinical application. J Hematol Oncol. 2017;10:58. doi: 10.1186/s13045-017-0430-2. [DOI] [PMC free article] [PubMed] [Google Scholar]
- 9.Hinshaw DC, Shevde LA. The tumor microenvironment innately modulates cancer progression. Cancer Res. 2019;79:4557–4566. doi: 10.1158/0008-5472.Can-18-3962. [DOI] [PMC free article] [PubMed] [Google Scholar]
- 10.Noy R, Pollard JW. Tumor-associated macrophages: from mechanisms to therapy. Immunity. 2014;41:49–61. doi: 10.1016/j.immuni.2014.06.010. [DOI] [PMC free article] [PubMed] [Google Scholar]
- 11.Ruffell B, Affara NI, Coussens LM. Differential macrophage programming in the tumor microenvironment. Trends Immunol. 2012;33:119–126. doi: 10.1016/j.it.2011.12.001. [DOI] [PMC free article] [PubMed] [Google Scholar]
- 12.Biswas SK, Mantovani A. Macrophage plasticity and interaction with lymphocyte subsets: cancer as a paradigm. Nat Immunol. 2010;11:889–896. doi: 10.1038/ni.1937. [DOI] [PubMed] [Google Scholar]
- 13.Yu J, Green MD, Li S, et al. Liver metastasis restrains immunotherapy efficacy via macrophage-mediated T cell elimination. Nat Med. 2021;27:152–164. doi: 10.1038/s41591-020-1131-x. [DOI] [PMC free article] [PubMed] [Google Scholar]
- 14.Szatrowski TP, Nathan CF. Production of large amounts of hydrogen peroxide by human tumor cells. Cancer Res. 1991;51:794–798. [PubMed] [Google Scholar]
- 15.Kusmartsev S, Nefedova Y, Yoder D, et al. Antigen-specific inhibition of CD8+ T cell response by immature myeloid cells in cancer is mediated by reactive oxygen species. J Immunol. 2004;172:989–999. doi: 10.4049/jimmunol.172.2.989. [DOI] [PubMed] [Google Scholar]
- 16.Hayes JD, Dinkova-Kostova AT, Tew KD. Oxidative stress in cancer. Cancer Cell. 2020;38:167–197. doi: 10.1016/j.ccell.2020.06.001. [DOI] [PMC free article] [PubMed] [Google Scholar]
- 17.Harlin H, Hanson M, Johansson CC, et al. The CD16- CD56(bright) NK cell subset is resistant to reactive oxygen species produced by activated granulocytes and has higher antioxidative capacity than the CD16+ CD56(dim) subset. J Immunol. 2007;179:4513–4519. doi: 10.4049/jimmunol.179.7.4513. [DOI] [PubMed] [Google Scholar]
- 18.Takahashi A, Hanson MG, Norell HR, et al. Preferential cell death of CD8+ effector memory (CCR7-CD45RA-) T cells by hydrogen peroxide-induced oxidative stress. J Immunol. 2005;174:6080–6087. doi: 10.4049/jimmunol.174.10.6080. [DOI] [PubMed] [Google Scholar]
- 19.Mougiakakos D, Johansson CC, Jitschin R, et al. Increased thioredoxin-1 production in human naturally occurring regulatory T cells confers enhanced tolerance to oxidative stress. Blood. 2011;117:857–861. doi: 10.1182/blood-2010-09-307041. [DOI] [PubMed] [Google Scholar]
- 20.Izawa S, Mimura K, Watanabe M, et al. Increased prevalence of tumor-infiltrating regulatory T cells is closely related to their lower sensitivity to H2O2-induced apoptosis in gastric and esophageal cancer. Cancer Immunol Immunother. 2013;62:161–170. doi: 10.1007/s00262-012-1327-0. [DOI] [PMC free article] [PubMed] [Google Scholar]
- 21.Rojo De La Vega M, Chapman E, Zhang DD. NRF2 and the hallmarks of cancer. Cancer Cell. 2018;34:21–43. doi: 10.1016/j.ccell.2018.03.022. [DOI] [PMC free article] [PubMed] [Google Scholar]
- 22.Min AKT, Mimura K, Nakajima S, et al. Therapeutic potential of anti-VEGF receptor 2 therapy targeting for M2-tumor-associated macrophages in colorectal cancer. Cancer Immunol Immunother. 2021;70:289–298. doi: 10.1007/s00262-020-02676-8. [DOI] [PMC free article] [PubMed] [Google Scholar]
- 23.Consonni FM, Bleve A, Totaro MG, et al. Heme catabolism by tumor-associated macrophages controls metastasis formation. Nat Immunol. 2021;22:595–606. doi: 10.1038/s41590-021-00921-5. [DOI] [PubMed] [Google Scholar]
- 24.Endo E, Okayama H, Saito K, et al. A TGFβ-dependent stromal subset underlies immune checkpoint inhibitor efficacy in DNA mismatch repair-deficient/microsatellite instability-high colorectal cancer. Mol Cancer Res. 2020;18:1402–1413. doi: 10.1158/1541-7786.Mcr-20-0308. [DOI] [PubMed] [Google Scholar]
- 25.Gao J, Aksoy BA, Dogrusoz U, et al. Integrative analysis of complex cancer genomics and clinical profiles using the cBioPortal. Sci Signal. 2013;6:pl1. doi: 10.1126/scisignal.2004088. [DOI] [PMC free article] [PubMed] [Google Scholar]
- 26.Nakajima S, Koh V, Kua LF, et al. Accumulation of CD11c+CD163+ adipose tissue macrophages through upregulation of intracellular 11beta-HSD1 in human obesity. J Immunol. 2016;197:3735–3745. doi: 10.4049/jimmunol.1600895. [DOI] [PubMed] [Google Scholar]
- 27.Liberzon A, Birger C, Thorvaldsdottir H, et al. The molecular signatures database (MSigDB) hallmark gene set collection. Cell Syst. 2015;1:417–425. doi: 10.1016/j.cels.2015.12.004. [DOI] [PMC free article] [PubMed] [Google Scholar]
- 28.Kikuchi T, Mimura K, Ashizawa M, et al. Characterization of tumor-infiltrating immune cells in relation to microbiota in colorectal cancers. Cancer Immunol Immunother. 2020;69:23–32. doi: 10.1007/s00262-019-02433-6. [DOI] [PMC free article] [PubMed] [Google Scholar]
- 29.Neupane P, Mimura K, Nakajima S, et al. The expression of immune checkpoint receptors and ligands in the colorectal cancer tumor microenvironment. Anticancer Res. 2021;41:4895–4905. doi: 10.21873/anticanres.15303. [DOI] [PubMed] [Google Scholar]
- 30.Nakajima S, Mimura K, Saito K, et al. Neoadjuvant chemotherapy induces IL34 signaling and promotes chemoresistance via tumor-associated macrophage polarization in esophageal squamous cell carcinoma. Mol Cancer Res. 2021;19:1085–1095. doi: 10.1158/1541-7786.Mcr-20-0917. [DOI] [PubMed] [Google Scholar]
- 31.Zarif JC, Hernandez JR, Verdone JE, et al. A phased strategy to differentiate human CD14+monocytes into classically and alternatively activated macrophages and dendritic cells. Biotechniques. 2016;61:33–41. doi: 10.2144/000114435. [DOI] [PMC free article] [PubMed] [Google Scholar]
- 32.Muz B, De La Puente P, Azab F, et al. The role of hypoxia in cancer progression, angiogenesis, metastasis, and resistance to therapy. Hypoxia (Auckl) 2015;3:83–92. doi: 10.2147/hp.S93413. [DOI] [PMC free article] [PubMed] [Google Scholar]
- 33.De Palma M, Lewis CE. Macrophage regulation of tumor responses to anticancer therapies. Cancer Cell. 2013;23:277–286. doi: 10.1016/j.ccr.2013.02.013. [DOI] [PubMed] [Google Scholar]
- 34.Casazza A, Laoui D, Wenes M, et al. Impeding macrophage entry into hypoxic tumor areas by Sema3A/Nrp1 signaling blockade inhibits angiogenesis and restores antitumor immunity. Cancer Cell. 2013;24:695–709. doi: 10.1016/j.ccr.2013.11.007. [DOI] [PubMed] [Google Scholar]
- 35.Etzerodt A, Tsalkitzi K, Maniecki M, et al. Specific targeting of CD163(+) TAMs mobilizes inflammatory monocytes and promotes T cell-mediated tumor regression. J Exp Med. 2019;216:2394–2411. doi: 10.1084/jem.20182124. [DOI] [PMC free article] [PubMed] [Google Scholar]
- 36.Lo Russo G, Moro M, Sommariva M, et al. Antibody-Fc/FcR interaction on macrophages as a mechanism for hyperprogressive disease in non-small cell lung cancer subsequent to Pd-1/Pd-L1 blockade. Clin Cancer Res. 2019;25:989–999. doi: 10.1158/1078-0432.Ccr-18-1390. [DOI] [PubMed] [Google Scholar]
- 37.Sun J, Hoshino H, Takaku K, et al. Hemoprotein Bach1 regulates enhancer availability of heme oxygenase-1 gene. Embo j. 2002;21:5216–5224. doi: 10.1093/emboj/cdf516. [DOI] [PMC free article] [PubMed] [Google Scholar]
- 38.Laoui D, Van Overmeire E, Di Conza G, et al. Tumor hypoxia does not drive differentiation of tumor-associated macrophages but rather fine-tunes the M2-like macrophage population. Cancer Res. 2014;74:24–30. doi: 10.1158/0008-5472.Can-13-1196. [DOI] [PubMed] [Google Scholar]
- 39.Li L, Pan H, Wang H, et al. Interplay between VEGF and Nrf2 regulates angiogenesis due to intracranial venous hypertension. Sci Rep. 2016;6:37338. doi: 10.1038/srep37338. [DOI] [PMC free article] [PubMed] [Google Scholar]
- 40.Warfel NA, Sainz AG, Song JH, et al. PIM kinase inhibitors kill hypoxic tumor cells by reducing Nrf2 signaling and increasing reactive oxygen species. Mol Cancer Ther. 2016;15:1637–1647. doi: 10.1158/1535-7163.Mct-15-1018. [DOI] [PMC free article] [PubMed] [Google Scholar]
Associated Data
This section collects any data citations, data availability statements, or supplementary materials included in this article.
Supplementary Materials
Data Availability Statement
The data that support the findings of this study are available from the corresponding authors upon reasonable request.


