Abstract
Triple-negative breast cancer (TNBC) is characterized by a more aggressive clinical course with extensive inter- and intra-tumour heterogeneity. Combination of single-cell and bulk tissue transcriptome profiling allows the characterization of tumour heterogeneity and identifies the association of the immune landscape with clinical outcomes. We identified inter- and intra-tumour heterogeneity at a single-cell resolution. Tumour cells shared a high correlation amongst stemness, angiogenesis, and EMT in TNBC. A subset of cells with concurrent high EMT, stemness and angiogenesis was identified at the single-cell level. Amongst tumour-infiltrating immune cells, M2-like tumour-associated macrophages (TAMs) made up the majority of macrophages and displayed immunosuppressive characteristics. CIBERSORT was applied to estimate the abundance of M2-like TAM in bulk tissue transcriptome file from The Cancer Genome Atlas (TCGA). M2-like TAMs were associated with unfavourable prognosis in TNBC patients. A TAM-related gene signature serves as a promising marker for predicting prognosis and response to immunotherapy. Two commonly used machine learning methods, random forest and SVM, were applied to find the genes that were mostly associated with M2-like TAM densities in the gene signature. A neural network-based deep learning framework based on the TAM-related gene signature exhibits high accuracy in predicting the immunotherapy response.
Electronic supplementary material
The online version of this article (10.1007/s00262-020-02669-7) contains supplementary material, which is available to authorized users.
Keywords: Triple-negative breast cancer (TNBC), Tumour heterogeneity, Tumour-infiltrating immune cells, M2-like tumour-associated macrophages (M2-like TAMs), Prognosis
Introduction
Triple-negative breast cancer (TNBC), which represents up to 20% of all breast cancers, is characterized by a lack of progesterone receptor, oestrogen receptor and human epidermal growth factor receptor 2 (HER2) [1]. TNBC exhibits increased angiogenesis and epithelial-mesenchymal transition (EMT) and is characterized by more aggressive clinical features compared with other breast cancer types [2]. TNBC cases share some properties, such as frequent p53, PIK3CA and PTEN somatic mutations [3], histological features of pushing border of invasion and central necrotic area, high metastasis into the lung, and a basal-like phenotype [1]. Nonetheless, TNBC is a tumour characterized by both inter- and intra-tumour heterogeneity [4].
Heterogeneity of TNBC considerably contributes to decreasing the effect of chemotherapy that could be effective in a molecularly selected subset of patients. Despite advancements in breast cancer treatment in recent years, a significant proportion of TNBC patients continue to progress to a metastatic stage and have poor clinical outcomes. Elimination of the majority of tumour tissue cells may not be effective in inhibiting TNBC progression [5]. Multiclonal seeding from individual clones in the TNBC tissue leads to multi-site metastasis [6]. This phenomenon may be evidence of clonal evolution and tumour heterogeneity-guided tumour progression. Thus, identifying the diversity of TNBC cells at the single-cell level and the subset of highly metastatic tumour cells would be helpful for precision treatment of TNBC.
The inter- and intra-tumour heterogeneity may also come from non-tumour cells in TNBC. Sequencing data from multiple regions revealed that spatial sub-clonal diversification is dominant in TNBC [6]. Moreover, TNBCs also present a higher rate of lymphocytic infiltration, and tumour infiltration by immune cells varies amongst different patients [7]. One study revealed a structured tumour-immune microenvironment in TNBC by multiplexed ion beam imaging [8]. Variability was found in the composition of tumour-immune populations across individuals, reconciled by overall immune infiltration and enriched co-occurrence of immune subpopulations [8]. Immune cell infiltration was identified in a type- and spatial-specific cell manner, suggesting that tumour heterogeneity comes from various immune cell populations.
TNBC exhibits increased genomic instability and mutational load, which might result in higher susceptibility to immunotherapy [9]. Understanding the immune landscape of TNBC may facilitate the development of immunotherapy as well. Therefore, a single-cell level analysis of tumour and tumour-infiltrating immune cells is urgently needed to characterize the precise nature of tumour cell diversities in TNBC and the inter- and intra-tumour heterogeneous immune cell populations. However, until today, most studies of TNBC have been limited to bulk RNA-seq analysis [10, 11],
In the present study, we accessed both single-cell RNA-seq data and bulk RNA-seq data from public databases and analysed them by several computational biology methods. Through detailed bioinformatics analyses of individual tumour cells, bulk RNA-seq data and clinical data, we describe the tumour heterogeneity in TNBC and the association of M2-like tumour-associated macrophages (M2-like TAMs) with clinical outcomes.
Methods
Data processing
Single-cell transcriptome files of GSE118389 and GSE75688 were downloaded from the Gene Expression Omnibus (GEO) database (http://www.ncbi.nlm.nih.gov/geo/). The Cancer Genome Atlas (TCGA) bulk tumour transcriptome data and clinical information about TNBC were downloaded via the UCSC Xena browser (https://xenabrowser.net/). GSE19615, GSE21653, and GSE31519 are microarray datasets of bulk tumours and were downloaded from GEO. Only TNBC tissues were selected for the analysis in this study. Package “sva” was applied to remove the batch effect amongst different microarray datasets [12] and to obtain a pooled GEO cohort. R software (version: 3.5.3) was used for all the analyses in the manuscript.
Single-cell RNA-seq analysis
Two single-cell transcriptome profiles were integrated to perform the downstream analysis. The “Seurat” package was used to perform the single-cell RNA-seq analysis [13]. The batch effect from studies was removed with regularized negative binomial regression by the “Seurat” package. Non-linear dimensional reduction was performed with the UMAP method. Cluster biomarkers were found by the “Seurat” package.
ssGSEA implementation
The enrichment scores of the hallmark genes were evaluated using single-sample GSEA (ssGSEA) with the R package “GSVA” [14]. The hallmark gene sets were obtained from MSigDB and supplementary files published by Woosung Chung et al. [2]. Spearman’s coefficient analysis was performed to explore the correlation between EMT, angiogenesis, and stemness [2].
Estimate of the abundance of TAMs and implementation of weighted correlation network analysis (WGCNA)
CIBERSORT R script was used to estimate the abundance of TAMs in TCGA TNBC based on the bulk RNA-seq dataset [15]. WGCNA was performed with the R package “WGCNA” [16]. A power of β = 5 and a scale-free R2 = 0.95 were set as soft-threshold parameters to ensure a signed scale-free co-expression gene network. A total of 7 non-grey modules were generated. Amongst these modules, the blue module depicting the highest correlation (r = 0.48, p < 0.0001) was considered the most correlated with TAM density.
Survival analysis
Survival analysis was performed using the R package “survival” [17]. The hazard ratio (HR) was determined with Cox regression analysis. Univariate Cox regression was performed with all genes in the blue module. The 146 genes that were significantly associated with the survival of TNBC patients in the blue module were identified as the TAM-related gene signature.
Prognostic gene signature-based risk score and ssGSEA implementation
A principal component analysis (PCA) was applied to calculate a “protective score” against TAM cell infiltration. The PCA-based protective score was derived from the first principal component of the 146 genes from the TAM-related gene signature. In this analysis, represents the value of the key gene in tumour sample , and represents the corresponding coefficient of the mast cell-related genes. The value was calculated as follows:
Molecular subtype identification
The R package “ConsensusClusterPlus” was used to perform K-means-based consensus clustering based on the transcriptome file of the TAM-related gene signature [18]. Cumulative distribution function (CDF) plots and consensus matrices were obtained with the “ConsensusClusterPlus” package with default parameters.
Differentially expressed gene (DEG) analysis
The “Limma” package was used to perform the DEG analysis. An empirical Bayesian method was applied to estimate the fold change between cluster one and cluster two identified by the consensus clustering method using moderated t tests [19]. The adjusted P value for multiple testing was calculated using the Benjamini–Hochberg correction. The genes with an absolute log2 fold change greater than 1.5 were identified as DEGs between two clusters.
Random forest algorithm and support vector machine (SVM) for feature importance ranking
A random forest (RF) algorithm and an SVM algorithm were applied to find the most important genes associated with the TAM density in TNBC. First, the best hyperparameter in the regression process was found by the “ranger” package [20]. Then, the “randomforest” package was applied for the construction of the regression model [21]. The “e1071” package was used to construct the SVM model and perform feature ranking [22].
Neural network construction
PyTorch was employed to construct the neural network to predict the immunotherapy response by the mast cell-related gene signature in Python (version 3.5) [23]. The optimizer was set with a learning rate of 0.001 and applied with the stochastic gradient descent method. A dropout rate of 0.2 was set for each layer in the training process. The activate function was set as ReLU. The neural network model was trained with the TAM-related gene signature from the TCGA cohort and tested in an independent pooled cohort (GSE19615, GSE21653, GSE31519) from GEO.
Results
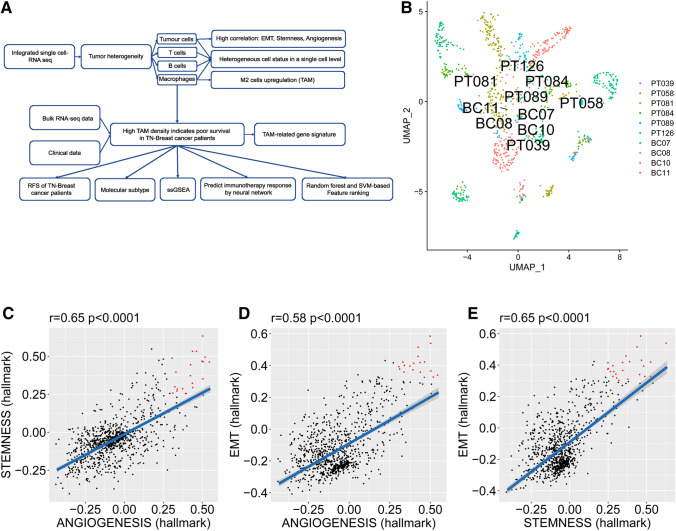
A schematic diagram of the study design is shown in Fig. 1a. First, single-cell RNA-seq analysis was performed to analyse inter- and intra-tumour heterogeneity. Tumour heterogeneity was characterized by both tumour cells and tumour-infiltrating immune cells. High proportions of TAMs were found in tumour-infiltrating macrophages. Hence, we performed bulk RNA-seq analysis to find the association between TAMs and survival. Several bioinformatic methods were implemented to analyse the biological features of TAMs in TNBC. A TAM-related gene signature was established to predict the survival and immunotherapy response.
Fig. 1.
Intrinsic TNBC tumour heterogeneity at the single-cell level. a Schematic diagram of the study design. b UMAP clustering of tumour cells. c The correlation between stemness and angiogenesis in TNBC. d The correlation between EMT and angiogenesis in TNBC. e The correlation between EMT and stemness in TNBC
Tumour cell heterogeneity in TNBC cells
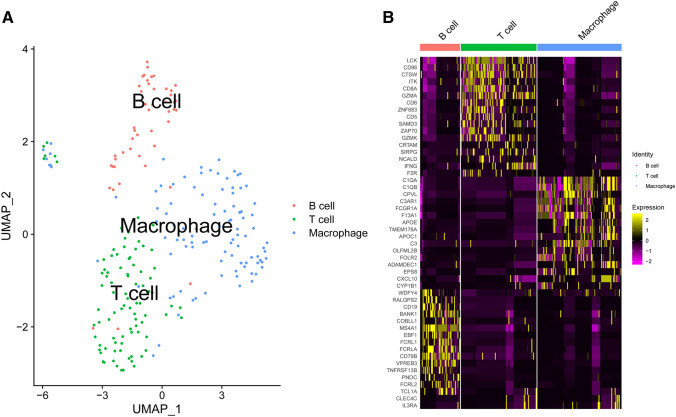
The patient sources are shown in Table 1. The UMAP method was used to perform non-linear dimensional reduction. The plot revealed high clustering of tumour cells from each patient (Fig. 1b), whereas the immune cells exhibited high clustering by their cell types rather than by the source (Fig. 2a), suggesting the distinct tumour characteristics of each patient and shared immune cell populations amongst patients at the single-cell level.
Table 1.
TNBC patient information (single-cell RNA-seq)
Fig. 2.
Clustering of tumour-infiltrating immune cell populations. a UMAP clustering of tumour-infiltrating immune cell populations. b Heatmap of differentially expressed features in each cluster
The tumour recurrence of TNBC is tightly linked with several aggressive cancer signatures, such as stemness, angiogenesis, and EMT [24]. Hence, we analysed the signature of stemness, angiogenesis and EMT at the single-cell level. Notably, stemness, angiogenesis, and EMT were positively correlated in TNBC cells (Fig. 1c–e). Some cells had concurrent high levels of the three signatures (which are labelled red), suggesting the potential synergistic role of the subset in tumour progression, metastasis and recurrence.
Immune cell heterogeneity in TNBC cells
The immune cells were grouped into three clusters. The three clusters fit well with the immune cell types (T cells, B cells, and macrophages) (Fig. 2a). The heatmap shows the most important genes to identify the three clusters (Fig. 2b).
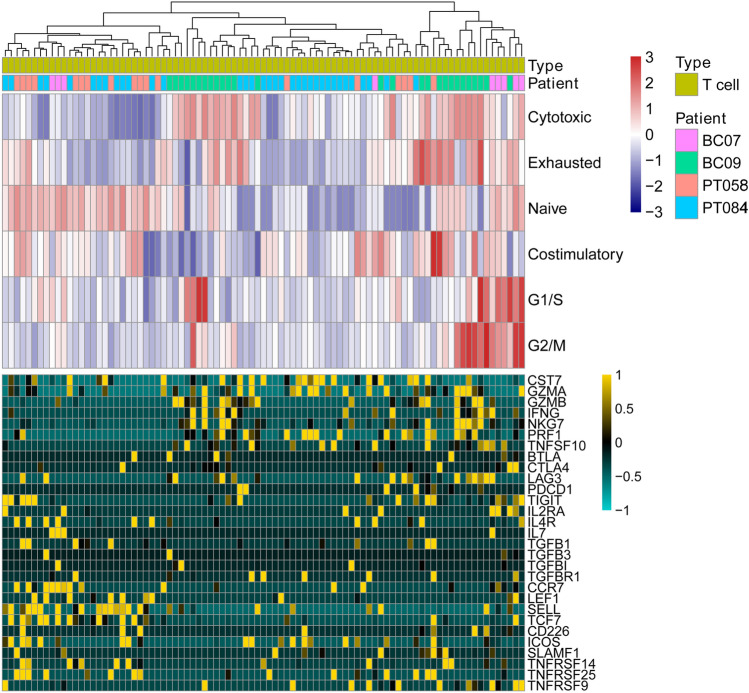
In the next step, the immune cells were analysed separately. The gene signature profiles for T-cell activation and functional status in TNBC were exacted from the single-cell transcriptome data and linked with the T-cell functional status, such as regulatory, costimulatory, native, cytotoxic and exhausted (Fig. 3). BC09 patients had more cytotoxic T cells than other patients. In contrast, PT058 and PT084 patients had lower average levels of cytotoxic T-cell activity. T cells with high cytotoxic activity expressed high levels of CST7, GZMA, GZMB, IFNG, NKG7, PRF1, and TNFSF10. Besides, T cells in TNBC tissues exhibited a mixed naive T status even in a single patient. The homogeneous naive T-cell status may be linked to the efficiency of the T-cell cytotoxic activity in TNBC.
Fig. 3.
T-cell signatures in TNBC at the single-cell level. Upper panel reveals the clustering of T cells using GSVA enrichment scores from gene sets associated with naive T cells, T-cell co-stimulation, regulatory cytokines and receptors, T-cell exhaustion and cytotoxicity. The lower panel indicates the important genes from the gene sets above
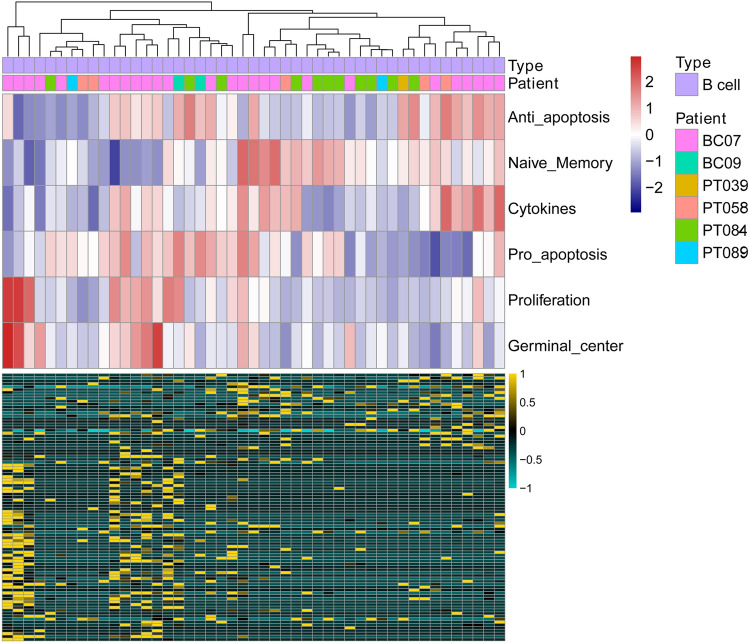
For tumour-infiltrating B cells, we analysed the B-cell functional status, such as anti-apoptosis, naive memory, cytokines, pro-apoptosis, proliferation, germinal centre, and related gene expression signatures (Fig. 4). B immune cells exhibited a heterogeneous activity distribution amongst TNBC patients and within the same TNBC patients. Overall, immune cells showed a clear difference amongst each other by single-cell transcriptome data, whereas T and B tumour-infiltrating immune cells showed heterogeneous activity at the single-cell level both in each patient and amongst different patients.
Fig. 4.
B-cell signatures in TNBC at the single-cell level. The upper panel reveals the clustering of B cells using GSVA enrichment scores from gene sets associated with anti-apoptosis, naive memory, cytokines, pro-apoptosis, proliferation, and germinal centre. The lower panel indicates the genes involved in the gene sets above
The third immune cell cluster was macrophage cells in TNBC. Interestingly, high M2 activity was found in macrophages (Fig. 5). M2-like TAMs promote tumourigenesis by inducing angiogenesis, EMT, and stemness and suppressing immune surveillance in many cancer types. The genes that were significantly expressed in macrophages were also involved in inflammation and angiogenesis functions. M2-type genes, such as TGFBI, MS4A6A, and CD163, were upregulated in most macrophages in TNBC. Furthermore, genes known to promote angiogenesis, EMT and tumour progression, such as IL8 and PLAUR, were overexpressed in TNBC macrophages. Collectively, M2-like TAMs were the dominant type of macrophages in TNBC.
Fig. 5.
Integrated tumour-infiltrating immune cell analysis in TNBC at the single-cell level. GSVA enrichment scores from gene sets associated with B cells, T cells, macrophages, M1-type macrophages, and M2-type macrophages reveal a high proportion of M2-type macrophages occupying total macrophages in TNBC in the upper panel. The lower panel indicates the important genes from the gene sets above
M2-like TAMs are associated poor survival in TNBC patients
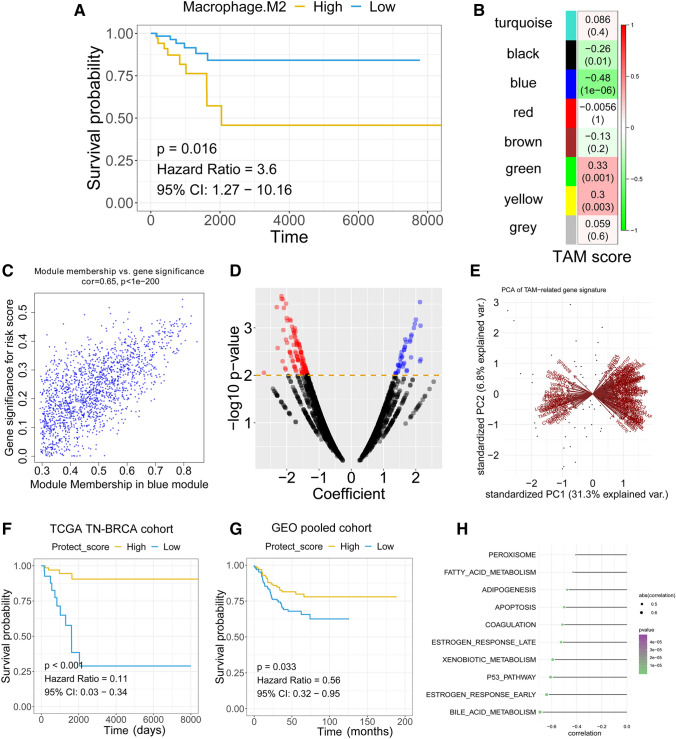
The abundance of M2-like TAMs was calculated with the Nu support vector regression algorithm by CIBERSORT with the transcriptome profile of bulk RNA-seq data from TCGA TNBC patients. The TCGA TNBC patient information is summarized in Table 2. Survival analysis revealed that a high abundance of TAMs was associated with poor relapse-free survival (RFS) in TNBC patients by the Cox proportional hazards regression model (Fig. 6a). To further understand the potential roles of TAMs in TNBC, WGCNA was used to construct a scale-free co-expression network to identify a TAM-related gene signature. A total of 7 non-grey modules were generated (Fig. 6b). Amongst these modules, the blue module depicting the highest correlation with M2-like TAM scores was considered the “TAM module” (r = − 0.48, P = 1e−6; Fig. 6b). Gene significance represented the association of individual genes with TAM density, and the module membership quantified the correlation between module eigenvalues (the “centre point”) and gene expression profiles. The scatter diagram showed a highly positive correlation between gene significance and module membership in the blue module (r = 0.65, P < 1e−200; Fig. 6c), indicating that this module is highly correlated with M2-like TAMs. The hub genes from the blue module were subjected to a univariate Cox proportional hazards model. The volcano plot revealed that with a P value threshold for Cox regression analysis of less than 0.01, 146 candidates were filtered out (Fig. 6d) (Supplementary material 1). The TAM-related gene signature was used to calculate a prognostic risk score. The protection score was calculated for each patient using the PCA method (Fig. 6e). The protection score was calculated with the expression level of each gene and the PCA score. The Kaplan–Meier plot revealed that patients with a high protection score had a better prognosis than patients with a low protection score in the TCGA TNBC cohort (HR = 0.11, P < 0.001) (Fig. 6F). To further validate the ability of the TAM-related gene signature to predict RFS in TNBC patients, we applied the TAM-related gene signature-based protection score to an external validation cohort (Fig. 6g). Cox regression analysis revealed a predictive value of the TAM-related gene signature in a pooled GEO cohort (HR = 0.56, P = 0.033). ssGSEA was performed to identify the potential mechanism behind the TAM-related gene signature, revealing a high negative association of bile acid metabolism, oestrogen response and P53 pathway with the TAM-related protection score (Fig. 6H).
Table 2.
TNBC patient information (bulk RNA-seq)
| Variable | Proportion (%) |
|---|---|
| AJCC stage | |
| Stage I | 18 |
| Stage II | 62 |
| Stage III-IV | 20 |
| Lymph node metastasis | |
| Positive | 35 |
| Negative | 65 |
| Age | |
| < 60 | 69 |
| ≥ 60 | 31 |
Fig. 6.
Bulk RNA-seq analysis reveals high TAMs associated with poor prognosis in TNBC patients. a Kaplan–Meier analysis showed that TNBC patients with higher TAM abundance exhibited unfavourable RFS. b The blue module depicting the highest correlation (r = − 0.58) with TAM abundance was considered the “TAM-related module”. c The gene significance and module membership of the genes in the blue module exhibited a high correlation. d A total of 146 TAM-related genes were identified amongst the hub genes extracted from the blue module. e PCA analysis of the 146 TAM-related genes. f Kaplan–Meier analysis showed that the PCA-based protective score serves as a promising biomarker in predicting RFS in the TCGA TNBC cohort. g Validation of the predictive effect of in external GEO pooled cohorts. h ssGSEA reveals the potential biology principles behind the score
Molecular classification by the TAM-related gene signature
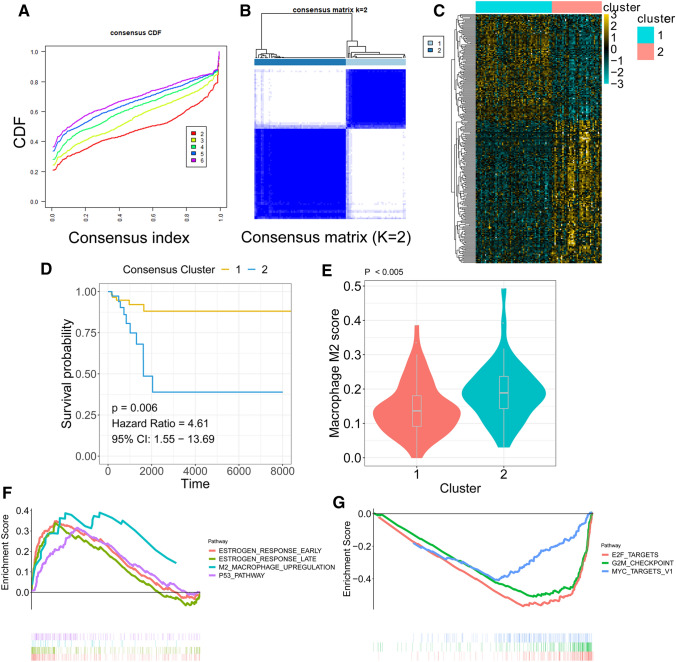
K-means-based consensus clustering was performed to classify TNBC into different subgroups according to the expression patterns of the TAM-related gene signature. The cumulative distribution function (CDF) plot showed the CDF of the consensus matrix for each k (from 2 to 6, indicated by colours), which is a quantification of how entries of the consensus matrix are distributed within a range from 0 to 1 (Fig. 7a). Then, we chose k = 2 as an optimal parameter to divide the training cohort into different subgroups (adjusted P value < 0.05 & log2 (FC) > 1.5) (Fig. 7b). The heatmap indicated the differentially expressed genes between the two clusters (Fig. 7c). The Kaplan–Meier plot revealed that patients within cluster 1 had a better prognosis than patients within cluster 2 (Fig. 7d). The violin plot showed that TAM scores were significantly elevated in cluster 2 compared to cluster 1 (P < 0.005; Fig. 7e). GSEA was performed on cluster one over cluster two of TNBCs. Upregulated pathways included pathways related to oestrogen response early, oestrogen response late, M2 macrophage upregulation, and p53 pathway in subtype one (Fig. 7f). Downregulated pathways included pathways related to E2F targets, G2M checkpoints and MYC targets in subtype one (Fig. 7g).
Fig. 7.
Molecular subtype identification according to the TAM-related gene signature. a CDF plot showing the cumulative distribution functions of the consensus matrix for each k (from 2 to 6, indicated by colours). b Consensus matrix c The DEGs between the 2 molecular subtypes. d Kaplan–Meier analysis showed that TNBC patients within cluster 2 exhibited unfavourable RFS. e Violin plots showed that TAM abundance was differentially distributed in identified subgroups. f Upregulated hallmarks in the GSEA. g Downregulated hallmarks in the GSEA
Feature importance ranking by a random forest algorithm and SVM algorithm revealed the most important genes related to the M2-like TAM score
The association between the M2-like TAM score and genes in the TAM-related gene signature was investigated by a random forest algorithm and SVM algorithm (Supplementary material 2). The feature importance ranking method was applied both in the random forest algorithm and SVM algorithm. The top 50 most important genes associated with the M2 like-TAM score were extracted and overlapped. Supplementary material 2 shows 19 genes shared by both the random forest algorithm and SVM algorithm. The detailed relationship of the 19 most important genes associated with M2 like-TAM scores with RFS of TNBC is shown in Supplementary material 2. VIPR1, ABCD4, SLC40A1, and SCNN1A were found to be poor prognostic factors, whereas the other 15 genes were associated with better RFS.
TAM-related gene signature predicts the immunotherapy response
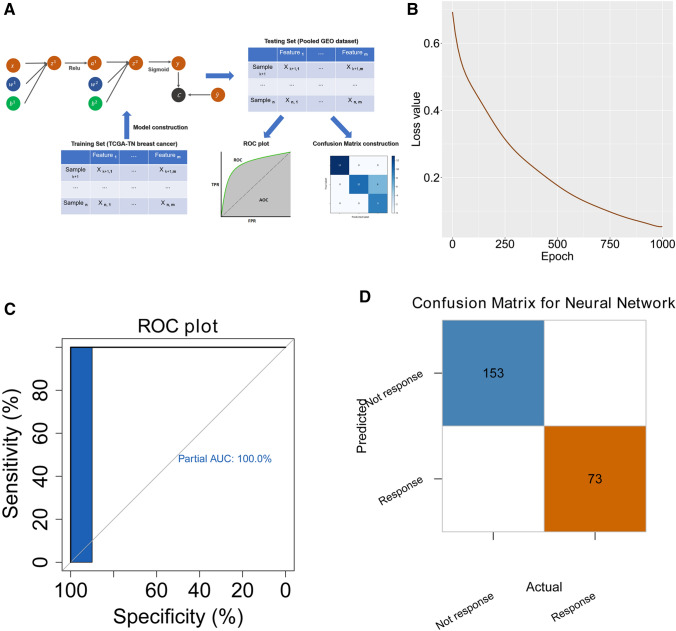
A neural network-based model was built to predict the response to immunotherapy by the TAM-related gene signature. The construction of the neural network is shown in Fig. 8a. The TCGA TNBC cohort was applied as the training set whilst the pooled GEO cohort was used as a testing set to evaluate the accuracy. The loss value of the testing set decreased with the increasing of epoch during training process, indicating the high efficiency of training process (Fig. 8b). When the epoch number reached 1000 for training, all samples were recognized correctly in the testing set using the confusion matrix (Fig. 8c). The area under the curve (AUC) reaching 100% in the receiver operating characteristic (ROC) plot (Fig. 8d).
Fig. 8.
Neural network-based deep learning framework construction with the TAM-related gene signature. a Schematic diagram of the neural network. The TCGA TNBC cohort was used to train the model, whilst the pooled GEO TNBC cohort was used to test the accuracy of the model. b The model loss decreased with the increased training epoch in the testing set. c The confusion matrix in the testing cohort validated the accuracy of the network’s prediction capacity. d The ROC plot in the testing dataset validated the accuracy of the network’s prediction capacity
Discussion
Using the retrieved single-cell RNA-seq and bulk RNA-seq data, the inter- and intra-tumour heterogeneity was analysed separately for tumour cells and tumour-infiltrating immune cells, which together characterized the molecular signature of TN breast tumour tissues. In tumour cells, a high correlation of angiogenesis, stemness and EMT was found at the single-cell level, and a subset of cells with concurrent high expression was identified. We also revealed dynamic immune cell activities and a signature of immune repressors coupled with a high fraction of TAMs in TNBC.
TNBC exhibits a distinct pattern of recurrence compared to other molecular subtypes of breast cancer [1]. This pattern is characterized by a rapidly rising recurrence rate in the first 2 years following diagnosis, a peak at 2–3 years followed by a decline in recurrence risk over the next 5 years [1]. The recurrence of TNBC is tightly linked with angiogenesis, EMT and stemness. Compared with non-TNBC patients, patients with TNBC had significantly higher intra-tumoral VEGF levels and significantly shorter RFS with a shorter time from diagnosis to relapse and from relapse to death [25]. Moreover, aberrant activation of EMT is associated with tumour aggressiveness, progression and increased relapse in TNBC [26]. Increased cancer cell stemness activity drives recurrence, metastasis and poor clinical outcome in TNBC. To date, most studies analyse the activity of EMT, stemness and angiogenesis in tumours at the bulk transcriptome level. One study revealed a high correlation of angiogenesis, stemness and EMT in breast cancer at the single-cell level (EMT and stemness: r = 0.43; angiogenesis and stemness: r = 0.17, angiogenesis and EMT: r = 0.451) [2]. By combining two single-cell RNA-seq datasets after removing the batch effects, we concluded that despite high intro- and inter-tumour heterogeneity in tumour cells, a strong correlation of these three signatures was found in TNBC (EMT and stemness: r = 0.65; angiogenesis and stemness: r = 0.65, angiogenesis and EMT: r = 0.58). This result is consistent with the previous study from Woosung et al. [2]. The stronger correlation of these three signatures than the correlation of signatures from whole breast cancer types may drive the more metastatic phenotype and high incidence of relapse in TNBC. One study revealed that the failure to eliminate viable tumour cells in TNBC is strongly associated with poor survival outcomes in TNBC than in oestrogen receptor-positive breast cancer [5]. Therefore, the elimination of most fractions of bulk tumour tissues may not be effective for curing TNBC. A subset of tumour cells with high metastatic activity may drive the process, multi-site metastasis and high incidence of relapse in TNBC. In our analysis, a subset of cells with concurrent high EMT, stemness and angiogenesis was identified at the single-cell level. This subset may be responsible for the metastasis and high incidence of relapse in TNBC.
Cancer cells have the ability to adapt and circumvent the immune system, which has been found to be a hallmark of cancer [27]. Tumour-infiltrating immune cells play crucial roles in tumour progression by inhibiting or promoting malignancy. Understanding the molecular mechanism of tumour-infiltrating immune cells may be helpful for immunotherapy. The presence of T-cell infiltration and PD-L1 expression can categorize cancers into four different tumour microenvironments and aid in tailoring cancer immunotherapeutic modules [28]. In TNBC, T-cell infiltration showed inter- and intra-tumour heterogeneity. A number of checkpoint molecules, such as TIGIT and LAG3, were highly expressed in some T cells, which may be targets for checkpoint blockade-based therapy.
M2-like TAMs were significantly upregulated in TNBC. The typical gene signatures of M2-like TAMs, such as MS4A6A and PLAUR, were aberrantly expressed in macrophages in TNBC tumour tissues. Thus, we explored the association of M2-like TAM density and RFS. The results showed that high M2-like TAM density was correlated with poor RFS in TNBC. Some studies have shown the link between high TAM densities and EMT activities amongst different cancers [29–31]. One study revealed that TAMs can induce EMT through TGF-β1 signalling and promote cancer stemness in hepatocellular carcinoma cells [32]. In our analysis, M2-like TAMs accounted for a large proportion of macrophages in TNBC. There may be crosstalk between high EMT, angiogenesis, stemness activities and TAM densities in TNBC, which still needs further experimental validation.
A TAM-related gene signature was established through several computational methods. The prognostic value of the TAM-related gene signature was evaluated in cohorts across different platforms. Moreover, the TAM-related gene signature also exhibited the ability to stratify patients into two clusters that had different RFS outcomes and M2-like TAM densities, which further confirms the association between M2-like TAMs and the TAM-related gene signature. Two commonly used machine learning methods, random forest and SVM, were applied to find the genes that were mostly associated with TAM densities in the gene signature. Several genes, VIPR1, ABCD4, SLC40A1, and SCNN1A were found to be poor prognostic factors. These four genes are involved in metabolic change [33–36]. In the previous analysis, we also identified the negative correlation between the TAM-related gene signature and metabolism, which implies the potential association between TAM and metabolism change in TNBC.
M2-like TAMs are immunosuppressive, preventing breast tumour cell attack by T cells and natural killer cells during tumour progression and after recovery from chemo- or immunotherapy [37]. Ablation or repolarization of M2-like TAMs may be beneficial in cancer therapy [38]. Several clinical trials target CSF1R signalling as a means of removing macrophage protumour activity [39, 40]. However, macrophage-targeting methods may have systemic toxicities as the target effects are exerted on all types of macrophages. In more recent days, sophisticated therapies that only target TAMs will become possible. To achieve this, a clear definition of macrophage types in cancer is urgently needed to advance TAM-targeted therapy. Another promising approach is to enhance immunotherapy by removing the immunosuppressive activities of TAMs. Several strategies that can be combined to improve antitumour immunotherapy were developed by inhibiting regulatory T-cell mechanisms using neutralizing anti-PD1, -PD-L1, or -CTLA4 antibodies [41]. Overall, a clear definition of the immunoregulatory mechanism in TAMs allows the development of novel immunotherapies. In our analysis, we clarified that M2-like TAMs account for most macrophages in TNBC at the single-cell level, which may help further mechanistic studies and the development of immunotherapy for TNBC. Furthermore, we built a neural network based on the identified M2-like TAM-related signature to predict the response to immunotherapy in TNBC. Remarkably, the M2-like TAM-related signature-based neural network showed 100% accuracy in the testing set. The results highlighted the importance of M2-like TAMs for immunotherapy efficiency in TNBC treatment, which is consistent with the idea that M2-like TAMs are attractive targets in immunotherapy for cancer treatment.
Some limitations in our study should be acknowledged. First, this is a retrospective study, so the clinical value of the TAM-related gene signature needs further validation in prospectively designed clinical trials. Second, experimental studies are required to further elucidate the biological functions underlying TAMs in early stage LUAD. Large, well-designed prospective population-based studies should be conducted to investigate the complex role of TAMs and verify our results on the TAM-related signature. The potential crosstalk and molecular interactions between TAMs, EMT, angiogenesis, and stemness in TNBC require further experimental study.
In summary, we determined that both tumour cells and immune cell populations are the source of inter- and intra-tumour heterogeneity in TNBC. A high correlation between EMT, angiogenesis, and stemness was found at the single-cell level. M2-like TAMs are associated with unfavourable RFS in TNBC patients. A M2-like TAM-related gene signature was established to predict RFS in TNBC patients. Several genes that were highly associated with M2-like TAM scores were found by SVM and random forest algorithms. A neural network was built to predict the immunotherapy response with the M2-like TAM-related gene signature. We hope that the combination analysis of single-cell RNA-seq and bulk RNA-seq may help the development of a new generation of immune therapeutics and precision treatment in TNBC.
Electronic supplementary material
Below is the link to the electronic supplementary material.
Acknowledgements
We greatly thank the China Scholarship Council (CSC) for supporting the research and work of Xuanwen Bao (No. 201608210186), Tianyu Zhao (No. 201708120056) and Run Shi (No. 201708320347). We would like to thank Haowen Deng for helpful discussions and suggestions in building the neural network framework.
Author contributions
WJF and Michael Rosemann conceived and designed the experiments. XWB and RS performed the analysis. XWB, MR and YFW wrote the paper. NA, TYZ, Michael Rosemann, WJ.F and YFW reviewed the draft. All authors read and approved the final manuscript.
Funding
This research received no specific grant from any funding agency in the public, commercial, or not-for-profit sectors.
Availability of data and material
All the data used in this study can be found in TCGA and GEO database. All presented data in this study are available from the corresponding author upon reasonable request.
Compliance with ethical standards
Conflict of interest
The authors declare that there are no conflicts of interest.
Ethics approval and consent to participate
This study is based on published or public datasets and does not include new data that require ethical approval and consent.
Informed consent
All authors reviewed and approved the manuscript.
Footnotes
Publisher's Note
Springer Nature remains neutral with regard to jurisdictional claims in published maps and institutional affiliations.
Xuanwen Bao and Run Shi contributed equally to the manuscript.
Contributor Information
Michael Rosemann, Email: rosemann@helmholtz-muenchen.de.
Weijia Fang, Email: weijiafang@zju.edu.cn.
References
- 1.Foulkes WD, Smith IE, Reis-Filho JS. Triple-negative breast cancer. N Engl J Med. 2010;363(20):1938–1948. doi: 10.1056/NEJMra1001389. [DOI] [PubMed] [Google Scholar]
- 2.Chung W, Eum HH, Lee H-O, Lee K-M, Lee H-B, Kim K-T, et al. Single-cell RNA-seq enables comprehensive tumour and immune cell profiling in primary breast cancer. Nat Commun. 2017;8(1):1–12. doi: 10.1038/s41467-016-0009-6. [DOI] [PMC free article] [PubMed] [Google Scholar]
- 3.Shah SP, Roth A, Goya R, Oloumi A, Ha G, Zhao Y, et al. The clonal and mutational evolution spectrum of primary triple-negative breast cancers. Nature. 2012;486(7403):395–399. doi: 10.1038/nature10933. [DOI] [PMC free article] [PubMed] [Google Scholar]
- 4.Karaayvaz M, Cristea S, Gillespie SM, Patel AP, Mylvaganam R, Luo CC, et al. Unravelling subclonal heterogeneity and aggressive disease states in TNBC through single-cell RNA-seq. Nat Commun. 2018;9(1):1–10. doi: 10.1038/s41467-018-06052-0. [DOI] [PMC free article] [PubMed] [Google Scholar]
- 5.Liedtke C, Mazouni C, Hess KR, André F, Tordai A, Mejia JA, et al. Response to neoadjuvant therapy and long-term survival in patients with triple-negative breast cancer. J Clin Oncol. 2008;26(8):1275–1281. doi: 10.1200/JCO.2007.14.4147. [DOI] [PubMed] [Google Scholar]
- 6.Hoadley KA, Siegel MB, Kanchi KL, Miller CA, Ding L, Zhao W, et al. Tumor evolution in two patients with basal-like breast cancer: a retrospective genomics study of multiple metastases. PLoS Med. 2016;13(12):e1002174. doi: 10.1371/journal.pmed.1002174. [DOI] [PMC free article] [PubMed] [Google Scholar]
- 7.Loi S, Sirtaine N, Piette F, Salgado R, Viale G, Van Eenoo F, et al. Prognostic and predictive value of tumor-infiltrating lymphocytes in a phase III randomized adjuvant breast cancer trial in node-positive breast cancer comparing the addition of docetaxel to doxorubicin with doxorubicin-based chemotherapy: BIG 02-98. J Clin Oncol. 2013;31(7):860–867. doi: 10.1200/JCO.2011.41.0902. [DOI] [PubMed] [Google Scholar]
- 8.Keren L, Bosse M, Marquez D, Angoshtari R, Jain S, Varma S, et al. A structured tumor-immune microenvironment in triple negative breast cancer revealed by multiplexed ion beam imaging. Cell. 2018;174(6):1373–87.e19. doi: 10.1016/j.cell.2018.08.039. [DOI] [PMC free article] [PubMed] [Google Scholar]
- 9.Brown SD, Warren RL, Gibb EA, Martin SD, Spinelli JJ, Nelson BH, et al. Neo-antigens predicted by tumor genome meta-analysis correlate with increased patient survival. Genome Res. 2014;24(5):743–750. doi: 10.1101/gr.165985.113. [DOI] [PMC free article] [PubMed] [Google Scholar]
- 10.Bao X, Shi R, Zhang K, Xin S, Li X, Zhao Y, et al. Immune landscape of invasive ductal carcinoma tumor microenvironment identifies a prognostic and immunotherapeutically relevant gene signature. Front Oncol. 2019;9:903. doi: 10.3389/fonc.2019.00903. [DOI] [PMC free article] [PubMed] [Google Scholar]
- 11.Bao X, Anastasov N, Wang Y, Rosemann M. A novel epigenetic signature for overall survival prediction in patients with breast cancer. J Transl Med. 2019;17(1):380. doi: 10.1186/s12967-019-2126-6. [DOI] [PMC free article] [PubMed] [Google Scholar]
- 12.Leek JT, Johnson WE, Parker HS, Jaffe AE, Storey JD. The sva package for removing batch effects and other unwanted variation in high-throughput experiments. Bioinformatics. 2012;28(6):882–883. doi: 10.1093/bioinformatics/bts034. [DOI] [PMC free article] [PubMed] [Google Scholar]
- 13.Butler A, Hoffman P, Smibert P, Papalexi E, Satija R. Integrating single-cell transcriptomic data across different conditions, technologies, and species. Nat Biotechnol. 2018;36(5):411–420. doi: 10.1038/nbt.4096. [DOI] [PMC free article] [PubMed] [Google Scholar]
- 14.Hänzelmann S, Castelo R, Guinney J. GSVA: gene set variation analysis for microarray and RNA-seq data. BMC Bioinform. 2013;14(1):7. doi: 10.1186/1471-2105-14-7. [DOI] [PMC free article] [PubMed] [Google Scholar]
- 15.Chen B, Khodadoust MS, Liu CL, Newman AM, Alizadeh AA. Profiling tumor infiltrating immune cells with CIBERSORT. Cancer Syst Biol: Springer; 2018. pp. 243–259. [DOI] [PMC free article] [PubMed] [Google Scholar]
- 16.Langfelder P, Horvath S. WGCNA: an R package for weighted correlation network analysis. BMC Bioinform. 2008;9(1):559. doi: 10.1186/1471-2105-9-559. [DOI] [PMC free article] [PubMed] [Google Scholar]
- 17.Therneau TM, Grambsch PM. Modeling survival data: extending the Cox model. Statistics for Biology and Health. New York, NY: Springer; 2000. The Cox model; pp. 39–77. [Google Scholar]
- 18.Wilkerson MD, Hayes DN. ConsensusClusterPlus: a class discovery tool with confidence assessments and item tracking. Bioinformatics. 2010;26(12):1572–1573. doi: 10.1093/bioinformatics/btq170. [DOI] [PMC free article] [PubMed] [Google Scholar]
- 19.Ritchie ME, Phipson B, Wu DI, Hu Y, Law CW, Shi W, Smyth GK. limma powers differential expression analyses for RNA-sequencing and microarray studies. Nucleic Acids Res. 2015;43(7):e47–e47. doi: 10.1093/nar/gkv007. [DOI] [PMC free article] [PubMed] [Google Scholar]
- 20.Wright MN, Ziegler A (2015) Ranger: a fast implementation of random forests for high dimensional data in C ++ and R. arXiv preprint arXiv:150804409 [DOI] [PMC free article] [PubMed]
- 21.Liaw A, Wiener M. Classification and regression by randomForest. R News. 2002;2(3):18–22. [Google Scholar]
- 22.Dimitriadou E, Hornik K, Leisch F, Meyer D, Weingessel A (2008) Misc functions of the Department of Statistics (e1071), TU Wien. R package, vol 1, pp 5–24. https://www.researchgate.net/profile/Friedrich_Leisch/publication/221678005_E1071_Misc_Functions_of_the_Department_of_Statistics_E1071_TU_Wien/links/547305880cf24bc8ea19ad1d/E1071-Misc-Functions-of-the-Department-of-Statistics-E1071-TU-Wien.pdf
- 23.Paszke A, Gross S, Chintala S, Chanan G, Yang E, DeVito Z, et al (2017) Automatic differentiation in pytorch
- 24.Tsai CH, Chiu JH, Yang CW, Wang JY, Tsai YF, Tseng LM, et al. Molecular characteristics of recurrent triple-negative breast cancer. Mol Med Rep. 2015;12(5):7326–7334. doi: 10.3892/mmr.2015.4360. [DOI] [PMC free article] [PubMed] [Google Scholar]
- 25.Linderholm B, Hellborg H, Johansson U, Elmberger G, Skoog L, Lehtiö J, et al. Significantly higher levels of vascular endothelial growth factor (VEGF) and shorter survival times for patients with primary operable triple-negative breast cancer. Ann Oncol. 2009;20(10):1639–1646. doi: 10.1093/annonc/mdp062. [DOI] [PubMed] [Google Scholar]
- 26.Bulfoni M, Gerratana L, Del Ben F, Marzinotto S, Sorrentino M, Turetta M, et al. In patients with metastatic breast cancer the identification of circulating tumor cells in epithelial-to-mesenchymal transition is associated with a poor prognosis. Breast Cancer Res. 2016;18(1):30. doi: 10.1186/s13058-016-0687-3. [DOI] [PMC free article] [PubMed] [Google Scholar]
- 27.Hanahan D, Weinberg RA. Hallmarks of cancer: the next generation. Cell. 2011;144(5):646–674. doi: 10.1016/j.cell.2011.02.013. [DOI] [PubMed] [Google Scholar]
- 28.Teng MW, Ngiow SF, Ribas A, Smyth MJ. Classifying cancers based on T-cell infiltration and PD-L1. Cancer Res. 2015;75(11):2139–2145. doi: 10.1158/0008-5472.CAN-15-0255. [DOI] [PMC free article] [PubMed] [Google Scholar]
- 29.Su S, Liu Q, Chen J, Chen J, Chen F, He C, et al. A positive feedback loop between mesenchymal-like cancer cells and macrophages is essential to breast cancer metastasis. Cancer Cell. 2014;25(5):605–620. doi: 10.1016/j.ccr.2014.03.021. [DOI] [PubMed] [Google Scholar]
- 30.Gwak JM, Jang MH, Kim DI, Seo AN, Park SY. Prognostic value of tumor-associated macrophages according to histologic locations and hormone receptor status in breast cancer. PloS One. 2015;10(4):e0125728. doi: 10.1371/journal.pone.0125728. [DOI] [PMC free article] [PubMed] [Google Scholar]
- 31.Shirabe K, Mano Y, Muto J, Matono R, Motomura T, Toshima T, et al. Role of tumor-associated macrophages in the progression of hepatocellular carcinoma. Surg Today. 2012;42(1):1–7. doi: 10.1007/s00595-011-0058-8. [DOI] [PubMed] [Google Scholar]
- 32.Yang Z, Xie H, He D, Li L. Infiltrating macrophages increase RCC epithelial mesenchymal transition (EMT) and stem cell-like populations via AKT and mTOR signaling. Oncotarget. 2016;7(28):44478. doi: 10.18632/oncotarget.9873. [DOI] [PMC free article] [PubMed] [Google Scholar]
- 33.Ruchat S-M, Houde A-A, Voisin G, St-Pierre J, Perron P, Baillargeon J-P, et al. Gestational diabetes mellitus epigenetically affects genes predominantly involved in metabolic diseases. Epigenetics. 2013;8(9):935–943. doi: 10.4161/epi.25578. [DOI] [PMC free article] [PubMed] [Google Scholar]
- 34.Coelho D, Kim JC, Miousse IR, Fung S, du Moulin M, Buers I, et al. Mutations in ABCD4 cause a new inborn error of vitamin B 12 metabolism. Nat Genet. 2012;44(10):1152–1155. doi: 10.1038/ng.2386. [DOI] [PubMed] [Google Scholar]
- 35.Donovan A, Lima CA, Pinkus JL, Pinkus GS, Zon LI, Robine S, et al. The iron exporter ferroportin/Slc40a1 is essential for iron homeostasis. Cell Metab. 2005;1(3):191–200. doi: 10.1016/j.cmet.2005.01.003. [DOI] [PubMed] [Google Scholar]
- 36.Goulart AC, Rexrode KM, Cheng S, Rose L, Buring JE, Ridker PM, et al. Association of genetic variants with the metabolic syndrome in 20,806 white women: the women’s health genome study. Am Heart J. 2009;158(2):257–62.e1. doi: 10.1016/j.ahj.2009.05.015. [DOI] [PMC free article] [PubMed] [Google Scholar]
- 37.Noy R, Pollard JW. Tumor-associated macrophages: from mechanisms to therapy. Immunity. 2014;41(1):49–61. doi: 10.1016/j.immuni.2014.06.010. [DOI] [PMC free article] [PubMed] [Google Scholar]
- 38.Tariq M, Zhang J, Liang G, Ding L, He Q, Yang B. Macrophage polarization: anti-cancer strategies to target tumor-associated macrophage in breast cancer. J Cell Biochem. 2017;118(9):2484–2501. doi: 10.1002/jcb.25895. [DOI] [PubMed] [Google Scholar]
- 39.Strachan DC, Ruffell B, Oei Y, Bissell MJ, Coussens LM, Pryer N, et al. CSF1R inhibition delays cervical and mammary tumor growth in murine models by attenuating the turnover of tumor-associated macrophages and enhancing infiltration by CD8 + T cells. Oncoimmunology. 2013;2(12):e26968. doi: 10.4161/onci.26968. [DOI] [PMC free article] [PubMed] [Google Scholar]
- 40.Zhu Y, Knolhoff BL, Meyer MA, Nywening TM, West BL, Luo J, et al. CSF1/CSF1R blockade reprograms tumor-infiltrating macrophages and improves response to T-cell checkpoint immunotherapy in pancreatic cancer models. Cancer Res. 2014;74(18):5057–5069. doi: 10.1158/0008-5472.CAN-13-3723. [DOI] [PMC free article] [PubMed] [Google Scholar]
- 41.Seidel JA, Otsuka A, Kabashima K. Anti-PD-1 and anti-CTLA-4 therapies in cancer: mechanisms of action, efficacy, and limitations. Front Oncol. 2018;8:86. doi: 10.3389/fonc.2018.00086. [DOI] [PMC free article] [PubMed] [Google Scholar]
Associated Data
This section collects any data citations, data availability statements, or supplementary materials included in this article.
Supplementary Materials
Data Availability Statement
All the data used in this study can be found in TCGA and GEO database. All presented data in this study are available from the corresponding author upon reasonable request.


