Abstract
The tumor immune microenvironment plays essential roles in regulating inflammation, angiogenesis, immune modulation, and sensitivity to therapies. Here, we developed a powerful prognostic signature with immune-related lncRNAs (irlncRNAs) in lung adenocarcinoma (LUAD). We obtained differentially expressed irlncRNAs by intersecting the transcriptome dataset for The Cancer Genome Atlas (TCGA)-LUAD cohort and the ImmLnc database. A rank-based algorithm was applied to select top-ranking altered irlncRNA pairs for the model construction. We built a prognostic signature of 33 irlncRNA pairs comprising 40 unique irlncRNAs in the TCGA-LUAD cohort (training set). The immune signature significantly dichotomized LUAD patients into high- and low-risk groups regarding overall survival, which is likewise independently predictive of prognosis (hazard ratio = 3.580, 95% confidence interval = 2.451–5.229, P < 0.001). A nomogram with a C-index of 0.79 demonstrates the superior prognostic accuracy of the signature. The prognostic accuracy of the signature of 33 irlncRNA pairs was validated using the GSE31210 dataset (validation set) from the Gene Expression Omnibus database. Immune cell infiltration was calculated using ESTIMATE, CIBERSORT, and MCP-count methodologies. The low-risk group exhibited high immune cell infiltration, high mutation burden, high expression of CTLA4 and human leukocyte antigen genes, and low expression of mismatch repair genes, which predicted response to immunotherapy. Interestingly, pRRophetic analysis demonstrated that the high-risk group possessed reverse characteristics was sensitive to chemotherapy. The established immune signature shows marked clinical and translational potential for predicting prognosis, tumor immunogenicity, and therapeutic response in LUAD.
Supplementary Information
The online version contains supplementary material available at 10.1007/s00262-021-03069-1.
Keywords: NSCLC, IrlncRNA pair, Prognosis, Signature, Nomogram
Introduction
As reported by the GLOBOCAN 2018 estimates of cancer incidence and mortality, lung cancer remains the most commonly diagnosed cancer and the leading cause of cancer death, accounting for 11.6% of the total cases and 18.4% of the total cancer deaths, respectively [1]. The 5-year survival rate is 57% for stage I patients but 4% for those with stage IV disease in the USA [2]. The high incidence and mortality of lung cancer have evoked intensive efforts in understanding its tumor biology and developing new therapies. Thus far, the treatment of lung cancer has revolutionized from the empirical use of cytotoxic therapy to personalized medicine, i.e., subgroups of patients receive treatment based on the genetic alterations of their tumor (e.g., mutations in the Kirsten rat sarcoma (KRAS) and epidermal growth factor receptor (EGFR) genes, and EML4-ALK fusion gene).
Besides therapies targeting oncogenic drivers, the emerging of immunotherapy and remarkably immune checkpoint inhibitors have led to striking clinical improvements. Programmed death receptor 1 (PD-1) and PD-ligand 1 (PD-L1) inhibitors have achieved unprecedented long-term responses in advanced-stage disease, with a 5-year overall survival (OS) of 20% in general and as high as 40% in PD-L1high expressing patients [3]. Therefore, it is essential to preselect patients more likely to benefit from the therapy. Tumor PD-L1 expression has been used as a golden standard biomarker in clinical trials and clinical NSCLC guidelines making. However, quantification of PD-L1 by immunohistochemistry unavoidable suffers from variations results from antibodies of different batches, staining procedures, arbitrary cutoffs. Therefore, more robust and reproducible biomarkers should be identified. Moreover, it should be noted that, like other therapies, most patients who initially respond to ICI therapy eventually experience primary or secondary resistance. Various immunotherapy resistance mechanisms have been investigated. The tumor microenvironment (TME) is implicated in both extrinsic and intrinsic resistance pathways. An improved understanding of the heterogenous TME will lay the foundation for further optimizing therapeutic strategies and stratifying immunotherapy treatment.
Non-coding RNAs (ncRNAs) account for more than 90% of the human genome-derived RNAs. Although having been undervalued for decades, recently, an explosion of researches into ncRNA biology begin to unveil their regulatory significance in physiology and the development of the disease [4]. Long non-coding RNAs (lncRNAs) are ncRNAs longer than 200 nucleotides, which execute heterogeneous functions. For instance, nuclear lncRNAs control gene expression in cis or trans, while cytoplasmic lncRNAs act as miRNA sponges, modulate mRNA translation, and alter protein activity through posttranslational modification [5]. lncRNA also actively participates in regulating the immune system by interacting with DNAs, RNAs, and protein products of immune genes. Many lncRNAs have been implicated in the differentiation and function of immune cells, including dendritic cells (DCs), macrophages, monocytes, myeloid cells, CD8 + T, TH1, TH2, TH17 cells [6]. lncRNA PACER decoyed NF-kB p50 subunits away from the PTGS2 promoter, thereby promoting PTGS2 expression in the monocyte [7]. Linc-MAF-4 stimulates TH1 differentiation by downregulation of MAF [8]. Given the importance of lncRNAs in regulating the immune microenvironment and the high specificity of detection methods, it is valuable to explore the possibility of using immune-related lncRNA (irlncRNAs) novel biomarkers to screen for patients sensitive to immunotherapy or predict prognosis.
This study employed a novel paring modeling algorithm, pairwise lncRNA comparison, to develop a robust prognostic signature of irlncRNA pairs. This personalized prognostic signature is not only an independent predictor of clinical outcomes, but also significantly associated with infiltration of immune cells in TME, chemotherapeutic efficacy, checkpoint gene expression, and mismatch gene expression.
Materials and methods
We retrieved the RNA-Seq dataset for The Cancer Genome Atlas (TCGA) lung adenocarcinoma cohort (https://nci.nih.gov/tcga/) exclusion of patients without clinical information. A total of 569 samples were included in the study, comprising 59 normal and 510 tumor samples. We annotated transcripts with gene transfer format (GTF) files from the Ensembl. Differential expression analyses were performed to identify differentially expressed lncRNAs (|log2FC|> 1.5, P < 0.05) using the edgR package. Moreover, we acquired irlncRNAs from the ImmLnc database (http://bio-bigdata.hrbmu.edu.cn/ImmLnc/) for LUAD [9]. In brief, irLncRNAs were identified across 33 types of cancer by integrating the multi-omics data in TCGA and 17 immunological relevant gene sets downloaded from the ImmPort database (http://www.immport.org). The majority of lncRNAs were correlated with cytokines and cytokine receptors pathway among overall cancer types. The intersection of the LUAD irlncRNAs dataset with upregulated lncRNAs in the TCGA-LUAD cohort was used for the rest of the analysis.
Determination of immune-related lncRNA pairs
The method is inspired by the top-scoring pair (TSP) algorithm, i.e., using a rank-based algorithm screens effective rank-altered gene pairs for classifier construction [10]. We first conferred a score to each DEirlncRNA pair by comparing the DEirlncRNA expression levels in each tumor tissue in a pairwise manner, as previously described [10]. Briefly, an irlncRNA pair score of 1 was designated if irlncRNA 1 was less than irlncRNA 2; if not, the pair score was 0. As a result, a 0-or-1 matrix was generated [9, 10]. Then, we further evaluated the resulting 0-or-1 matrix for discriminative pairs. Some irlncRNA pair might be assigned to constant values (0 or 1) in the dataset for the following reasons: [1] biases caused by a particular platform, and [2] biologically preferential transcription, which is not able to discriminate survival from one patient to another [10]. In other words, an irlncRNA pair with the same score (0 or 1) in more than 80% of samples was considered as noninformative and deleted from the analysis [11]. Furthermore, we screen prognostic DEirlncRNA pair regarding overall survival of LUAD patients, using univariate Cox regression analysis (P < 0.005).
We applied the least absolute shrinkage and selection operator (LASSO) Cox regression analysis (glmnet) to avoid over-fitting, which generated the best risk model of DEirlncRNA pairs. And then, the riskScore was calculated for each patient according to the formula: risk score , in which β and χ depicted coefficient and the 0-or-1 matrix of each DEirlncRNA pair, respectively. We calculated the optimal risk score cutoff based on a time-dependent receiver operating characteristic (ROC) curve (survivalROC) at 1 year.
Validation of the risk score
The optimal risk score was used to divide patients into low- or high-risk groups. The Kaplan–Meier analysis was carried out to evaluate the prognostic value of the risk score derived from the signature of the DEirlncRNA pair, along with the log-rank test. The risk score was calculated and visualized for each patient. Moreover, using the survival and rms package for R [12–14], we built a nomogram to assess the individualized survival possibility by combining risk score and clinicopathological characteristics. Calibration curves and decision curves were also plotted. Moreover, the GSE31210 dataset was acquired from the Gene Expression Omnibus (GEO) database for external validation of the prognostic model, consisting of 226 patients with primary stage I–II lung adenocarcinomas [15].
Evaluation of tumor-infiltrating immune cells
Based on the bioinformatic analysis of transcriptomic data, currently, several reliable algorithms are established to quantify the relative proportions of immune infiltrating cells in a single sample, including ESTIMATE [16], MCP-counter [17], and CIBERSORT methods [18, 19]. In this study, we calculated and compared immune infiltrating cell contents between high- and low-risk groups. Briefly, ESTIMATE allowed us to calculate the immune score and ESTIMATE score of each patient. With the MCP-counter method [17], we evaluated the abundance of B cell lineage, CD8 + T cells, cytotoxic lymphocytes, myeloid dendritic cells, monocytic lineage cells, neutrophils, NK cells, T cells, endothelial cells, and fibroblasts. We also evaluated the correlations between the risk score and the immune infiltrated cells, using Spearman correlation analysis (ggplot2). Finally, we adopted CIBERSORT [18, 19] to measure 22 types of immune cells in tissues, consisting of seven T cell types, naïve and memory B cells, plasma cells, NK cells, and myeloid subsets.
Significance of the risk model in the clinical managements
Given the urgent need for biomarkers that can predict drug sensitivity in NSCLC patients, we evaluated the model in the clinic for NSCLC treatment. We first explored the relationship between risk score and immune checkpoint genes with the ggstatsplot package and visualization by violin plot. We computed the IC50 of common administrating chemotherapeutic drugs in the LUAD cohort by taking advantage of pRRophetic [20, 21], an R package predicting clinical chemotherapeutic response based on tumor gene expression levels. The R package, covering almost 700 cell lines and 138 drugs, has shown robustness in predicting response to chemotherapies in different clinical trials [20]. We focused on antitumor drugs such as paclitaxel, gemcitabine, cisplatin, docetaxel, gefitinib, and erlotinib that are frequently used for NSCLC treatment by AJCC guidelines. Wilcoxon signed-rank test was adopted to determine whether the difference in the IC50 between the high and low-risk groups is statistically significant.
Statistical analysis
R software (version 4.0.0; https://www.r-project.org/) was adopted for all statistical analyses. The association between the risk score and the clinicopathological characteristics was determined using the chi-square test, including age, sex, tumor (T), node (N), and metastasis (M). With the Cox proportional hazards regression model, both univariate and multivariate analyses were conducted to assess the association of irlncRNA pair risk score and clinicopathological characteristics with overall survival. The statistical significance level was set at 0.05 unless specified otherwise.
Results
Recognition of differentially expressed irlncRNAs (DEirlncRNAs)
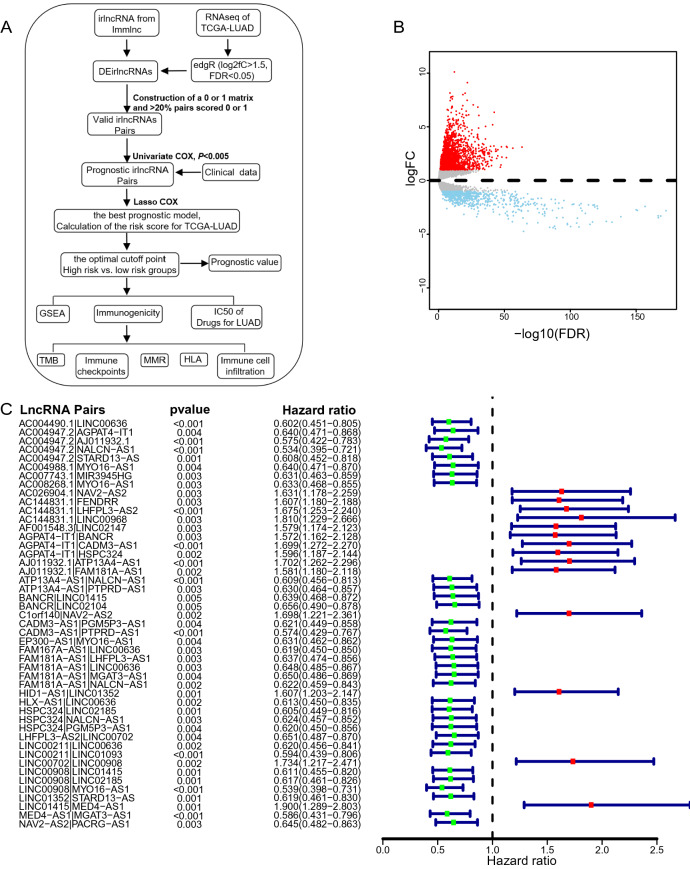
The workflow of the study is shown in Fig. 1A. We first downloaded the transcriptome data of lung adenocarcinoma (LUAD) from The Cancer Genome Atlas (TCGA) database, including 59 normal and 510 tumor samples. After gene annotation, we identified 1,599 differentially expressed lncRNAs (|log2FC|> 1.5, P < 0.05) using the edgR package. Among them, 1,253 and 346 lncRNAs were upregulated and downregulated in tumor samples, respectively, when compared to normal samples (Fig. 1B). Due to the relatively low expression levels of lncRNA, downregulated lncRNAs were removed from the subsequent analyses. Second, we obtained 3,141 irlncRNA for LUAD from the ImmLnc database, which accounts for 40% lncRNAs in this cancer type [9]. We removed downregulated irlncRnAs because lncRNAs that play critical immune regulation roles are supposed to be elevated in immune cells [9]. Overall, 108 lncRNAs in the intersection of upregulated lncRNAs and irlncRNAs datasets were used for the rest of the study (Supplementary Fig. 1).
Fig. 1.
Differentially expressed immune-related lncRNAs and significant irlncRNA pairs in lung carcinoma. A The workflow of the study. B Volcano plot of differentially expressed lncRNAs between normal and tumor tissues in the TCGA cohort. C A forest plot displays the 47 irlncRNA pairs associated with overall survival. Hazard ratio (HR) and 95% CI were calculated by univariate Cox regression analysis
Identification of DEirlncRNA pairs in LUAD cohort
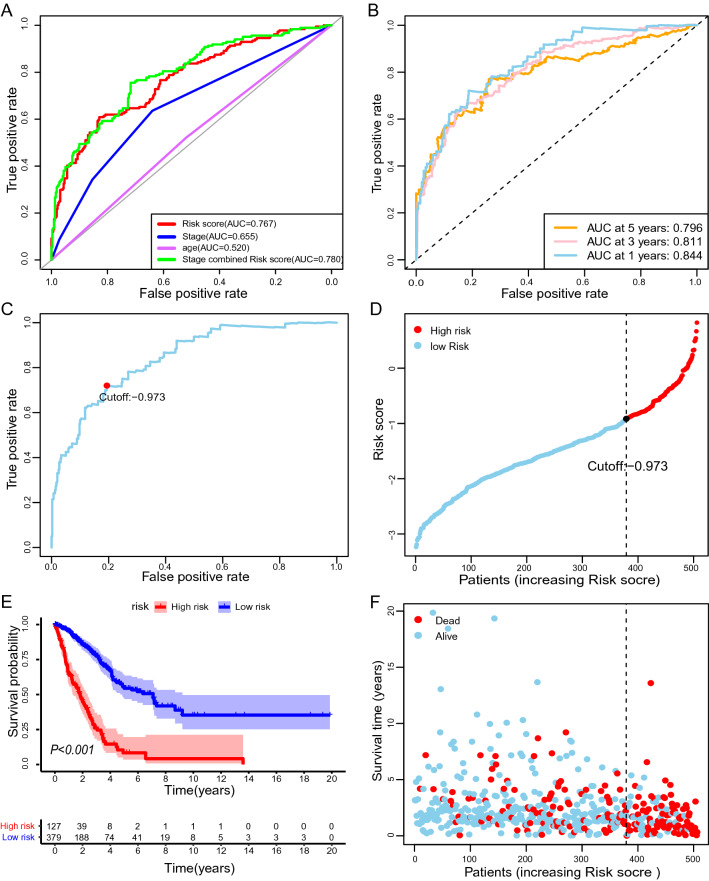
By applying a paring algorithm to the LUAD dataset [22, 23], we identified 2601 effective DEirlncRNA pairs. The advantage of this irlncRNA pair-based approach is obvious. The score is derived entirely from the gene expression profile of a tumor sample. Therefore, it can be applied in a personalized manner without requiring standardization. We tested the association between each DEirlncRNA pair and overall survival of LUAD patients, using univariate Cox regression analysis. As a result, 47 DEirlncRNA pairs significantly associated with survival (P < 0.005) were maintained to build the prognostic signature (Fig. 1C). By using the least absolute shrinkage and selection operator (LASSO) Cox regression analysis, we generated the best risk signature of 33 DEirlncRNA pairs (Supplementary Fig. 2; Table 1). We plotted ROC for risk score, stage, age, and combination of riskScore and stage, and the combined ROC achieved an area under the curve (AUC) of 0.780 (Fig. 2A). The time-dependent ROC indicated that the combination of risk score and stage had the highest ROC of 0.854 at 1 year. Since AUC values of the risk score were 0.844, 0.811, and 0.796 at 1-, 3-, 5-year, respectively (Fig. 2B), 1-year ROC were employed to estimate the cutoff value of the best irlncRNA pair signature. The best cutoff value for irlncRNA pair signatures was -0.973 (Fig. 2C).
Fig. 2.
Prognostic value of the signature of immune-related lncRNA pair. Risk scores were calculated to quantify patient risk for death based on the signature. A ROC curves were plotted to determine AUC values for indicated parameters independently and in combination. B Time-dependent ROC for the risk score. C Determination of the optimal cutoff value of the risk scores, by which patients were separated into high- or low-risk groups. D Kaplan–Meier survival curves of overall survival for high- and low-risk patients. The log-rank test checked the difference in survival between the two groups. Blue and red shadows are 95% CIs. E Every dot indicates survival time and risk score for a patient
Table 1.
Information of immune-related lncRNA pairs
| lncRNA Pairs | lncRNA1 | lncRNA2 | Coefficient |
|---|---|---|---|
| AC004490.1|LINC00636 | AC004490.1 | LINC00636 | − 0.09975 |
| AC004947.2|AGPAT4-IT1 | AC004947.2 | AGPAT4-IT1 | − 0.01822 |
| AC004947.2|AJ011932.1 | AC004947.2 | AJ011932.1 | − 0.028 |
| AC004947.2|NALCN-AS1 | AC004947.2 | NALCN-AS1 | − 0.50559 |
| AC004988.1|MYO16-AS1 | AC004988.1 | MYO16-AS1 | − 0.27389 |
| AC007743.1|MIR3945HG | AC007743.1 | MIR3945HG | − 0.1632 |
| AC026904.1|NAV2-AS2 | AC026904.1 | NAV2-AS2 | 0.37955 |
| AC144831.1|LINC00968 | AC144831.1 | LINC00968 | 0.23193 |
| AF001548.3|LINC02147 | AF001548.3 | LINC02147 | 0.31531 |
| AGPAT4-IT1|BANCR | AGPAT4-IT1 | BANCR | 0.138362 |
| AJ011932.1|ATP13A4-AS1 | AJ011932.1 | ATP13A4-AS1 | 0.196487 |
| ATP13A4-AS1|PTPRD-AS1 | ATP13A4-AS1 | PTPRD-AS1 | − 0.06369 |
| BANCR|LINC01415 | BANCR | LINC01415 | − 0.09072 |
| BANCR|LINC02104 | BANCR | LINC02104 | − 0.08836 |
| C1orf140|NAV2-AS2 | C1orf140 | NAV2-AS2 | 0.302554 |
| CADM3-AS1|PGM5P3-AS1 | CADM3-AS1 | PGM5P3-AS1 | − 0.28241 |
| CADM3-AS1|PTPRD-AS1 | CADM3-AS1 | PTPRD-AS1 | − 0.14808 |
| EP300-AS1|MYO16-AS1 | EP300-AS1 | MYO16-AS1 | − 0.16927 |
| FAM167A-AS1|LINC00636 | FAM167A-AS1 | LINC00636 | − 0.0512 |
| FAM181A-AS1|LHFPL3-AS1 | FAM181A-AS1 | LHFPL3-AS1 | − 0.00358 |
| FAM181A-AS1|NALCN-AS1 | FAM181A-AS1 | NALCN-AS1 | − 0.13321 |
| HID1-AS1|LINC01352 | HID1-AS1 | LINC01352 | 0.416246 |
| HLX-AS1|LINC00636 | HLX-AS1 | LINC00636 | − 0.06195 |
| HSPC324|LINC02185 | HSPC324 | LINC02185 | − 0.20994 |
| HSPC324|PGM5P3-AS1 | HSPC324 | PGM5P3-AS1 | − 0.17898 |
| LINC00211|LINC00636 | LINC00211 | LINC00636 | − 0.19689 |
| LINC00211|LINC01093 | LINC00211 | LINC01093 | − 0.15018 |
| LINC00702|LINC00908 | LINC00702 | LINC00908 | 0.201809 |
| LINC00908|LINC02185 | LINC00908 | LINC02185 | − 0.21216 |
| LINC00908|MYO16-AS1 | LINC00908 | MYO16-AS1 | − 0.08083 |
| LINC01352|STARD13-AS | LINC01352 | STARD13-AS | − 0.105 |
| LINC01415|MED4-AS1 | LINC01415 | MED4-AS1 | 0.1546 |
| MED4-AS1|MGAT3-AS1 | MED4-AS1 | MGAT3-AS1 | − 0.47513 |
Prognostic value of the risk signature
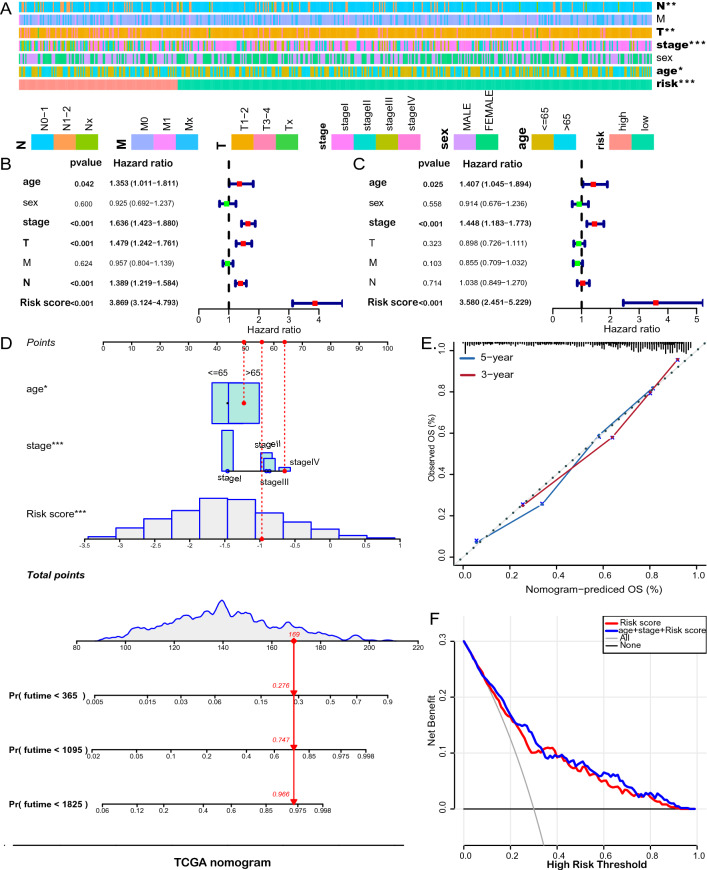
The LUAD patients were divided into the high-risk and low-risk groups by the cutoff value of the risk score (Fig. 2D). Kaplan–Meier survival analysis revealed that the risk scores dichotomized patients into two groups with significantly different overall survival. The patients in the low-risk group had significantly longer survival than those in the low-risk group (Fig. 2E, F). We explored the relationship between the risk score and clinicopathological features and found that T, N, age, and stage were significantly correlated with the risk score (Fig. 3A; Supplementary Fig. 3). Moreover, we conducted both univariate (Fig. 3B) and multivariate (Fig. 3C) Cox analyses to assess the association of and clinicopathological characteristics with overall survival. The risk score of irlncRNA pair signature was an independent prognostic factor in LUAD [Hazard ratio (HR) and 95% confidence interval (CI) = 3.580 (2.451–5.229), P < 0.001]. We constructed a nomogram based on the risk score of the irlncRNA pair signature and clinical variables of the LUAD cohort (TNM stage and age). The C-index of the nomogram is 0.7903 (Fig. 3D). The calibration curve showed that the line chart has a good predictive ability to evaluate patients' survival (Fig. 3E). Moreover, the decision curve analysis (DCA) showed that the risk scores outperformed the stage in predicting overall survival, as demonstrated by the distinct net benefits (Fig. 3F).
Fig. 3.
Clinical relevance of the prognostic signature. A The association between risk stratification and clinical characteristics. Univariate (B) and multivariate (C) Cox regression analyses were performed with additional clinicopathological predictors. D A nomogram was built to predict individuals’ probability of survival. E Calibration curve. F Decision curve analysis indicates the net benefit of risk score and other clinicopathologic parameters across probability thresholds in comparison with all or none. The gray line is the net benefit if all patients are alive, while the black line is the net benefit if all patients are dead. The preferred model is the one with the highest net benefit at given thresholds
Validation of prognostic value of the signature of 33 irlncRNA pairs with GSE 31210 LUAD cohort
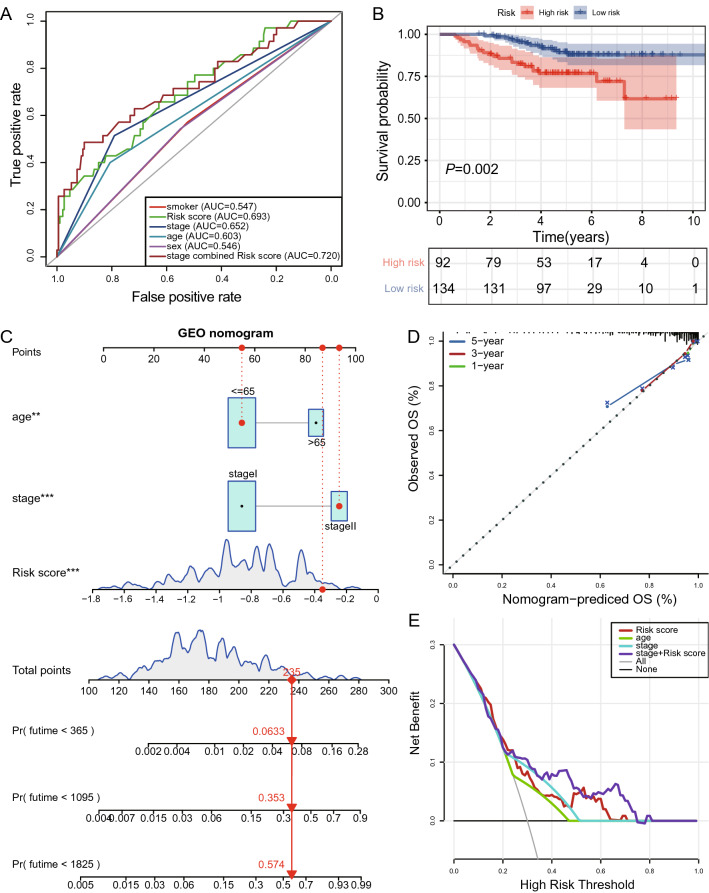
To testify the prognostic accuracy of the signature of 33 irlncRNA pairs in different LUAD cohorts, we downloaded the GSE31210 dataset from GEO for validation. This cohort was composed of 226 patients with primary stage I–II lung adenocarcinomas. Tumor samples of all these patients were subjected to Affymetrix U133Plus2.0 arrays [15]. As shown in Fig. 4A, the combination of stage and risk score achieved an AUC of 0.720 compared to 0.652 for stage and 0.693 for risk score. Patients with low risk showed significantly better prognoses than those with high-risk scores (Fig. 4B; Supplementary Fig. 4). The risk score was also able to predict prognosis in this LUAD cohort independently. By employing nomogram analysis, we obtained a C-index of 0.7802, suggesting the robustness of this prognostic signature (Fig. 4C, d). Furthermore, DCA revealed the greatest net benefits for combining risk score with the TNM stage (Fig. 4E).
Fig. 4.
Validation of the signature of immune-related lncRNA pairs with the GSE31210 dataset. A Assessment of the predictive accuracy of the signature using the ROC curve and AUC. B Kaplan–Meier survival curves showed better overall survival for low-risk patients. C Risk estimate by a nomogram incorporating risk score and clinical feature. D Calibration curve. E Decision curve analysis
Estimation of the association of tumor-infiltrating immune cells with the risk model
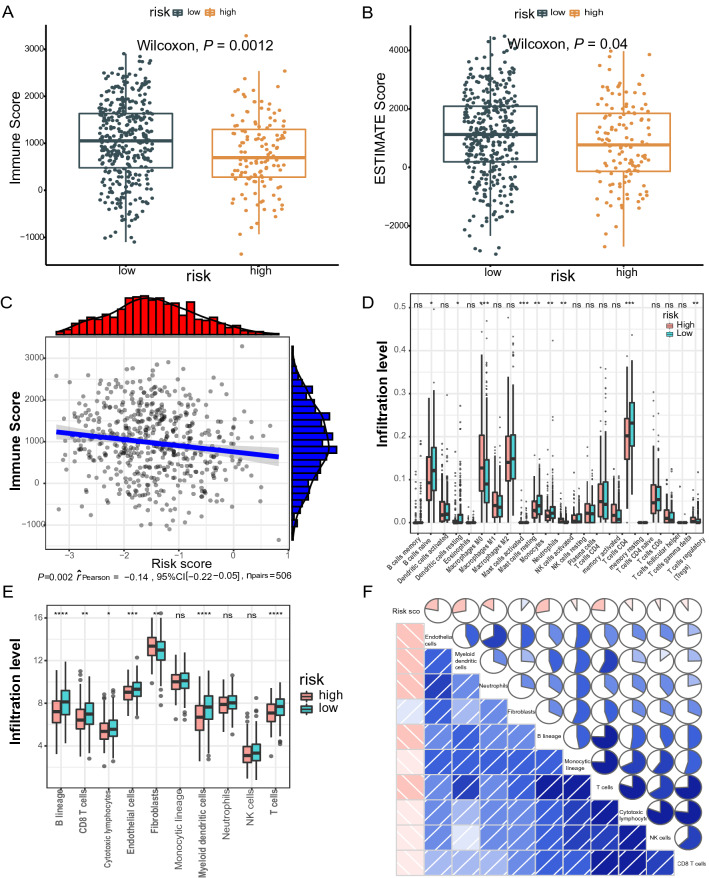
Since the signature of irlncRNA pairs was initially derived from immune-related lncRNAs, it is essential to compare the differences in tumor-infiltrating immune cells between groups split by the risk score. First, we calculated the Estimation of STromal and Immune cells in MAlignant Tumor tissues using Expression data (ESTIMATE) score and the immune score of each LUAD sample based on the ESTIMATE algorithm. Both the immune score (779.1 vs. 1036.4) and ESTIMATE score (812.9 vs. 1094.4) significantly decreased in the high-risk group compared with those in the low-risk group (Fig. 5A–C). Second, we used the Cell type identification by estimating relative subsets of RNA transcripts (CIBERSORT) method to further dissect the relative proportion of 22 infiltrating immune cells in each tumor sample. The relative proportions of T cells CD4 memory resting, B cell native, mast cells resting, monocytes and dendritic cells resting was higher in the low-risk group, while the relative proportions of Tregs, mast cell activated, and macrophages M0 in the high-risk group were higher (Fig. 5D). These results show that there are significant differences in immune cell infiltration between high and low-risk groups. Last, we interrogated the abundance of eight immune-related cells and two stromal cells using the microenvironment cell population count (MCP-counter) algorithm. Compared with the high-risk group, the abundance of 7 types of cells (B cell line, CD8 + T cells, endothelial cells, cytotoxic lymphocytes, dendritic cells, fibroblasts, T cells) was significantly elevated in the low-risk group (Fig. 5E). Besides, there was a significant correlation between the degree of immune cell infiltration and IRGP value (Fig. 5F).
Fig. 5.
Comparison of immune microenvironments between high- or low-risk groups defined by the irlncRNA pair signature. ESTIMATE algorithm reveals significantly lower immune (A) and ESTIMATE (B) scores in the high-risk group than in the low-risk group. C The ESTIMATE score is negatively associated with the risk score. D Evaluation of 22 immune cell infiltration using the CIBSORT method. E MCP-coulter revealed differential infiltration levels of indicated cell types between two risk groups, followed by the correlation analysis between the risk score and the cell types (F)
Association of the risk model with immunotherapies
A proportion of NSCLC patients have gained great clinical benefits from immunotherapy, especially immune checkpoint inhibitors. The selection of patients responding to immunotherapy remains challenging. Several types of biomarkers have shown potentials in predicting immunotherapy response, including PD-1/PD-L1 expression, tumor mutational burden (TMB), and a defective DNA mismatch repair (dMMR) system [24]. Therefore, we further examine whether these biomarkers are associated with the signature of irlncRNA pairs.
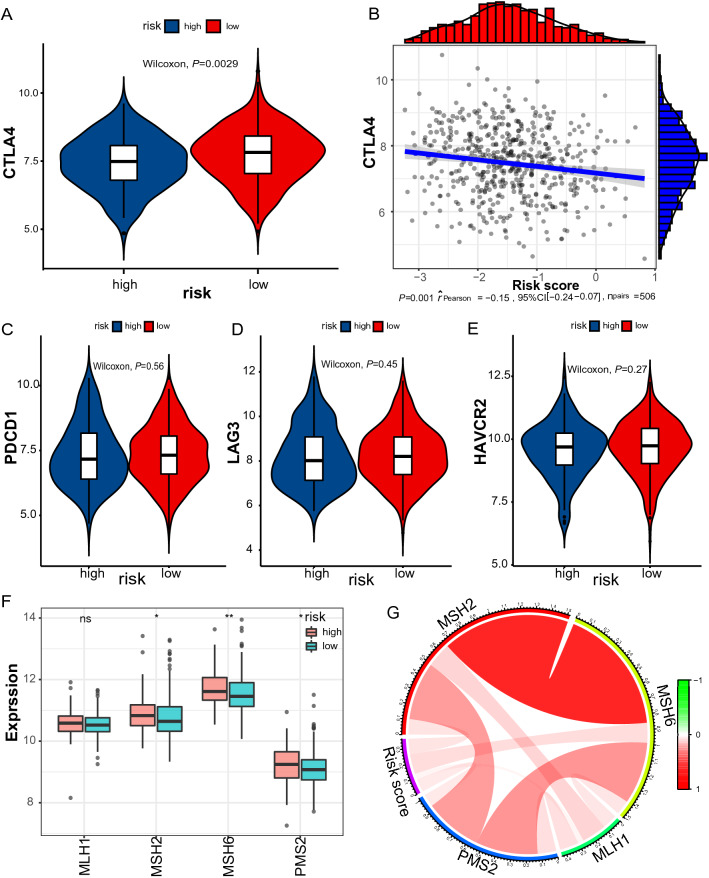
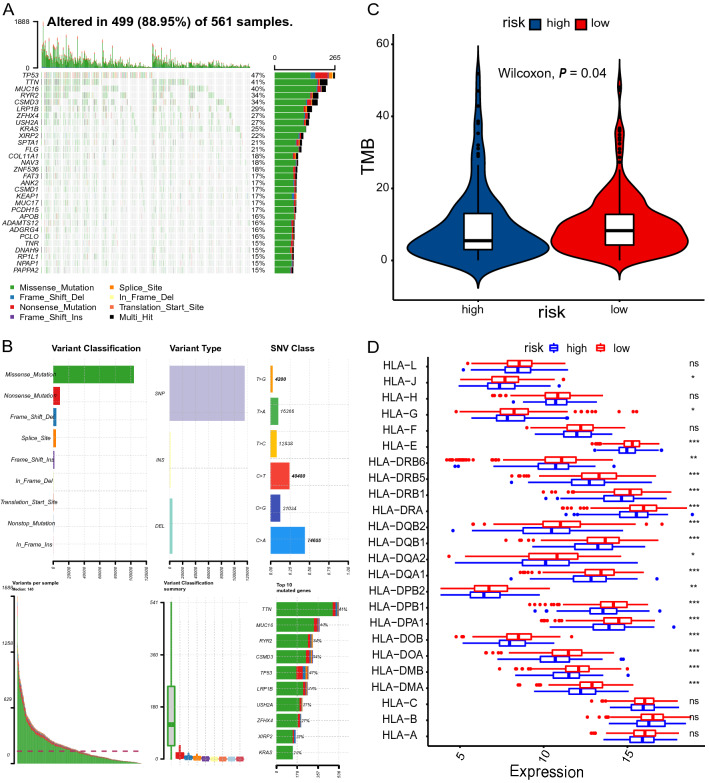
First, we were interested in whether immune checkpoints are differentially expressed between high- and low-risk groups, including PD1, T cell membrane protein 3 (TIM3; also known as HAVCR2), cytotoxic T lymphocyte-associated antigen 4 (CTLA4), and lymphocyte activation gene 3 (LAG3). As indicated in Fig. 6A–E, CTLA4 expression levels were significantly higher in the low-risk group than in the high-risk group (P < 0.0029). Second, a defective DNA mismatch repair system may cause thousands of mutations in cancer, named microsatellite instability (MSI) [24]. MSI, in turn, causes abundant mutant neoantigens in cancer. Several lines of evidence indicate that MSI may serve as a biomarker for PD-1 inhibitors [25–27]. The association between mismatch repair deficiency and sensitivity to PD-1 blockade was demonstrated in a broad spectrum of cancer [25]. MSI usually stems from genetic or epigenetic alterations in the MMR-related genes (MSH2, MSH6, MLH1, PMS2). The expression levels of MSH2, MSH6, and PMS2 were significantly lower in the low-risk group (Fig. 6F–G). It is reasonable to speculate that low expression of MMR-related genes may lead to defective MMR, consequently resulting in cancer sensitivity to PD-1 inhibitors. Third, TMB is also a predictive biomarker of immunotherapy, with high TMB indicating a higher response rate of immunotherapy [28, 29]. The single nucleotide mutation (SNV) data were obtained for 562 LUAD samples, which were processed using maftools package. We profiled the overall gene mutations and calculated the TMBs of LUAD samples. Not surprisingly, we found that the TMB in the low-risk group was significantly higher than that of the high-risk group (9.593 vs. 5.915, P = 0.04), indicating high-risk patients may not be sensitive to ICIs (Fig. 7A–C).
Fig. 6.
Expression levels of immune checkpoints and mismatch repair genes. A Significantly elevated expression levels of CTLA4 were found in the low-risk group. B The association between CTLA4 expression and the risk score at the reverse direction. Low-risk group No significant differences in the expression levels of PDCD1v (C), LAG3 (D), and HAVCR2 (E) between risk stratifications. F Three of four MMR genes decrease in the low-risk group. g Circos plot showing the correlation between MMR genes and the risk score. MSH2: r = 0.105, P < 0.001; MSH6: r = 0.134, P < 0.001; PMS2: r = 0.0834, P = 0.046; PMS2: r = 0.016, P = 0.584
Fig. 7.
Analysis of TMB and HLA expression. A, B Profile of genetic alteration in the TCGA-LUAD cohort. C The low-risk group exhibits significantly higher TMB than the high-risk group. D The profile of HLA member expression levels indicates an overall decrease in HLAs in the high-risk group
Moreover, class I human leukocyte antigen (HLA) is responsible for neoantigen presentation and cytolytic T cell activity by presenting intra-cellular peptides on the cell surface for recognition by T cell receptors. The deficiency of HLA may impair cells’ ability to present neoantigens and cause immune tolerance [30]. As expected, most HLA members were significantly downregulated in the high-risk group compared with the low-risk group (Fig. 7D).
Association of the risk model with chemotherapies
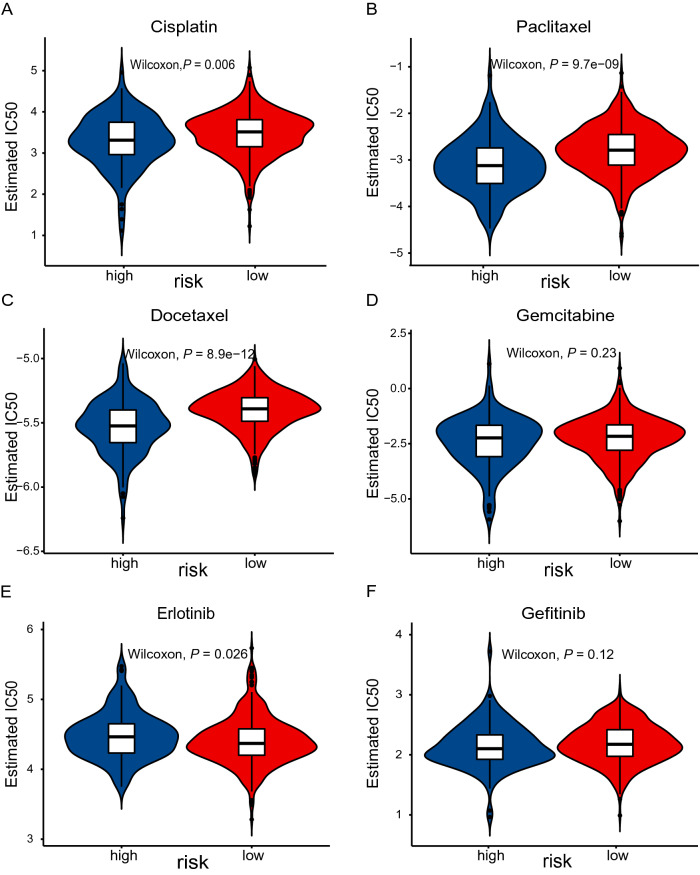
Given the fact that chemotherapy combined with immunotherapy has shown better efficacy than either one alone. We investigated the association between the risk score and clinical response to chemotherapeutic drugs. pRRophetic is an R package that was developed to predict clinical drug response by integrating baseline gene expression levels and drug sensitivity data in cancer cell lines [20, 21]. We applied this method to gene expression sequencing data and focused on paclitaxel, gemcitabine, cisplatin, docetaxel, gefitinib, and erlotinib that are frequently used for NSCLC treatment by AJCC guidelines. As indicated by the half inhibitory concentration (IC50), the high-risk and low-risk groups showed a significant difference in sensitivity to paclitaxel, cisplatin, docetaxel, gefitinib, and erlotinib (Fig. 8). These results suggest that our risk model may potentially guide the use of antitumor drugs in the clinical setting.
Fig. 8.
Prediction of sensitivity of common chemotherapies and targeted therapies. IC50 of drugs was calculated by coupling baseline gene expression levels of patients and drug sensitivity data in cancer cell lines. IC50 was calculated for cisplatin (A), paclitaxel (B), docetaxel (C), gemcitabine (D), erlotinib (E), and gefitinib (F) in high- and low-risk groups
Gene set enrichment analysis
Last, we performed GSEA to explore the signaling pathways significantly upregulated in the low-risk group in comparison to the low-risk group. As exhibited in Supplementary Fig. 5a, many immune-related signaling pathways were associated with the low-risk group. Additionally, KEGG pathway enrichment indicated that DNA repair-associated pathways were associated with the high-risk group, including the mismatch repair, nucleotide excision repair, and p53 signaling pathways (Supplementary Fig. 5b).
Discussion
Overall survival of NSCLC has been improved over the past decade, but remains unsatisfying. Even early-stage NSCLC frequently undergo recurrence due to micrometastasis unrecognized at complete resection. It is imperative to develop reliable prognostic biomarkers to individually tailor therapeutic strategies to discriminate patients who might have a favorable prognosis and who might benefit from chemotherapy and immunotherapy. Substantial exploration on gene expression-based classifiers [28, 31–34] has promoted the commercialization of two prognostic biomarkers in lung adenocarcinoma [33, 35]. However, the accuracy and robustness of the two products in survival estimation need to be improved. To date, besides coding genes, ncRNAs have been used as novel biomarkers or therapies in hundreds of cancer-related clinical trials [36].
In the current study, we generated a prognostic signature with 33 irlncRNA pairs for the TCGA-LUAD cohort. The irlncRNA pair signature could independently predict prognosis in the TCGA-LUAD cohort. The AUC revealed that the risk score alone or in combination with TMN attained significantly greater accuracy than the (National Comprehensive Cancer Network) NCCN guideline alone. When integrated with clinicopathological features, the prognostic accuracy of the irlncRNA pair signature culminated as indicated by a nomogram (c-index = 0.7903). The paring algorithm relies on the relative ranking of gene expression levels in each pair but not the exact expression levels of genes. This strategy first shows promise in several studies involving early-stage nonsquamous NSCLC [23], osteosarcoma [37], gastric cancer [38], and head and neck squamous cell carcinoma [39]. For instance, by taking advantage of the pairwise comparison among the gene expression profile of a specimen, Li and colleagues developed a personalized immune prognostic signature of 25 gene pairs in early-stage nonsquamous NSCLC [23]. Patients in the low-risk group survived significantly longer than those in the high-risk group defined by the immune signature [23]. Thus far, only one study with irlncRNA pairs has been published, in which a signature of 36 differentially expressed irlncRNA pairs could significantly stratify hepatocellular carcinoma (HCC) patients regarding overall survival [11]. In that study, Hong et al. retrieved lncRNAs from the TCGA-HCC cohort and immune-related genes from the ImmPort. The irlncRNAs were determined by performing coexpression analysis between lncRNAs and immune-related genes [11]. Unlike them, we retrieved irlncRNAs for LUAD from the ImmLnc database [9] in the current study. As reported by Li et al., the ImmLnc database was established by integrating tumor purity estimation, GSEA, and other powerful algorithms [9]. At the end, Li’s team uncovered irlncRNAs for 33 cancer types included in TCGA project [9]. While validating the performance of ImmLnc-identified irlncRNAs, authors demonstrated that 28 shared irlncRNAs in pan-lung cancer could distinguish immunological subtype for the whole TCGA-lung cancer cohort, which characterized by high mutation burden, high immune cell infiltration, and good survival [9].
Lung TME is composed of both tumor-promoting and tumor-suppressing immune cells. In the TME, cancer cells can reprogram stromal cells, while infiltrating lymphoid and myeloid cells can inhibit or accelerate carcinogenesis [25]. Alterations in density, composition, activity, and arrangement of the infiltrating leukocytes are related to prognosis, treatment sensitivity, and many other pharmacodynamic parameters [40]. An increase in tumor-infiltrating lymphocytes and a higher CD4 + :CD8 + T cell ratio predicts are associated with a superior prognosis and survival [41, 42]. In contrast, forkhead box P3 (FOXP3) positive regulatory T (Treg) cells and cyclooxygenase 2 (COX2) expression in the tumor were associated with poor recurrence-free survival in NSCLC without node metastasis[43]. Fortunately, such information in the immune contexture can be evaluated by a number of algorithms based on genome-wide expression profiles, including ESTIMATE [16], MCP-counter [17], and CIBERSORT [18, 19]. We found that the risk score derived from the irlncRNA pair signature was related to the tumor immune microenvironment. First, we observed a significant increase in both immune score and ESTIMATE score in the low-risk group, when compared with those in the high-risk group. Second, significantly higher infiltration levels of 6 types of cells (B cell line, CD8 + T cells, endothelial cells, cytotoxic lymphocytes, dendritic cells, T cells) were detected in low-risk groups, with the use of MCP-counter methodology. Finally, the CIBERSORT algorithm further confirmed that there are remarkable differences between high and low-risk groups regarding the abundance of 22 types of immune cells in the tumor microenvironment. Our results are in line with others [5, 39]. In early-stage nonsquamous NSCLC, high- and low-risk groups stratified by an immune-related gene pair signature showed differential neutrophil infiltration levels [23]. Li and colleagues reported that low-risk osteosarcoma patients classified by immune-related gene pair signature showed high immune cell infiltration [5]. Wu et al. demonstrated that a risk signature of 8 irlncRNAs was associated with the abundance and distribution of infiltrating immune cells [39]. These results suggest that a distinguished immune microenvironment may partially account for the survival difference between patient groups classified by our immune-related signature.
Prognostic or predictive biomarkers derived from the tumor immune microenvironment may hold great promise for selecting patients responding to immunotherapy and improving patient management [44, 45]. We evaluated the association between the irlncRNA pair signature and several putative biomarkers of immunotherapies, including mismatch repair deficiency [27, 46], tumor TMB [44, 45], immune checkpoint genes, and HLA [30]. High levels of immune checkpoint genes and TMB, as well as low levels of MMR genes, are usually believed to be predictive biomarkers for patients suitable for immunotherapies. We found significantly enhanced expression levels of CTLA4 and significantly reduced MMR-related genes (MSH2, MSH6, PMS2) in the low-risk group when compared with the high-risk group. Consistently, the low-risk group tended to have higher levels of TMB than the high-risk group. These results indicated that the low-risk group is more likely to respond to immunotherapy. High TMB or defective MMR in tumors usually leads to a dramatically larger neoantigen repertoire than tumors with genome stability. As a result, neoantigens expressing tumors are more immunogenic because both T lymphocytes and B lymphocytes are recruited and activated to mediate local antitumor immunosurveillance [40]. Moreover, we also found a preferential expression of HLA genes in the low-risk group. A decrease in HLA expression may compromise cells’ ability to present neoantigens and cause immune evasion [30]. Low expression of HLA has been detected across a broad spectrum of cancer types, which are often associated with unfavorable outcomes [30]. These results indicated that the low-risk group was highly immunogenic. Our results are consistent with the conception that immune gene expression signature may be used to select a more appropriate form of immunotherapy for patients [40]. The low-risk group had common features with patients referred to as immunological subtype in a previous study, including high immune cell infiltration, high mutation burden, high expression of CTLA4 and HLA genes, low expression of MMR, and good survival [9]. According to the same publication [9], the high-risk group with opposite features could be defined as proliferative subtypes. Interestingly, in the present study, pRRophetic analysis revealed that the proliferative high-risk group was sensitive to cytotoxic chemotherapy, including cisplatin, paclitaxel, and docetaxel. Similarly, Hong et al. found that high-risk HCC patients defined by irlncRNA pair signature exhibited significantly smaller IC50 of doxorubicin, mitomycin C, and cisplatin [11]. Wu et al. demonstrated that an 8-irlncRNA signature identified low-risk group exhibited significantly lower MMR gene expression, higher levels of PD-1 and PD-L1, and higher TMB than the high-risk group [39]. Accordingly, patients sensitive to anti-PD-1 therapy had significantly lower risk scores than those resistant to the therapy [39]. Taken together, these findings confirm the reliability of our results.
Finally, GSEA demonstrated that a great number of immune-related signaling pathways were associated with the low-risk group. These results agree with the above results suggesting immunogenetically “hot” tumors in the low-risk patients and immunogenetically “cold” tumors in the high-risk patients. Moreover, DNA repair-associated pathways were upregulated in the high-risk group, which may help to explain the low TMB in the high-risk patients.
Despite the merits of the irlncRNA pair signature, several limitations of our study should be addressed. First, our findings should be explained cautiously due to the retrospective nature of the study. Second, sampling bias might be unavoidable because of intratumor genetic heterogeneity. Third, external validation by other independent LUAD cohorts is warranted, although we validated the predictive values of the new signature for prognosis, immune cell infiltration, and therapeutic responses using various methods.
In conclusion, the newly developed signature derived from immune-related lncRNA pairs shows great potential as a prognostic biomarker and a predictor of immunotherapy in lung adenocarcinoma patients. Prospective studies are indispensable to further validate its predictive accuracy prior to the application of the signature in the individualized management of LUAD in the clinical setting.
Supplementary Information
Below is the link to the electronic supplementary material.
Acknowledgements
Not applicable.
Abbreviations
- AUC
Area under the curve
- C-index
Concordance index
- CIBERSORT
Cell type identification by estimating relative subsets of RNA transcripts
- CTLA4
Cytotoxic T lymphocyte-associated antigen 4
- DCA
Decision curve analysis
- ESTIMATE
Estimation of STromal and Immune cells in MAlignant Tumor tissues using Expression data
- GEO
Gene Expression Omnibus
- GO
Gene ontology
- GSEA
Gene set enrichment analysis
- HR
Hazard ratio
- HLA
Human leukocyte antigen; MMR
- KEGG
Kyoto encyclopedia of genes and genomes
- LASSO
Least absolute shrinkage and selection operator
- LUAD
Lung adenocarcinoma
- LUSC
Lung squamous cell carcinoma
- LAG3
Lymphocyte activation gene 3
- MCP-counter
Microenvironment cell population count
- NSCLC
Non-small cell lung cancer
- OS
Overall survival
- ROC
Receiver operating characteristic
- TCGA
The Cancer Genome Atlas
- TME
Tumor microenvironment
- TMB
Tumor mutation burden
- TIM3
T cell membrane protein 3
- 95% CI
95% Confidence interval
Authors’ contributions
JZ and JM drafted the manuscript. KC and JM performed the analyses and interpreted all the data. KC, KM, and ML prepared the figures and tables. KC and XJ reviewed and revised the manuscript. All authors approved the final manuscript.
Funding
This work was supported by the Haiyan Foundation of Harbin Medical University Cancer Hospital under Grants [JJZD2020-01 and JJZD2018-01], the Chunhui Project Foundation of Education Department of China under Grant [2019020], and the Natural Science Foundation of China (82172786).
Declarations
Consent for publication
Not applicable.
Availability of data and materials
Not applicable.
Competing interests
There was no competing interest to disclose.
Ethics approval and consent to participate
Not applicable.
Footnotes
Publisher's Note
Springer Nature remains neutral with regard to jurisdictional claims in published maps and institutional affiliations.
Contributor Information
Jianqun Ma, Email: jianqunma@aliyun.com.
Jinhong Zhu, Email: zhujinhong@hrbmu.edu.cn.
References
- 1.Bray F, Ferlay J, Soerjomataram I, Siegel RL, Torre LA, Jemal A. Global cancer statistics 2018: GLOBOCAN estimates of incidence and mortality worldwide for 36 cancers in 185 countries. CA Cancer J Clin. 2018;68:394–424. doi: 10.3322/caac.21492. [DOI] [PubMed] [Google Scholar]
- 2.Miller KD, Nogueira L, Mariotto AB, Rowland JH, Yabroff KR, Alfano CM, Jemal A, Kramer JL, Siegel RL. Cancer treatment and survivorship statistics, 2019. CA Cancer J Clin. 2019;69:363–385. doi: 10.3322/caac.21565. [DOI] [PubMed] [Google Scholar]
- 3.Garon EB, Hellmann MD, Rizvi NA, et al. Five-year overall survival for patients with advanced nonsmall-cell lung cancer treated with pembrolizumab: results from the phase I KEYNOTE-001 study. J Clin Oncol. 2019;37:2518–2527. doi: 10.1200/JCO.19.00934. [DOI] [PMC free article] [PubMed] [Google Scholar]
- 4.Wang KC, Chang HY. Molecular mechanisms of long non-coding RNAs. Mol Cell. 2011;43:904–914. doi: 10.1016/j.molcel.2011.08.018. [DOI] [PMC free article] [PubMed] [Google Scholar]
- 5.Goodall GJ, Wickramasinghe VO. RNA in cancer. Nat Rev Cancer. 2020 doi: 10.1038/s41568-020-00306-0. [DOI] [PubMed] [Google Scholar]
- 6.Chen YG, Satpathy AT, Chang HY. Gene regulation in the immune system by long non-coding RNAs. Nat Immunol. 2017;18:962–972. doi: 10.1038/ni.3771. [DOI] [PMC free article] [PubMed] [Google Scholar]
- 7.Krawczyk M, Emerson BM. p50-associated COX-2 extragenic RNA (PACER) activates COX-2 gene expression by occluding repressive NF-kappaB complexes. Elife. 2014;3:e01776. doi: 10.7554/eLife.01776. [DOI] [PMC free article] [PubMed] [Google Scholar]
- 8.Ranzani V, Rossetti G, Panzeri I, et al. The long intergenic non-coding RNA landscape of human lymphocytes highlights the regulation of T cell differentiation by linc-MAF-4. Nat Immunol. 2015;16:318–325. doi: 10.1038/ni.3093. [DOI] [PMC free article] [PubMed] [Google Scholar]
- 9.Li Y, Jiang T, Zhou W, et al. Pan-cancer characterization of immune-related lncRNAs identifies potential oncogenic biomarkers. Nat Commun. 2020;11:1000. doi: 10.1038/s41467-020-14802-2. [DOI] [PMC free article] [PubMed] [Google Scholar]
- 10.Kim S, Lin CW, Tseng GC. MetaKTSP: a meta-analytic top scoring pair method for robust cross-study validation of omics prediction analysis. Bioinformatics. 2016;32:1966–1973. doi: 10.1093/bioinformatics/btw115. [DOI] [PMC free article] [PubMed] [Google Scholar]
- 11.Hong W, Liang L, Gu Y, Qi Z, Qiu H, Yang X, Zeng W, Ma L, Xie J. Immune-related lncRNA to construct novel signature and predict the immune landscape of human hepatocellular carcinoma. Mol Ther Nucleic Acids. 2020;22:937–947. doi: 10.1016/j.omtn.2020.10.002. [DOI] [PMC free article] [PubMed] [Google Scholar]
- 12.Zhu J, Liu Y, Zhao M, Cao K, Ma J, Peng S. Identification of downstream signaling cascades of ACK1 and prognostic classifiers in non-small cell lung cancer. Aging (Albany NY) 2021 doi: 10.18632/aging.202408. [DOI] [PMC free article] [PubMed] [Google Scholar]
- 13.Liu Y, Wu L, Ao H, Zhao M, Leng X, Liu M, Ma J, Zhu J. Prognostic implications of autophagy-associated gene signatures in non-small cell lung cancer. Aging (Albany NY) 2019;11:11440–11462. doi: 10.18632/aging.102544. [DOI] [PMC free article] [PubMed] [Google Scholar]
- 14.Karakiewicz PI, Briganti A, Chun FK, et al. Multi-institutional validation of a new renal cancer-specific survival nomogram. J Clin Oncol. 2007;25:1316–1322. doi: 10.1200/JCO.2006.06.1218. [DOI] [PubMed] [Google Scholar]
- 15.Okayama H, Kohno T, Ishii Y, et al. Identification of genes upregulated in ALK-positive and EGFR/KRAS/ALK-negative lung adenocarcinomas. Cancer Res. 2012;72:100–111. doi: 10.1158/0008-5472.CAN-11-1403. [DOI] [PubMed] [Google Scholar]
- 16.Yoshihara K, Shahmoradgoli M, Martínez E, et al. Inferring tumour purity and stromal and immune cell admixture from expression data. Nat Commun. 2013;4:2612. doi: 10.1038/ncomms3612. [DOI] [PMC free article] [PubMed] [Google Scholar]
- 17.Becht E, Giraldo NA, Lacroix L, et al. Estimating the population abundance of tissue-infiltrating immune and stromal cell populations using gene expression. Genome Biol. 2016;17:218. doi: 10.1186/s13059-016-1070-5. [DOI] [PMC free article] [PubMed] [Google Scholar]
- 18.Chen B, Khodadoust MS, Liu CL, Newman AM, Alizadeh AA. Profiling tumor infiltrating immune cells with CIBERSORT. Methods Mol Biol. 2018;1711:243–259. doi: 10.1007/978-1-4939-7493-1_12. [DOI] [PMC free article] [PubMed] [Google Scholar]
- 19.Newman AM, Liu CL, Green MR, Gentles AJ, Feng W, Xu Y, Hoang CD, Diehn M, Alizadeh AA. Robust enumeration of cell subsets from tissue expression profiles. Nat Methods. 2015;12:453–457. doi: 10.1038/nmeth.3337. [DOI] [PMC free article] [PubMed] [Google Scholar]
- 20.Geeleher P, Cox N, Huang RS. pRRophetic: an R package for prediction of clinical chemotherapeutic response from tumor gene expression levels. PLoS ONE. 2014;9:e107468. doi: 10.1371/journal.pone.0107468. [DOI] [PMC free article] [PubMed] [Google Scholar]
- 21.Geeleher P, Cox NJ, Huang RS. Clinical drug response can be predicted using baseline gene expression levels and in vitro drug sensitivity in cell lines. Genome Biol. 2014;15:R47. doi: 10.1186/gb-2014-15-3-r47. [DOI] [PMC free article] [PubMed] [Google Scholar]
- 22.Heinaniemi M, Nykter M, Kramer R, et al. Gene-pair expression signatures reveal lineage control. Nat Methods. 2013;10:577–583. doi: 10.1038/nmeth.2445. [DOI] [PMC free article] [PubMed] [Google Scholar]
- 23.Li B, Cui Y, Diehn M, Li R. Development and validation of an individualized immune prognostic signature in early-stage nonsquamous non-small cell lung cancer. JAMA Oncol. 2017;3:1529–1537. doi: 10.1001/jamaoncol.2017.1609. [DOI] [PMC free article] [PubMed] [Google Scholar]
- 24.Luchini C, Bibeau F, Ligtenberg MJL, et al. ESMO recommendations on microsatellite instability testing for immunotherapy in cancer, and its relationship with PD-1/PD-L1 expression and tumour mutational burden: a systematic review-based approach. Ann Oncol Off J Eur Soc Med Oncol. 2019;30:1232–1243. doi: 10.1093/annonc/mdz116. [DOI] [PubMed] [Google Scholar]
- 25.Altorki NK, Markowitz GJ, Gao D, Port JL, Saxena A, Stiles B, McGraw T, Mittal V. The lung microenvironment: an important regulator of tumour growth and metastasis. Nat Rev Cancer. 2018;19:9–31. doi: 10.1038/s41568-018-0081-9. [DOI] [PMC free article] [PubMed] [Google Scholar]
- 26.Dudley JC, Lin MT, Le DT, Eshleman JR. Microsatellite Instability as a Biomarker for PD-1 Blockade. Clin Cancer Res. 2016;22:813–820. doi: 10.1158/1078-0432.CCR-15-1678. [DOI] [PubMed] [Google Scholar]
- 27.Le DT, Uram JN, Wang H, et al. PD-1 blockade in tumors with mismatch-repair deficiency. N Engl J Med. 2015;372:2509–2520. doi: 10.1056/NEJMoa1500596. [DOI] [PMC free article] [PubMed] [Google Scholar]
- 28.Sha D, Jin Z, Budczies J, Kluck K, Stenzinger A, Sinicrope FA. Tumor mutational burden as a predictive biomarker in solid tumors. Cancer Discov. 2020;10:1808–1825. doi: 10.1158/2159-8290.CD-20-0522. [DOI] [PMC free article] [PubMed] [Google Scholar]
- 29.Jardim DL, Goodman A, de Melo GD, Kurzrock R. The challenges of tumor mutational burden as an immunotherapy biomarker. Cancer Cell. 2020 doi: 10.1016/j.ccell.2020.10.001. [DOI] [PMC free article] [PubMed] [Google Scholar]
- 30.McGranahan N, Rosenthal R, Hiley CT, et al. Allele-Specific HLA Loss and Immune Escape in Lung Cancer Evolution. Cell. 2017;171:1259–71.e11. doi: 10.1016/j.cell.2017.10.001. [DOI] [PMC free article] [PubMed] [Google Scholar]
- 31.Beer DG, Kardia SL, Huang CC, et al. Gene-expression profiles predict survival of patients with lung adenocarcinoma. Nat Med. 2002;8:816–824. doi: 10.1038/nm733. [DOI] [PubMed] [Google Scholar]
- 32.Director's Challenge Consortium for the Molecular Classification of Lung A. Shedden K, Taylor JM, et al. Gene expression-based survival prediction in lung adenocarcinoma: a multi-site, blinded validation study. Nat Med. 2008;14:822–827. doi: 10.1038/nm.1790. [DOI] [PMC free article] [PubMed] [Google Scholar]
- 33.Wistuba II, Behrens C, Lombardi F, et al. Validation of a proliferation-based expression signature as prognostic marker in early stage lung adenocarcinoma. Clin Cancer Res. 2013;19:6261–6271. doi: 10.1158/1078-0432.CCR-13-0596. [DOI] [PMC free article] [PubMed] [Google Scholar]
- 34.Chen HY, Yu SL, Chen CH, et al. A five-gene signature and clinical outcome in non-small-cell lung cancer. N Engl J Med. 2007;356:11–20. doi: 10.1056/NEJMoa060096. [DOI] [PubMed] [Google Scholar]
- 35.Kratz JR, He J, Van Den Eeden SK, et al. A practical molecular assay to predict survival in resected non-squamous, non-small-cell lung cancer: development and international validation studies. The Lancet. 2012;379:823–832. doi: 10.1016/s0140-6736(11)61941-7. [DOI] [PMC free article] [PubMed] [Google Scholar]
- 36.Slack FJ, Chinnaiyan AM. The role of non-coding RNAs in oncology. Cell. 2019;179:1033–1055. doi: 10.1016/j.cell.2019.10.017. [DOI] [PMC free article] [PubMed] [Google Scholar]
- 37.Li LQ, Zhang LH, Zhang Y, et al. Construction of immune-related gene pairs signature to predict the overall survival of osteosarcoma patients. Aging (Albany NY) 2020;12:22906–22926. doi: 10.18632/aging.104017. [DOI] [PMC free article] [PubMed] [Google Scholar]
- 38.Zhao E, Zhou C, Chen S. A signature of 14 immune-related gene pairs predicts overall survival in gastric cancer. Clin Transl Oncol. 2020 doi: 10.1007/s12094-020-02414-7. [DOI] [PubMed] [Google Scholar]
- 39.Jiang P, Li Y, Xu Z, He S. A signature of 17 immune-related gene pairs predicts prognosis and immune status in HNSCC patients. Transl Oncol. 2021;14:100924. doi: 10.1016/j.tranon.2020.100924. [DOI] [PMC free article] [PubMed] [Google Scholar]
- 40.Fridman WH, Zitvogel L, Sautes-Fridman C, Kroemer G. The immune contexture in cancer prognosis and treatment. Nat Rev Clin Oncol. 2017;14:717–734. doi: 10.1038/nrclinonc.2017.101. [DOI] [PubMed] [Google Scholar]
- 41.Brambilla E, Le Teuff G, Marguet S, et al. Prognostic effect of tumor lymphocytic infiltration in resectable non-small-cell lung cancer. J Clin Oncol. 2016;34:1223–1230. doi: 10.1200/JCO.2015.63.0970. [DOI] [PMC free article] [PubMed] [Google Scholar]
- 42.Reynders K, De Ruysscher D. Tumor infiltrating lymphocytes in lung cancer: a new prognostic parameter. J Thorac Dis. 2016;8:E833–E835. doi: 10.21037/jtd.2016.07.75. [DOI] [PMC free article] [PubMed] [Google Scholar]
- 43.Shimizu K, Nakata M, Hirami Y, Yukawa T, Maeda A, Tanemoto K. Tumor-infiltrating Foxp3+ regulatory T cells are correlated with cyclooxygenase-2 expression and are associated with recurrence in resected non-small cell lung cancer. J Thorac Oncol. 2010;5:585–590. doi: 10.1097/JTO.0b013e3181d60fd7. [DOI] [PubMed] [Google Scholar]
- 44.Chan TA, Yarchoan M, Jaffee E, Swanton C, Quezada SA, Stenzinger A, Peters S. Development of tumor mutation burden as an immunotherapy biomarker: utility for the oncology clinic. Ann Oncol Off J Eur Soc Med Oncol. 2019;30:44–56. doi: 10.1093/annonc/mdy495. [DOI] [PMC free article] [PubMed] [Google Scholar]
- 45.Rizvi H, Sanchez-Vega F, La K, et al. Molecular determinants of response to anti-programmed cell death (PD)-1 and anti-programmed death-ligand 1 (PD-L1) blockade in patients with non-small-cell lung cancer profiled with targeted next-generation sequencing. J Clin Oncol. 2018;36:633–641. doi: 10.1200/jco.2017.75.3384. [DOI] [PMC free article] [PubMed] [Google Scholar]
- 46.Le DT, Durham JN, Smith KN, et al. Mismatch repair deficiency predicts response of solid tumors to PD-1 blockade. Science. 2017;357:409–413. doi: 10.1126/science.aan6733. [DOI] [PMC free article] [PubMed] [Google Scholar]
Associated Data
This section collects any data citations, data availability statements, or supplementary materials included in this article.
Supplementary Materials
Data Availability Statement
Not applicable.


