Abstract
Hepatocellular carcinoma (HCC) is one of the most common causes of cancer-related mortality; however, effective immunotherapy strategies are limited because of the immunosuppressive tumor microenvironment. Macrophages are essential components of the HCC microenvironment and are related to poor prognosis. Here, we evaluated the attributes of paracancer tissues in tumor immunity and progression using public databases. Based on the abundance of immune cells estimated by CIBERSORT, we performed weighted gene co-expression network analysis and found a specific module associated with M2 macrophages. Through analyzing interaction networks using Cytoscape and public datasets, we identified oncoprotein-induced transcript 3 (OIT3) as a novel marker of M2 macrophages. Overexpression of OIT3 remodeled immune features and reprogrammed the metabolism of M2 macrophages. Moreover, compared with wildtype macrophages, OIT3-overexpressing macrophages further enhanced the migration and invasion of co-cultured cancer cells. Additionally, OIT3-overexpressing macrophages promoted tumorigenesis and cancer development in vivo. Taken together, the findings demonstrate that OIT3 is a novel biomarker of alternatively activated macrophages and facilitates HCC metastasis.
Supplementary Information
The online version contains supplementary material available at 10.1007/s00262-022-03188-3.
Keywords: Hepatocellular carcinoma, OIT3, Alternatively activated macrophages, Weighted gene co-expression network analysis, Paracancer, Migration and invasion
Introduction
Hepatocellular carcinoma (HCC) is a prevalent form of liver cancer that is characterized by rapid disease progression with high postsurgical recurrence and high metastatic rate [1, 2]. Recent developments in immune checkpoint inhibitors (ICIs), including nivolumab and pembrolizumab, improved survival and provided additional options to treat HCC, but the objective response rates of these promising treatments remained < 20% [2–6]. Thus, further investigation of the roles of tumor-associated immune cells is important for exploring reasonable therapeutic strategies and reducing HCC mortality.
Histological normalcy, in general, implies normal biology. Thus, histologically normal tissues dissected adjacent to cancer (paracancer tissues) are used as healthy controls for cancer studies to reduce individual-specific and anatomical site-specific effects. However, paracancer tissues are significantly different from healthy normal tissues. Recent studies have suggested that paracancer tissues are in a pre-neoplastic state comprising morphologically normal but molecularly altered cells, and abnormally infiltrated immune cells [7–10]. Macrophages are essential for maintaining tissue homeostasis, especially for regulating the tumor microenvironment (TME) [11]. According to their polarization states, macrophages are usually classified as classically activated (M1) and alternatively activated (M2). Studies on human tumor samples have demonstrated that the proportion of macrophages (tumor-associated macrophages, TAMs) plays a crucial role in tumor progression, metastasis, and recurrence after treatment that usually display an M2-like phenotype [12–14]. Therefore, a better understanding of the interaction of anticancer therapies with M2 macrophages may pave the way for novel HCC immunotherapy.
In this study, we focused on the infiltrated immune cells in paracancer tissues considering that these immune cells may play pivotal roles in tumor immunosuppression, progression, and metastasis. Taken together, we aimed to explore new potential immunotherapeutic targets for HCC metastasis.
Materials and methods
Human and mouse samples
Human HCC and paracancer samples were provided by the Department of Pathology of the 958th Hospital (Chongqing, China). Eight-week-old male C57BL/6 mice were purchased from the Animal Institute of the Academy of Medical Science (Beijing, China). Eight-week-old BALB/c nude mice were purchased from Vital River Laboratory Animal Technology Co., Ltd. (Beijing, China). All mice were maintained under specific pathogen-free conditions, and experiments were conducted in accordance with the relevant guidelines approved by the Institutional Animal Care and Use Committee of the Army Medical University.
Cell culture and treatments
The femur and tibia samples were obtained from 8-week-old C57BL/6 mice, severed proximal to each joint, and flushed with cold RPMI medium (Gibco) to collect bone marrow cells using a syringe. The bone marrow cells were cultured in RPMI-1640 containing 10% (v/v) FBS (Gibco) and 20 ng/mL of mouse GM-CSF (catalog no. 315–03, PeproTech) for 7 days to obtain bone marrow-derived macrophages (BMDMs). The iBMDM cell line was a gift from Prof. Feng Shao, Ph.D. (National Institute of Biological Sciences, Beijing, China). The iBMDM cells were cultured in DMEM (Gibco) supplemented with 10% (v/v) FBS (Gibco). To generate M1 and M2 macrophages, BMDMs or iBMDMs were stimulated with LPS (100 ng/mL; catalog no. L4524, Sigma-Aldrich) + IFN-γ (20 ng/mL; catalog no.315–05; PeproTech), or IL-4 (10 ng/mL, catalog no. 214–14; PeproTech) plus IL-13 (10 ng/mL, catalog no.210–13; PeproTech) for 12–24 h, respectively.
For transfection, iBMDM cells were washed twice with PBS and then incubated in DMEM (10% FBS) with lentivirus GFP vectors of Mock or LV-Oit3 (20 μL, 1 × 10⁸ TU/ml; Genechem) mixed with transfection reagent (40 μL, 25 × ; Genechem) for 48 h and selected with puromycin (2.5 μg/mL) for 20 days, according to the manufacturer’s instructions.
H22 cells were purchased from the Type Culture Collection of the Chinese Academy of Sciences and cultured in RPMI-1640 containing 10% FBS. In the co-culture assay, iBMDMs (5 × 10⁵ cells/well) were seeded in a 6-well plate, and H22 cells (5 × 10⁵ cells/well) were added to the culture supernatants. After co-culturing for 24–48 h, H22 cells were collected from the supernatants by centrifugation at 1000 rpm at 4 °C for 5 min.
Hepa1-6 cells were purchased from the Type Culture Collection of the Chinese Academy of Sciences and cultured in DMEM containing 12% FBS. In the migration assays, iBMDMs (2.5 × 10⁵ cells/well) were seeded in a 24-well plate in complete medium. Hepa1-6 cells, pre-starved for 6 h, were seeded onto the filters of the top chambers (5 × 10⁴ cells/chamber) with 0.8-μm polycarbonate membrane (catalog no.3422, Corning) in serum-free medium. Next, Hepa1-6 cells (2.5 × 10⁵ cells/well) were seeded in the 24-well plate, with only complete medium in the control group. The cells were co-cultured for 8–12 h before fixing with paraformaldehyde for 30 min. Invasion assays were performed as described in a previous study [15]. Briefly, the filters were covered with 50 μL of matrigel (diluted to 200–300 μg/mL; catalog no.356234, Corning) and incubated for 6 h at 37 °C. Furthermore, the cells were seeded for migration assays and co-cultured for 24 h before fixation. Next, the fixed filters were stained with 0.2% crystal violet after removing the non-invading cells that remained on the upper surface of the filters. Cells were visualized using a phase-contrast microscope. The ratios were calculated as the gray value of cells versus the area of the microscopic field using ImageJ (https://cnij.imjoy.io/).
Data source and identification of differentially expressed genes (DEGs)
The array datasets of GSE45436, GSE62232, GSE112790, and GSE121248 were downloaded from the Gene Expression Omnibus (GEO) database (http://www.ncbi.nlm.nih.gov/geo/). After removing specimens whose clinical information failed to match with their sample names, 426 tumor specimens and 97 normal specimens were selected. We extracted and normalized the expression data using the mas.5 function in the affy R package (version 1.64.0). Probes of the normalized data were converted to gene symbols according to the GPL570 annotation information platform. Probes without matched genes were eliminated, and the average value was calculated for genes corresponding to more than one probe. Further, batch effects were removed from the normalized data using the ComBat function in the sva R package (version 3.34.0). Based on the normalized expression data, DEGs were identified using the limma R package (version 3.42.3) and filtered with an adjusted p value < 0.01, |log2FC|> 1, and average gene expression > 0.01 ACTB.
Estimated immune scores
The stromal/immune score was calculated using the ESTIMATE R package (version 1.0.13) that estimated the presence of infiltrating stromal/immune cells in the TME. The paracancer samples were processed using the ESTIMATE algorithm on default settings; and three scores were generated: stromal, immune, and estimate scores representing fractions of stromal cells, abundances of infiltrated immune cells, and combined immune and stromal score, respectively.
Estimated fractions of immune cells in CIBERSORT
CIBERSORT, a versatile computational method, is frequently used to estimate the abundance of immune cell types from bulk tissue transcriptomes. The expression data without log2 transformation were uploaded to the CIBERSORT website (https://cibersort.stanford.edu/) and computed in relative and absolute models together with the signature gene files of LM22 and 1000 permutations. The fractions of the 22 immune cell types were downloaded for further analyses.
Weighted gene co-expression network analysis
Weighted gene co-expression network analysis (WGCNA) was performed using R package as described previously [16, 17]. First, paracancer samples were filtered through a clustering dendrogram based on their Euclidean distance. With a cutoff value of height at 60, two samples were excluded. Further, the proper soft thresholding power was selected in pickSoftThreshold function according to the approximate scale-free topology (R square of 0.85) and mean connectivity criteria. Next, co-expression modules were constructed on the default (unsigned) setting, with softPower of 4, minModuleSize of 30, and mergeCutHeight value of 0.25. Additionally, we associated the expression modules with an abundance of infiltrated immune cells (R codes could be found in the supplement materials). Finally, the corresponding gene module was extracted, and the node and edge files (top 200, ranked in weight values) were imported into Cytoscape.
Interaction analysis in cytoscape
The WGCNA edge and node files of the red module were imported into Cytoscape (version 3.6.1), the sizes and colors of circles were mapped to the degrees of nodes, and the border and color of lines were applied to map the values of weights in Edges. The interaction network was visualized in the attribute circle layout.
Real-time quantitative PCR
Total RNA was extracted using RNAiso Plus (Cat No.9109, Takara, Otsu, Shiga, Japan) according to the manufacturer’s instructions and was reverse transcribed into cDNA using PrimeScript RT reagent Kit with gDNA Eraser (Takara). The mRNA expression was assessed by real-time quantitative polymerase chain reaction (RT-qPCR) using TB Green® Premix Ex Taq™ II (Takara) on BioRad CFX96 (Bio-Rad, CA). Relative gene expression was calculated using the 2–ΔΔCt method and normalized to expression of Hprt mRNA. The primers used in this experiment are listed in Supplementary Table 1.
Western blotting
Cells were lysed in radioimmunoprecipitation assay (RIPA) lysis buffer with phenylmethylsulfonyl fluoride for 30 min on ice and centrifuged at 12,000 rpm at 4 °C for 15 min before the supernatant was collected. Cell lysates were quantified using bicinchoninic acid assay (catalog no. P0068; Beyotime, Jiangsu, China). Western blotting analysis was performed as described previously [18]. Briefly, after sodium dodecyl sulfate (SDS)–polyacrylamide gel electrophoresis and blocking, membranes were incubated with primary antibodies at 4 °C overnight. The primary antibodies used were against OIT3 (catalog no. ab139190; Abcam), CD163 (catalog no. ab182422, Abcam), NOS2 (catalog no. 18985–1-AP, Proteintech), ARG1 (catalog no. 16001–1-AP, Proteintech), AMPKa (catalog no. AF1627, Beyotime), mTOR (catalog no. 2983, Cell Signaling Technology), Snail (catalog no. 3879, Cell Signaling Technology), vimentin (catalog no. 5741, Cell Signaling Technology), and β-actin (catalog no. 3700, Cell Signaling Technology). After five washes with tris-buffered saline/Tween 20, the membranes were incubated at 20 °C for 60 min with horseradish peroxidase-conjugated goat anti-rabbit antibody (catalog no. A0208, Beyotime) and goat anti-mouse antibody (catalog no. A0216, Beyotime), respectively. The protein bands were visualized using an enhanced chemiluminescence plus Western blotting detection kit (catalog no. 1705061, Bio-Rad). The relative expression levels of the protein bands were calculated using ImageJ (https://cnij.imjoy.io/).
Immunohistochemistry
Immunohistochemistry (IHC) of tumor sections was performed as previously described[19]. The slides were stained with primary CD3 antibody (MAB-0740, MXB) or CD45 antibody (Kit-0024, MXB) and imaged under a light microscope (BX63, Olympus Microsystems).
Nude mouse tumorigenicity assay
Eighteen 5-week-old nude mice were randomly divided into three groups. In the negative control group, serum-free PBS (100 μL) containing H22 cells (1 × 10⁶) was subcutaneously injected into the right flank of the mice. For the treatment groups, serum-free PBS (100 μL) containing H22 cells (1 × 10⁶) and Mock-iBMDM (1 × 10⁶) or LV-Oit3-iBMDM (1 × 10⁶) was injected into the corresponding site of mice. The tumor volume was calculated as: (length × Width2)/2.
Statistical analysis
Statistical analyses were performed in ggplot2 (version 3.3.5) and ggspubr (version 0.4.0) R packages using R software (version 3.6.3) described in previous methods [20]. All the biological experiment data were processed in GraphPad Prism 8 (GraphPad Software, Inc.), expressed as the mean ± SD, and were analyzed using either one-way ANOVA or two-tailed unpaired Student’s t-test. For each parameter of all data presented, * indicates p < 0.05, ** indicates p < 0.01, *** indicates p < 0.001, and **** indicates p < 0.0001.
Results
Infiltrated immune cells converge in paracancer tissues
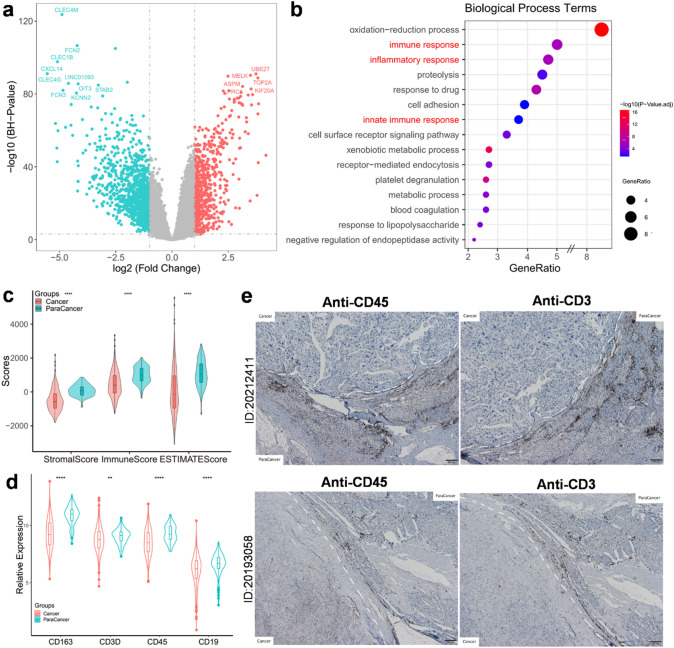
After analyzing GEO microarray datasets (GSE45436, GSE62232, GSE112790, and GSE121248) based on the GPL570 annotation platform, we found 1,186 DEGs that were upregulated in paracancer tissues. The top DEGs in paracancer tissues, such as CLEC4M, CXCL14, CLEC4G, and CLEC1B, were identified (Fig. 1a). Of interest, these genes were reported to be involved in the inflammatory immune response process [21–24]. Based on the GO annotation, we identified three biological process terms related to immune and inflammatory responses (Fig. 1b). Consistent with results of previous studies [8, 9], the immune and stromal scores were higher in the paracancer tissues than those in cancer tissues according to the ESTIMATE algorithm (Fig. 1c). The immune cell markers, such as CD163 (macrophages), CD3 (T cells), CD45 (leukocytes), and CD19 (B cells), were significantly upregulated in paracancer tissues than in cancer tissues (Fig. 1d). We further assessed CD45 and CD3 in HCC samples and observed that the positively stained regions were frequently located in the paracancer tissues. Taken together, these results confirm enrichment of immunological characteristics in paracancer tissues.
Fig. 1.
Immune cells converged in paracancer versus cancer tissues. a Volcano plots of DEGs in GEO array dataset, top DEGs (−log10(BH p-value) > 80, |log2FC| > 2.5) were labeled. Red dots represented upregulated genes in cancer tissues, while green dots represented upregulated genes in paracancer tissues. b Bubble plots of top 15 biological process terms of GO annotation which were ordered by gene ratio of enriched process (p < 0.01). c Stomal scores and immune scores (inferred by ESTIMATE) in paracancer and cancer tissues plotted by violin box plots (p < 0.001). d Expression of CD163, CD3, CD45, and CD19 in paracancer versus cancer tissues (p < 0.01). e Immunohistochemistry of CD45 and CD3 in paracancer and cancer tissues from two independent HCC patients
Construction of gene networks and identification of modules in paracancer tissues
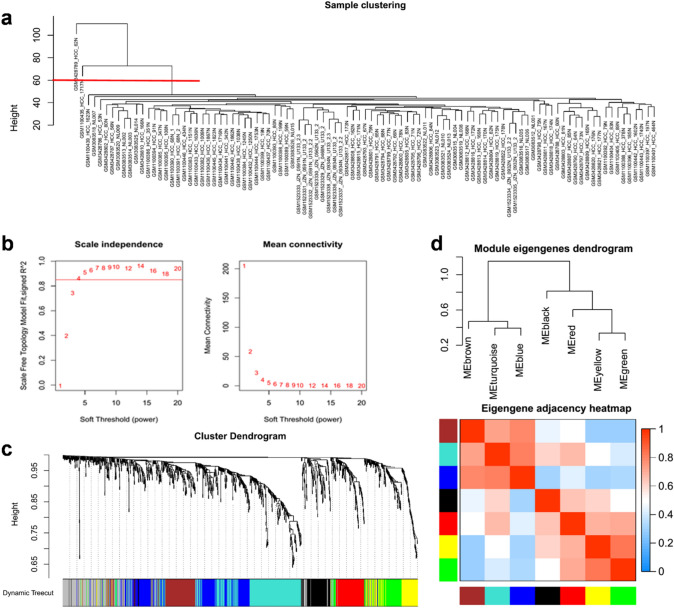
The WGCNA is frequently used to identify co-expressed networks and co-expression modules [25, 26]. We imported the expression matrix of 1186 DEGs upregulated in the paracancer tissues to WGCNA to determine co-expression genes with similar traits. Hierarchical clustering of paracancer samples was performed to exclude two outliers with a height cutoff of 60 (Fig. 2a); 95 samples were included in the subsequent analysis. The adequate soft threshold power was 4, by setting an R square of 0.85, according to the trade-off between scale-free topology and mean connectivity (Fig. 2b). We identified modules using average linkage hierarchical clustering and a dynamic tree cut. The red and black modules were independent and were not embedded in any other modules (Fig. 2c). The brown module was inserted in blue and turquoise modules (Fig. 2c) that were significantly similar to each other according to the hierarchical clustering of module eigen genes and heatmap plot of the adjacent entities in the eigen genes (Fig. 2d). Taken together, red and black modules were identified as rational co-expression modules for further analysis.
Fig. 2.
Construction of weighted gene co-expression network with the upregulated genes in paracancer. a Exclusion of outlier samples through clustering dendrogram. Two samples were excluded by setting cutoff value of height to 60 from total of 97 paracancer samples. b Determination of soft threshold power on a trade-off between scale free topology (left panel, R square = 0.85) and mean connectivity (right panel). c Identified modules by average linkage hierarchical clustering and dynamic tree cut. Red and Black modules were high consistency and independent without inserted by other modules. d Hierarchical clustering of module eigengenes (up panel) and heatmap plot of the adjacencies in the eigengene network (down panel)
Association of specific module with composition of infiltrated immune cells in paracancer tissues
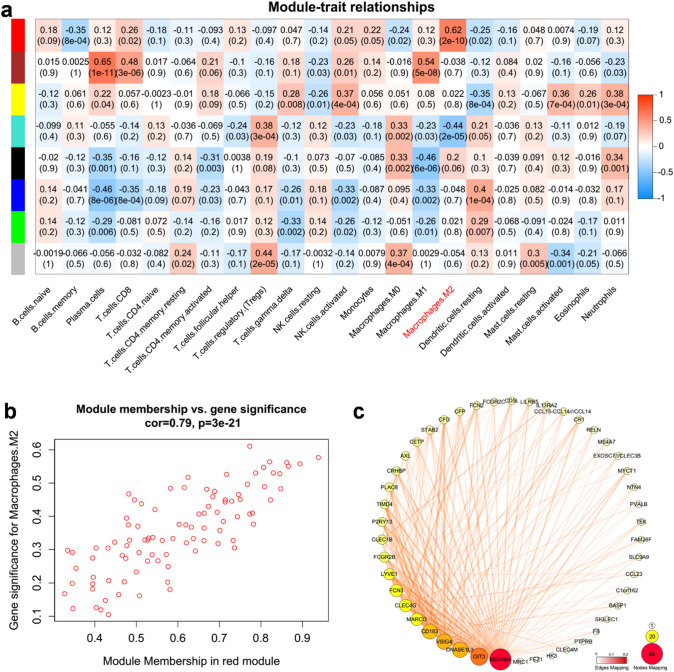
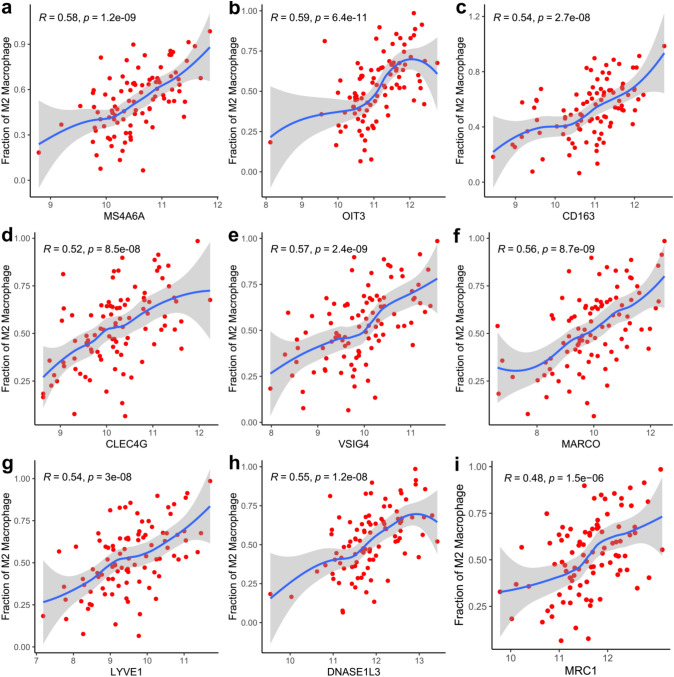
To better characterize the immunological characteristics of these modules, we estimated the abundance of infiltrated immune cell types in paracancer samples using CIBERSORT based on a deconvolution approach [27–29]. By calculating correlation between the modules and immune cell fractions, we found that the red module was more relevant to the M2 macrophages (r = 0.62, p < 0.001) than black module (Fig. 3a). For each module, WGCNA define a quantitative measure of module membership (MM) as the correlation of the module eigen gene and the gene expression profile. To refine the analysis, we constructed a scatterplot of gene significance (GS) for M2 macrophage versus MM in the red module. Here, GS and MM were highly correlated (r = 0.79, p < 0.001) (Fig. 3b), illustrating that the genes significantly associated with M2 macrophages were also the most important (central) elements of the red module associated with M2 macrophages. To further target and screen meaningful hub genes, we imported WGCNA edge and node files into Cytoscape. The candidate genes of the red module were ranked according to the degrees of nodes and weights of edges (Fig. 3c). Moreover, a majority of the genes have been reported as biomarkers of M2 macrophages, such as MS4A6A, CD163, CLEC4G, VSIG4, MARCO, LYVE1, and MRC1 [30–35]. Based on the correlation analysis, the expression of OIT3 was found to significantly correlate with the abundance of M2 macrophages, with maximum correlation coefficient between candidate genes (Fig. 4). Therefore, we inferred that OIT3 may be a novel marker of M2 macrophages.
Fig. 3.
Identification of modules associated with the fraction of infiltrated immune cells in paracancer tissues. a Heatmap of the correlation between module eigengenes and fractions of infiltrated immune cells calculated by CIBERSORT. Red module represents a high correlation with M2 macrophages. b A scatterplot of gene significance for M2 macrophages versus module membership in the red module. The significant correlation implied the eigengenes in red module tend to be highly correlated with M2 macrophages. c WGCNA edge and node files were imported into Cytoscape (top 200 edges ranked by weight values). The size and color of circles mapped to the values of degree of Nodes, and the border and color of lines mapped to the values of weights in Edges
Fig. 4.
Correlation analysis of the expression of candidate biomarkers with the fractions of M2 macrophage. Spearman correlation analysis was performed in the abundance of M2 and the expression of MS4A6A (R = 0.58, p < 0.001, a), OIT3 (R = 0.59, p < 0.001, b), CD163 (R = 0.54, p < 0.001, c), CLEC4G (R = 0.52, p < 0.001, d), VSIG4 (R = 0.57, p < 0.001, e), MARCO (R = 0.56, p < 0.001, f), LYVE1 (R = 0.54, p < 0.001, g), DNASE1L3 (R = 0.55, p < 0.001, h) and MRC1 (R = 0.48, p < 0.001, i)
OIT3 is a novel biomarker of M2 macrophages
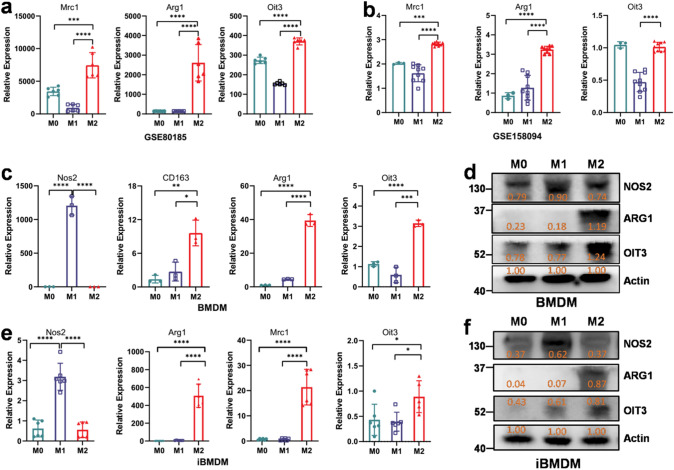
To validate the inference, we searched related data from the GEO dataset. Consistent with expression of ARG1 and MRC1, the expression of OIT3 was significantly higher in M2 macrophages than that in M0 and M1 macrophages in both the array dataset (GSE80185, Fig. 5a) and RNA-seq dataset (GSE158094, Fig. 5b). Moreover, in vitro experiments with BMDM and iBMDM cell lines indicated that OIT3 was highly expressed in M2 macrophages at the gene and protein levels than in M0 and M1 macrophages (Fig. 5c–f).
Fig. 5.
OIT3 is a potential marker of M2 macrophages in GEO datasets and in vitro experiments. (a, b) Mrc1, Arg1, and OIT3 expression in M0, M1, and M2 macrophages in the validate dataset of GSE80815 array data (a) and GSE158094 RNA-seq data (b). (c–f) Expression of M1 and M2 markers as well as OIT3 in M0, M1 and M2 BMDM (c, d) and iBMDM (e, f). Data of a (n = 6), b (n = 3 in M0, n = 9 in M1 and M2), c (n = 3) and e (n = 6) are expressed as mean ± SEM. *p < 0.05, **p < 0.01, ***p < 0.001, ****p < 0.0001. Data of d and f are normalized against the expression of Actin
Overexpression of OIT3 reprograms immunity and metabolism of M2 macrophages
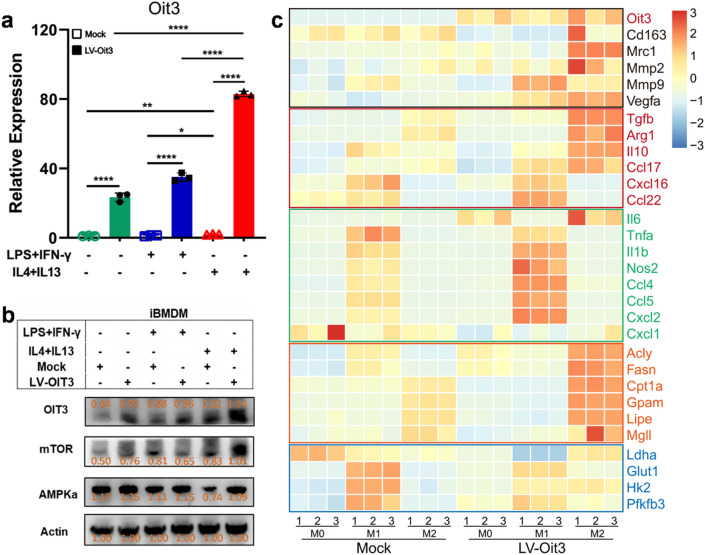
The overexpression lentiviral vector of OIT3 (LV-Oit3) was transfected into macrophages, and LPS- and IFN-γ- or recombinant IL-4- and IL-13-induced polarization experiment was also performed (Fig. 6a, b). M2 macrophages possess antiinflammatory and protumorigenic features and tend to depend on oxidative phosphorylation. Similar to OIT3, the mechanistic target of rapamycin (mTOR) and adenosine 5-monophosphate-activated protein kinase (AMPK) were highly expressed in the LV-Oit3 group polarized by IL-4 and IL-13 than in the other treatment groups (Fig. 6b). We also determined the transcription levels of antiinflammatory and proinflammatory cytokines and chemokines, and key enzymes in glucose and lipid metabolism. The expression of a majority of the antiinflammatory cytokines or chemokines, such as IL10, TGFB, CCL17, and VEGF, and key enzymes in fatty acid metabolism—ACLY, FASN, CPT1A, LIPE, and GPAM—was enhanced in M2 macrophages. In contrast, expression of proinflammatory cytokines or chemokines, including TNF, IL1B, NOS2, CCL4, CCL5 and CXCL2, and enzymes GLUT1, HK2, and PFKFB3 in glycolysis was upregulated in M1 macrophages (Fig. 6c). Thus, OIT3 may be involved in the regulation of macrophage polarization and metabolism.
Fig. 6.
OIT3 remodeled immunity and reprogrammed metabolism of macrophages. a Expression of OIT3 gene in iBMDM after transfected with mock or lentiviral vector of OIT3 and stimulated with PBS, LPS plus IFN, or IL-4 plus IL-13. Data are expressed as mean ± SEM (n = 3). *p < 0.05, **p < 0.01, ****p < 0.0001. b The protein expression of OIT3, mTOR, AMPKα in iBMDM after transfected with mock or lentiviral vector of OIT3 and stimulated with PBS, LPS plus IFN, or IL-4 plus IL-13 for 48 h, respectively. The orange values indicated the relative expression according to the density, the expression values were normalized against the expression of actin. c The transcription levels of molecules in promoting tumor (black), antiinflammatory (red), and proinflammatory (green) cytokines or chemokines, enzymes of glycolysis (blue), and fatty acid metabolism (orange) in M0, M1, and M2 macrophages after transfected with mock or lentiviral vector (LV) of OIT3
Macrophage OIT3 enhances migration, invasion, and development of cancer
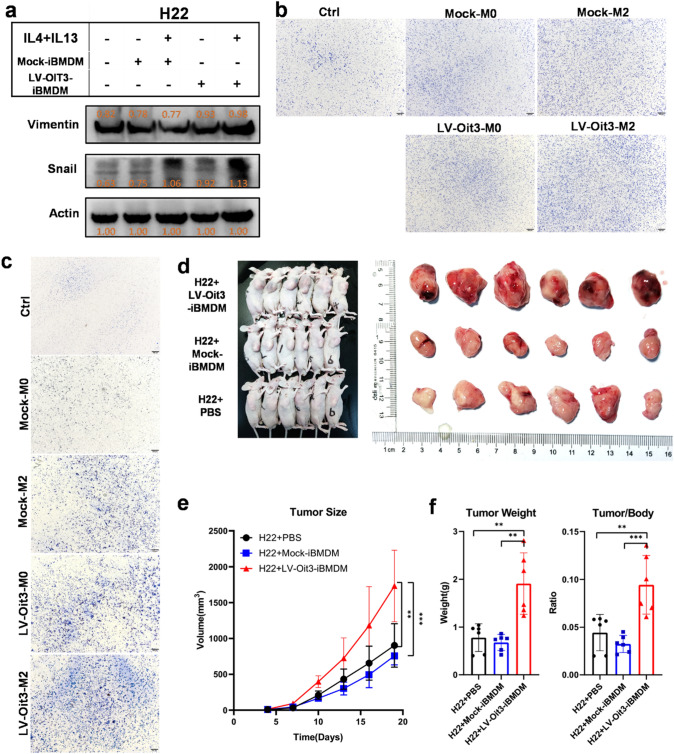
It is well known that M2 macrophages contribute to carcinogenesis and cancer development [11, 12, 14, 36]. We found that OIT3-overexpressing M2 macrophages had increased levels of MMP2 and VEGFA that promoted cancer metastasis and progression (Fig. 6c). To better understand the molecular function of OIT3 in M2 macrophages, LV-Oit3-iBMDMs were cocultured with the HCC cell lines H22 and Hepa1-6. Interestingly, the expression of molecules related to invasion and metastasis—vimentin and Snail—was significantly increased in H22 cells cocultured with LV-Oit3-iBMDM than expression in H22 cells alone (Fig. 7a). The transwell experiment showed increased invasion and migration in the LV-Oit3-iBMDM–HCC cell coculture groups than that in negative control and mock groups (Fig. 7b, c). Moreover, the in vivo tumor volumes increased significantly in the H22 group co-injected with LV-Oit3-iBMDM than in mock group and control group. Similar results were observed in tumor weights or ratios of tumor weight versus the body weight (Fig. 7d, e). These results demonstrate that OIT3 promotes cancer development.
Fig. 7.
Macrophage OIT3 enhanced migration, invasion, and development of cancer. a The protein expression of Vimentin and Snail in H22 cells cocultured with Mock-iBMDMs or LV-Oit3-iBMDM with or without M2 polarized by IL4 and IL13. The orange values indicated the relative expression according to the density; the expression values were normalized against the expression of Actin. b Hepa1-6 cells were cocultured with Mock-iBMDMs or LV-Oit3-iBMDMs with or without M2 polarized by IL4 plus IL13 for 12 h. The ratios of immigrated cells versus area were 42.23, 52.25, 52.57, 62.39, and 62.75, respectively. c Hepa1-6 cells were cocultured with Mock-iBMDMs or LV-Oit3-iBMDMs with or without polarized by IL4 and IL13 for 24 h. The ratios of invasive cells versus area were 38.09, 69.93, 82.40, 85.56, and 108.75, respectively. d–f Mice were injected i.h. with H22 + PBS, H22 + Mock-iBMDM and H22 + LV-Oit3-iBMDM, respectively. Tumor entity view from groups (d), curves of tumor volume (e), tumor weight (left) and tumor/body ratio (right) (f). Data of e and f were are expressed as mean ± SEM (n = 6). **p < 0.01, ***p < 0.001
Discussion
Immunotherapy, especially PD1 or PD-L1 antibodies, has led to a paradigm shift in cancer treatment for several years. However, a majority of patients with HCC failed to benefit from immunotherapy [2, 3]. TAMs are significant components of the HCC microenvironment and are commonly associated with a poor prognosis in patients with HCC [13, 14]. Therefore, it is important to understand the pivotal roles of TAMs in the crosstalk between cytotoxic T cells and cancer cells in HCC progression, and develop novel effective treatment strategies. In this study, we found that accumulation of immune cells in paracancerous tissues correlated with tumor progression. OIT3 was validated as a novel marker of alternatively activated macrophages that play important roles in remodeling immunity and reprogramming metabolism of macrophages. Overexpression of OIT3 in macrophages enhanced cell migration and invasion in HCC cells and promoted cancer metastasis.
Paracancer tissues, also known as peritumor, tumor-nearby, or tumor-adjacent tissues, are widely used as normal internal reference in cancer studies. However, recent studies have shown that paracancer tissues are in a preneoplastic state with molecularly altered cells and abnormal immune features [7–10]. The data from our previous study validated that the infiltrated immune cells tended to accumulate in paracancer tissues [9] that are frequent sites for cancer progression and metastasis. The present study indicated that M2 macrophages of paracancer tissues facilitate cancer cell migration and invasion, and highlighted the indispensable role of paracancer tissue in the TME.
OIT3 is a liver-specific, zona pellucida domain-containing protein (LZP) that is primarily expressed in hepatocytes and rarely in other organs [37]. However, the expression of OIT3 significantly decreases in HCC. Interestingly, a study indicated that OIT3 had no significant effect on cancer cell proliferation in vitro and tumor growth in vivo [38]. Moreover, recent studies revealed that OIT3 maintains urate homeostasis in the renal tubules and is required for hepatic triacylglycerol transportation [39, 40]. In the present study, we identified OIT3 as a novel biomarker of M2 macrophages that performed as reliably as MRC1 and ARG1.
The metabolic profile of macrophages is closely associated with cancer progression and anticancer immunotherapy. mTOR, a serine/threonine kinase, mediates M1 polarization by reducing the secretion of antiinflammatory cytokines and increasing secretion of proinflammatory cytokines [41], whereas AMPK, a key factor in oxidative phosphorylation, suppresses M1 polarization by attenuating glycolysis [42]. In the present study, the expression of AMPK and mTOR both increased in macrophages overexpressing OIT3, indicating a relative paradox in reprogramming metabolism. The expression of key enzymes in lipid metabolism increased, whereas that of key enzymes in glycolysis decreased. Moreover, a majority of antiinflammatory cytokines and chemokines were highly expressed in M2 macrophages overexpressing OIT3. Additionally, these OIT3-overexpressing macrophages enhanced the migration and invasion of cancer cells and promoted tumorigenesis and progression.
In conclusion, the study identified OIT3 as a novel biomarker of M2 macrophages in paracancer tissues that remodeled immune features and reprogrammed metabolism in macrophages. Targeting OIT3 in macrophages may impede cancer cell migration and invasion and dampen tumorigenesis and cancer development.
Supplementary Information
Below is the link to the electronic supplementary material.
Acknowledgements
The authors would like to thank Feng Shao Ph.D. (Chinese Academy of Medical Sciences and National Institute of Biological Sciences) for providing iBMDM cells.
Abbreviations
- AMPK
Adenosine 5-monophosphate-activated protein kinase
- BMDM
Bone marrow-derived macrophage
- DEG
Differentially expressed gene
- GEO
Gene expression omnibus
- HCC
Hepatocellular carcinoma
- ICIs
Immune checkpoint inhibitors
- mTOR
The mechanistic target of rapamycin
- OIT3
Oncoprotein-induced transcript 3
- TAM
Tumor-associated macrophage
- TME
The tumor microenvironment
- WGCNA
Weighted gene co-expression network analysis
Author contributions
SY, Lu Zheng, XJ, and YL conceived the project and wrote the manuscript. YL, XJ, and LZ supervised the study. JZ and SY analyzed data and run experiments. YX, JW, HZ, JL, YZ, YC, LW, MZ participated in discussion. SY and JZ contributed equally to this work. All authors have read and agreed to the published version of the manuscript.
Funding
This work was supported by the Major International (Regional) Joint Research Program of the National Natural Science Foundation of China (No. 81920108027), Chongqing Outstanding Youth Science Foundation (No. cstc2020jcyj-jqX0030), and Funding for University Innovation Research Group of Chongqing, Natural Science Foundation of Chongqing (No. cstc2021jcyj-msxm0926).
Data availability
All data generated or analyzed during this study are described in the methods or included in the supplementary materials.
Declarations
Conflict of interest
The authors declare no competing interests.
Consent to participate
Informed consent was obtained from all individual participants included in the study.
Ethics approval
This study was performed in line with the principles of the Declaration of Helsinki. Approvals were obtained by the Institutional Review Board of the Army Medical University and Chongqing University.
Footnotes
Publisher's Note
Springer Nature remains neutral with regard to jurisdictional claims in published maps and institutional affiliations.
Shuai Yang and Jiangang Zhang have contributed equally to this work.
Contributor Information
Lu Zheng, Email: xqyyzl1@163.com.
Xiaohui Ji, Email: 15023245186@163.com.
Yongsheng Li, Email: lys@cqu.edu.cn.
References
- 1.Sung H, Ferlay J, Siegel RL, Laversanne M, Soerjomataram I, Jemal A, et al. Global cancer statistics 2020: globocan estimates of incidence and mortality worldwide for 36 cancers in 185 countries. CA Cancer J Clin. 2021;71:209–249. doi: 10.3322/caac.21660. [DOI] [PubMed] [Google Scholar]
- 2.Yang JD, Heimbach JK. New advances in the diagnosis and management of hepatocellular carcinoma. BMJ. 2020;371:m3544. doi: 10.1136/bmj.m3544. [DOI] [PubMed] [Google Scholar]
- 3.Llovet JM, Montal R, Sia D, Finn RS. Molecular therapies and precision medicine for hepatocellular carcinoma. Nat Rev Clin Oncol. 2018;15:599–616. doi: 10.1038/s41571-018-0073-4. [DOI] [PubMed] [Google Scholar]
- 4.Galon J, Bruni D. Tumor immunology and tumor evolution: Intertwined histories. Immunity. 2020;52:55–81. doi: 10.1016/j.immuni.2019.12.018. [DOI] [PubMed] [Google Scholar]
- 5.Zhu AX, Finn RS, Edeline J, Cattan S, Ogasawara S, Palmer D, et al. Pembrolizumab in patients with advanced hepatocellular carcinoma previously treated with sorafenib (keynote-224): a non-randomised, open-label phase 2 trial. Lancet Oncol. 2018;19:940–952. doi: 10.1016/s1470-2045(18)30351-6. [DOI] [PubMed] [Google Scholar]
- 6.El-Khoueiry AB, Sangro B, Yau T, Crocenzi TS, Kudo M, Hsu C, et al. Nivolumab in patients with advanced hepatocellular carcinoma (checkmate 040): an open-label, non-comparative, phase 1/2 dose escalation and expansion trial. Lancet (London, England) 2017;389:2492–2502. doi: 10.1016/s0140-6736(17)31046-2. [DOI] [PMC free article] [PubMed] [Google Scholar]
- 7.Hoshida Y, Villanueva A, Kobayashi M, Peix J, Chiang DY, Camargo A, et al. Gene expression in fixed tissues and outcome in hepatocellular carcinoma. N Engl J Med. 2008;359:1995–2004. doi: 10.1056/NEJMoa0804525. [DOI] [PMC free article] [PubMed] [Google Scholar]
- 8.Aran D, Camarda R, Odegaard J, Paik H, Oskotsky B, Krings G, et al. Comprehensive analysis of normal adjacent to tumor transcriptomes. Nat Commun. 2017;8:1077. doi: 10.1038/s41467-017-01027-z. [DOI] [PMC free article] [PubMed] [Google Scholar]
- 9.Yeung OW, Lo CM, Ling CC, Qi X, Geng W, Li CX, et al. Alternatively activated (m2) macrophages promote tumour growth and invasiveness in hepatocellular carcinoma. J Hepatol. 2015;62:607–616. doi: 10.1016/j.jhep.2014.10.029. [DOI] [PubMed] [Google Scholar]
- 10.Graham K, Ge X, de Las MA, Tripathi A, Rosenberg CL. Gene expression profiles of estrogen receptor–positive and estrogen receptor–negative breast cancers are detectable in histologically normal breast epithelium. Clin Cancer Res. 2011;17:236–246. doi: 10.1158/1078-0432.CCR-10-1369. [DOI] [PMC free article] [PubMed] [Google Scholar]
- 11.Krenkel O, Tacke F. Liver macrophages in tissue homeostasis and disease. Nat Rev Immunol. 2017;17:306–321. doi: 10.1038/nri.2017.11. [DOI] [PubMed] [Google Scholar]
- 12.Komohara Y, Fujiwara Y, Ohnishi K, Takeya M. Tumor-associated macrophages: potential therapeutic targets for anti-cancer therapy. Adv Drug Deliv Rev. 2016;99:180–185. doi: 10.1016/j.addr.2015.11.009. [DOI] [PubMed] [Google Scholar]
- 13.Gok Yavuz B, Hasanov E, Lee SS, Mohamed YI, Curran MA, Koay EJ, et al. Current landscape and future directions of biomarkers for immunotherapy in hepatocellular carcinoma. J Hepatocell Carcinoma. 2021;8:1195–1207. doi: 10.2147/jhc.S322289. [DOI] [PMC free article] [PubMed] [Google Scholar]
- 14.Mantovani A, Allavena P. The interaction of anticancer therapies with tumor-associated macrophages. J Exp Med. 2015;212:435–445. doi: 10.1084/jem.20150295. [DOI] [PMC free article] [PubMed] [Google Scholar]
- 15.Zhao H, Yan G, Zheng L, Zhou Y, Sheng H, Wu L, et al. Stim1 is a metabolic checkpoint regulating the invasion and metastasis of hepatocellular carcinoma. Theranostics. 2020;10:6483–6499. doi: 10.7150/thno.44025. [DOI] [PMC free article] [PubMed] [Google Scholar]
- 16.Zhang B, Horvath S. A general framework for weighted gene co-expression network analysis. Stat Appl Genet Mol Biol. 2005 doi: 10.2202/1544-6115.1128. [DOI] [PubMed] [Google Scholar]
- 17.Langfelder P, Horvath S. Wgcna: an r package for weighted correlation network analysis. BMC Bioinform. 2008;9:559. doi: 10.1186/1471-2105-9-559. [DOI] [PMC free article] [PubMed] [Google Scholar]
- 18.Zhang X, Wu L, Xu Y, Yu H, Chen Y, Zhao H, et al. Microbiota-derived ssl6 enhances the sensitivity of hepatocellular carcinoma to sorafenib by down-regulating glycolysis. Cancer Lett. 2020;481:32–44. doi: 10.1016/j.canlet.2020.03.027. [DOI] [PubMed] [Google Scholar]
- 19.Li Y, Guo B, Xie Q, Ye D, Zhang D, Zhu Y, et al. Stim1 mediates hypoxia-driven hepatocarcinogenesis via interaction with hif-1. Cell Rep. 2015;12:388–395. doi: 10.1016/j.celrep.2015.06.033. [DOI] [PubMed] [Google Scholar]
- 20.Wickham H. Ggplot2: elegant graphics for data analysis. New York: Springer-Verlag; 2016. [Google Scholar]
- 21.Yang Z, Li Q, Wang X, Jiang X, Zhao D, Lin X, et al. C-type lectin receptor lsectin-mediated apoptotic cell clearance by macrophages directs intestinal repair in experimental colitis. Proc Natl Acad Sci USA. 2018;115:11054–11059. doi: 10.1073/pnas.1804094115. [DOI] [PMC free article] [PubMed] [Google Scholar]
- 22.Bénézech C, Nayar S, Finney BA, Withers DR, Lowe K, Desanti GE, et al. Clec-2 is required for development and maintenance of lymph nodes. Blood. 2014;123:3200–3207. doi: 10.1182/blood-2013-03-489286. [DOI] [PMC free article] [PubMed] [Google Scholar]
- 23.Rydz N, Swystun LL, Notley C, Paterson AD, Riches JJ, Sponagle K, et al. The c-type lectin receptor clec4m binds, internalizes, and clears von willebrand factor and contributes to the variation in plasma von willebrand factor levels. Blood. 2013;121:5228–5237. doi: 10.1182/blood-2012-10-457507. [DOI] [PMC free article] [PubMed] [Google Scholar]
- 24.Cereijo R, Gavaldà-Navarro A, Cairó M, Quesada-López T, Villarroya J, Morón-Ros S, et al. Cxcl14, a brown adipokine that mediates brown-fat-to-macrophage communication in thermogenic adaptation. Cell Metab. 2018;28:750–63.e6. doi: 10.1016/j.cmet.2018.07.015. [DOI] [PubMed] [Google Scholar]
- 25.Tang B, Zhu J, Zhao Z, Lu C, Liu S, Fang S, et al. Diagnosis and prognosis models for hepatocellular carcinoma patient's management based on tumor mutation burden. J Adv Res. 2021;33:153–165. doi: 10.1016/j.jare.2021.01.018. [DOI] [PMC free article] [PubMed] [Google Scholar]
- 26.Thorsson V, Gibbs DL, Brown SD, Wolf D, Bortone DS, Ou Yang TH, et al. The immune landscape of cancer. Immunity. 2018;48(812–30):e14. doi: 10.1016/j.immuni.2018.03.023. [DOI] [PMC free article] [PubMed] [Google Scholar]
- 27.Newman AM, Steen CB, Liu CL, Gentles AJ, Chaudhuri AA, Scherer F, et al. Determining cell type abundance and expression from bulk tissues with digital cytometry. Nat Biotechnol. 2019;37:773–782. doi: 10.1038/s41587-019-0114-2. [DOI] [PMC free article] [PubMed] [Google Scholar]
- 28.Newman AM, Liu CL, Green MR, Gentles AJ, Feng W, Xu Y, et al. Robust enumeration of cell subsets from tissue expression profiles. Nat Methods. 2015;12:453–457. doi: 10.1038/nmeth.3337. [DOI] [PMC free article] [PubMed] [Google Scholar]
- 29.Chen B, Khodadoust MS, Liu CL, Newman AM, Alizadeh AA. Profiling tumor infiltrating immune cells with cibersort. Methods Mol Biol. 2018;1711:243–259. doi: 10.1007/978-1-4939-7493-1_12. [DOI] [PMC free article] [PubMed] [Google Scholar]
- 30.Zuccolo J, Deng L, Unruh TL, Sanyal R, Bau JA, Storek J, et al. Expression of ms4a and tmem176 genes in human b lymphocytes. Front Immunol. 2013;4:195. doi: 10.3389/fimmu.2013.00195. [DOI] [PMC free article] [PubMed] [Google Scholar]
- 31.Fischer-Riepe L, Daber N, Schulte-Schrepping J, Véras De Carvalho BC, Russo A, Pohlen M, et al. Cd163 expression defines specific, irf8-dependent, immune-modulatory macrophages in the bone marrow. J Allergy Clin Immunol. 2020;146:1137–1151. doi: 10.1016/j.jaci.2020.02.034. [DOI] [PubMed] [Google Scholar]
- 32.Liu D, Lu Q, Wang X, Wang J, Lu N, Jiang Z, et al. Lsectin on tumor-associated macrophages enhances breast cancer stemness via interaction with its receptor btn3a3. Cell Res. 2019;29:365–378. doi: 10.1038/s41422-019-0155-6. [DOI] [PMC free article] [PubMed] [Google Scholar]
- 33.Kim KH, Choi BK, Kim YH, Han C, Oh HS, Lee DG, et al. Extracellular stimulation of vsig4/complement receptor ig suppresses intracellular bacterial infection by inducing autophagy. Autophagy. 2016;12:1647–1659. doi: 10.1080/15548627.2016.1196314. [DOI] [PMC free article] [PubMed] [Google Scholar]
- 34.Chakarov S, Lim HY, Tan L, Lim SY, See P, Lum J, et al. Two distinct interstitial macrophage populations coexist across tissues in specific subtissular niches. Science (New York, N.Y.) 2019 doi: 10.1126/science.aau0964. [DOI] [PubMed] [Google Scholar]
- 35.Lim HY, Lim SY, Tan CK, Thiam CH, Goh CC, Carbajo D, et al. Hyaluronan receptor lyve-1-expressing macrophages maintain arterial tone through hyaluronan-mediated regulation of smooth muscle cell collagen. Immunity. 2018;49:326–41.e7. doi: 10.1016/j.immuni.2018.06.008. [DOI] [PubMed] [Google Scholar]
- 36.Lee YH, Tai D, Yip C, Choo SP, Chew V. Combinational immunotherapy for hepatocellular carcinoma: radiotherapy, immune checkpoint blockade and beyond. Front Immunol. 2020;11:568759. doi: 10.3389/fimmu.2020.568759. [DOI] [PMC free article] [PubMed] [Google Scholar]
- 37.Xu ZG, Du JJ, Cui SJ, Wang ZQ, Huo KK, Li YY, et al. Identification of lzp gene from mus musculus and rattus norvegicus coding for a novel liver-specific zp domain-containing secretory protein. DNA Seq J DNA Seq Mapp. 2004;15:81–87. doi: 10.1080/10425170310001652200. [DOI] [PubMed] [Google Scholar]
- 38.Xu ZG, Du JJ, Zhang X, Cheng ZH, Ma ZZ, Xiao HS, et al. A novel liver-specific zona pellucida domain containing protein that is expressed rarely in hepatocellular carcinoma. Hepatology. 2003;38:735–744. doi: 10.1053/jhep.2003.50340. [DOI] [PubMed] [Google Scholar]
- 39.Wu JX, He KY, Zhang ZZ, Qu YL, Su XB, Shi Y, et al. Lzp is required for hepatic triacylglycerol transportation through maintaining apolipoprotein b stability. PLoS Genet. 2021;17:e1009357. doi: 10.1371/journal.pgen.1009357. [DOI] [PMC free article] [PubMed] [Google Scholar]
- 40.Yan B, Zhang ZZ, Huang LY, Shen HL, Han ZG. Oit3 deficiency impairs uric acid reabsorption in renal tubule. FEBS Lett. 2012;586:760–765. doi: 10.1016/j.febslet.2012.01.038. [DOI] [PubMed] [Google Scholar]
- 41.Byles V, Covarrubias AJ, Ben-Sahra I, Lamming DW, Sabatini DM, Manning BD, et al. The tsc-mtor pathway regulates macrophage polarization. Nat Commun. 2013;4:2834. doi: 10.1038/ncomms3834. [DOI] [PMC free article] [PubMed] [Google Scholar]
- 42.Wang S, Liu R, Yu Q, Dong L, Bi Y, Liu G. Metabolic reprogramming of macrophages during infections and cancer. Cancer Lett. 2019;452:14–22. doi: 10.1016/j.canlet.2019.03.015. [DOI] [PubMed] [Google Scholar]
Associated Data
This section collects any data citations, data availability statements, or supplementary materials included in this article.
Supplementary Materials
Data Availability Statement
All data generated or analyzed during this study are described in the methods or included in the supplementary materials.


