

Abstract

N-Methyl-pyrrolidone (NMP) is an important coating solvent for the production of lithium batteries, and its water content will greatly affect the coating quality and energy density of lithium batteries, which needs to be reduced to 200 ppm. The current vacuum distillation technology suffers from high operating costs and high energy consumption, whereas the pervaporation technology only achieves solvent dehydration up to 99.5%. Therefore, it is of great significance to carry out the study of trace water removal from NMP solvents. In this paper, the A-type molecular sieve adsorption method was used to remove trace water from the NMP solvent, and the effects of molecular sieve type, particle size, adsorption temperature, feeding amount, and contact time on the dehydration performance of NMP system were first investigated. Adsorbed at 25 °C for 240 min at a feeding amount of 120 g/L, 3A molecular sieves were able to reduce the water content of the NMP solvent from 5000 to 140 ppm. Second, Langmuir and Freundlich equations were used to fit the static isothermal adsorption data, and the results showed a better correlation of the Langmuir equation. Then, the adsorption kinetics and diffusion mechanism were analyzed by the kinetic model and the Crank single-pore diffusion model. The R2 of the pseudo-first-order kinetic model was 0.9993, which was more suitable for describing the process of adsorption of water from the NMP solvent by 3A molecular sieves, and the effective diffusion coefficient De = 2.986 × 10⁻⁸ cm2/s was calculated for the Crank single-pore adsorption model, which proved water molecules on the 3A molecular sieve. The diffusion of water molecules on the inner surface of the pores is the controlling step of the adsorption process. Finally, the fixed-bed dynamic penetration curves were investigated to obtain the experimental data of fixed-bed adsorption, and the experimental data were fitted using the Thomas and Yoon–Nelson models, which showed that both models could describe the adsorption behavior of trace water in NMP solvents on 3A molecular sieves. This study provides a new idea for the removal of trace water in NMP systems, and a series of model fitting parameters provide basic data for industrial scale-up.
1. Introduction
N-Methyl pyrrolidone (NMP) is a polar organic solvent widely used in petrochemicals, high-precision electronics, circuit boards, and lithium battery production. With the vigorous promotion of mobile phones and new energy vehicles, the lithium battery industry is developing rapidly, and NMP accounts for up to 74% of the lithium battery industry.1−3 In the manufacturing process of lithium-ion batteries, NMP is mainly used in the positive electrode mixing pulping process, and the pulp is dried after the aluminum foil coating is completed, at which time the volatilization rate of NMP solvent is as high as 99%, generating a large amount of high-temperature exhaust gases.4 Discharging this exhaust gas directly into the atmosphere not only wastes raw materials and pollutes the environment but also increases the production cost of lithium batteries.5 Commonly used recycling methods are process combining condensing and freezing return air with water absorption and evacuation, process combining condensing and freezing of return air with rotor adsorption and evacuation, and water absorption tower direct discharge without return air recovery process. Due to the high energy consumption of the first two processes, the third process is mostly used in industry to recover the NMP off-gas to form a solution for recycling.6 Recycling the NMP solution is an important step in lithium battery manufacturing plants, which can effectively realize the resource utilization of NMP and promote the green and sustainable development of the lithium industry.7
The key to NMP waste liquid recovery lies in dehydration, and the commonly used dehydration methods include vacuum distillation technology and pervaporation membrane separation technology. Currently, vacuum distillation technology is generally used in industrial recovery of NMP waste liquid.8−10 Zheng et al.11 recovered high-purity NMP solvents with purity greater than 99.9% and water content less than 100 ppm through vacuum distillation technology. Zheng et al.12 recovered the NMP solvent with purity greater than 99.99% by using a low concentration of NMP aqueous solution as feedstock liquid. Although the purity of NMP recovered by distillation technology can meet the requirements, the process has many unavoidable disadvantages, such as high operating costs, complex operation, and serious environmental pollution, especially when the water content of the solvent is extremely low (<1%), the difficulty of distillation and separation will be greatly increased, and the energy consumption will be greatly increased. Pervaporation is an emerging membrane separation technology with the advantages of energy saving, high efficiency, and no secondary pollution.13−17 Sato et al.18 recovered NMP with a purity of 99.5 wt % by pervaporation using a high-silica CHA-type zeolite membrane. Sunitha et al.19 recovered NMP with a 99% purity by pervaporation using a polyether block amide membrane. Zeng et al.20,21 used NaA molecular sieve membranes which were used to recover electronic-grade NMP by pervaporation, and the purity of NMP after dehydration was greater than 99.9%. Pervaporation technology has a better dehydration effect at 1 to 30% water content in NMP, and its energy consumption and carbon dioxide emission are reduced significantly compared with distillation technology. However, there are some limitations of this technology, especially when the purity of NMP is greater than 99.5% or more, the separation performance of the membrane material decreases significantly, the separation factor decreases rapidly, and the repeated cycles not only increase the loss of NMP but also oxidize NMP under the high-temperature and oxygen environments, resulting in the contamination of the membrane material, which seriously shortens the life of the membrane. However, the water content of NMP greatly affects the coating quality and the energy density of lithium batteries, where a solvent moisture content of less than 200 ppm is required for the lithium battery production. Therefore, it is quite necessary to explore a cost-effective, energy-saving, and environment-friendly method for NMP-trace water removal that does not easily change the product properties.
As a result of the energy crisis and the increasing scale of industrial production, reducing production costs and increasing production efficiency are key to ensuring industrial competitiveness and sustainable development. Adsorption is a process in which a mobile phase is brought into contact with a porous material with a large surface area, that is, the adsorbent phase, so that the components to be separated in the mobile phase are selectively released or retained in the adsorbent. The adsorption separation technology has been widely used in the laboratory and industry due to its advantages of low energy consumption, being green and low-carbon, and high product purity. This technology is especially suitable for the deep dehydration of liquids and gases. There are many types of adsorbents, such as activated carbon, silica gel, resins, and metal organic frameworks. In particular, the development and application of synthetic zeolite molecular sieves as adsorbents have greatly contributed to the development of adsorption separation processes.22−24 Jin et al.25 used 5A and 3A molecular sieves to adsorb a water content of 35,390 ppm in a 2-MeTHF solution, and the water removal rates of the two molecular sieves were as high as 99.6% and 99.4%, respectively, and the water content of the solution was reduced to 130 and 200 ppm, respectively, when the feeding amount was 400 g/L. Zhang et al.26 studied the removal of trace water from anisole by adsorption, and for an aqueous solution of anisole at 580 ppm, the water content of the solvent after adsorption by 3A and 4A molecular sieves was in the range of 10–25 and 13–26 ppm, respectively. Zhao et al.27 used 4A molecular sieves to reduce the water content of dimethyl carbonate from 40 to 3 mg/L, effectively ensuring the application of dimethyl carbonate as an electrolyte solvent. Hendriyana et al.28 used 3A molecular sieves to reduce the water content of methanol solution from 2291 to 93 ppm. It can be seen that A-type molecular sieves have great potential in the field of deep dehydration of organic solvents and can effectively remove water from solvents in a very low range. However, molecular sieve adsorption has not been reported in the literature for trace water removal from NMP solvents.
In this paper, the molecular sieve adsorption method is proposed to be used to remove trace water from NMP solvents; the effects of molecular sieve type, particle size, adsorption temperature, feed amount, and contact time on the dehydration performance of the NMP system were investigated; and the adsorption mechanism was explored. Specific research includes the following: (1) selection of molecular sieves: The effects of molecular sieve type and particle size on the dewatering efficiency of the NMP system were investigated, and the cycling performance of different molecular sieves was compared so as to select the molecular sieve with the best effect. (2) Parameter optimization: The effects of temperature, feeding amount, and contact time on the water removal efficiency of the molecular sieve were studied to determine the optimum process conditions. (3) Adsorption isotherms were determined by fitting and analyzing isothermal adsorption data using the Langmuir and Freundlich equations. (4) Pseudo-first-order kinetic model, pseudo-second-order kinetic model, and Crank single-pore diffusion model were used to fit the kinetic experimental data to study the adsorption kinetics and diffusion mechanism. (5) The penetration curves of molecular sieves were investigated by fixed-bed dynamic adsorption experiments, the penetration curves of different flow rates and different bed heights were compared, the model was fitted using the Thomas model and the Yoon–Nelson model, and the fitted parameters were obtained, which provided basic data for industrial scale-up.
2. Experiments
2.1. Materials and Instruments
NMP used in the experiments was purchased from the Xilong Science Company. 3A, 4A, and 5A molecular sieves were purchased from the Shanghai McLean Biochemical Technology Company. The main instruments used in the experiment include a KLS-411 micromoisture analyzer, a water-bath constant temperature oscillator, a peristaltic pump, an electronic balance, a vacuum drying oven, a blast drying oven, and a muffle furnace.
2.2. Experimental Methods
2.2.1. Activation of Molecular Sieves
The internal structure of the molecular sieve is similar to that of a honeycomb, which is a pore channel with a uniform pore diameter and uniform size. These pores can pass small molecules, such as H2O, NH3, and methanol, and likewise adsorb many impurities. Therefore, sufficient activation before use is required to remove impurities in the pore size of the molecular sieve to ensure ideal adsorption of the target adsorbent by the molecular sieve. The activation method was as follows: the molecular sieve is placed in the crucible and calcined in the muffle furnace at 350 °C for 5 h, and the molecular sieve is taken out after the end of the procedure, immediately bottled, and stored in a vacuum drying oven for use to prevent the molecular sieve from absorbing water in the air and reduce the adsorption capacity.
2.2.2. Adsorption Experiments
2.2.2.1. Experimental Procedure for Selecting Molecular Sieves
450 mL of NMP solution at a concentration of 5000 ppm was prepared. 9 conical flasks of 100 mL were taken, and 50 mL of the prepared solution was added into each conical flask. 6 g of 3A, 4A, and 5A molecular sieves varying in particle sizes was added into separate conical flasks. The flasks were sealed with a sealing film and placed in a water-bath oscillator at 25 °C and 150 rpm for 24 h. Once the adsorption had saturated, a KLS-411 micromoisture analyzer was used to determine the water content of each flask’s solution.
2.2.2.2. Molecular Sieve Cycling Test Process
500 mL of NMP solution containing 5000 ppm water was prepared. 4A molecular sieves with a particle size of 1.5 mm each weighing 10 g were added to two conical flasks, and 50 mL of the prepared NMP solution was added into each flask, and the flasks were sealed with a sealing film and placed in a water-bath shaker. To minimize the effect of external diffusion, the rotational speed was set at 150 rpm/min, and the temperature was set at 25 °C to maintain the oscillations. After adsorption saturation, the water content of the solution in the conical flask was determined with a KLS-411 micromoisture analyzer and recorded as the first experiment. The two molecular sieves used for the first time were taken out and dried in a blast drying oven. The dried molecular sieves were calcined in a muffle furnace at 350 °C for 5 h and then taken out after the procedure was over. The second adsorption experiment was carried out with a calcined molecular sieve under the same conditions. By analogy, the adsorption–regeneration operation was carried out on the molecular sieve; the third, fourth, and fifth experiments were completed; and the experimental data were recorded.
2.2.2.3. Experimental Procedure for the Effect of Temperature on the Adsorption Properties of Molecular Sieves
Three 100 mL conical flasks were taken numbered and set aside to prepare 150 mL of NMP solution at a concentration of 5000 ppm, and 50 mL of prepared solution and 8 g of 3A molecular sieves were added to each conical flask, which was sealed at the mouth. The temperature of the water bath was set at 25, 35, and 45 °C respectively. After oscillation at 150 rpm for 24 h to ensure that the adsorption process was completely balanced, the residual water in the NMP solvent was determined.
2.2.2.4. Experimental Procedure of the Effect of Feeding Amount on the Adsorption Performance of a Molecular Sieve
Six 100 mL conical flasks were taken numbered and set aside. 300 mL of NMP solution at a concentration of 5000 ppm was prepared and filled into the six conical flasks equally. 2, 4, 6, 8, 10, and 12 g of 3A molecular sieves were added to each conical flask, and the conical flasks were sealed with a sealing film and then placed in a water-bath shaker. After the mixture was shaken at 25 °C and 150 rpm for 24 h to ensure complete equilibrium of the adsorption process, the residual water in the NMP solvent was determined.
2.2.2.5. Experimental Procedure for the Effect of Contact Time on the Adsorption Performance of Molecular Sieves
A 50 mL solution of NMP was prepared at a concentration of 5000 ppm and transferred to a conical flask. To the same flask, 6 g of a 3A molecular sieve was added, and then, the flask was sealed with a sealing film and placed on a shaker in a water bath. The water bath was set at 25 °C, and the shaker was oscillated at a rate of 150 rotations per minute. The samples were collected every 30 min to measure the water content in the NMP solvent. If the water content of the solution remained constant within a 30 min period, the experiment was terminated.
2.2.3. Static Adsorption Equilibrium Experiments
Eight conical bottles with a capacity of 100 mL were numbered for use. An electronic balance was used to weigh 3 g of particle size of 1.5–1.7 mm 3A molecular sieve nine copies, respectively, into the numbered conical flasks. 25 mL of NMP solution with varying water content was added to each conical flask, the flask’s mouth was sealed with a sealing film, and the flask was placed in a water-bath constant temperature oscillator. The temperature was maintained at 25 °C with regular shaking, and after 3 days of resting, the flask was opened. The residual water of the NMP solution in each conical flask was determined using a moisture analyzer, and the data were recorded.
2.2.4. Dynamic Adsorption Equilibrium Experiments
First, 1500 mL of NMP solution containing 5000 ppm of water was prepared, and then, 6 g of 3A molecular sieves was weighed, and the solution and molecular sieves were added into a conical flask with the mouth of the flask sealed. The conical flask was put into a water-bath shaker, the temperature was set at 25 °C, and the volume was kept at 150 rpm to reduce the effect of external diffusion for homogeneous oscillation. The samples were taken at intervals, and the water content was determined by a moisture analyzer. If the water content of the solution hardly changed within half an hour, the adsorption end point was reached, and the experiment was completed.
2.2.5. Fixed-Bed Experiments
The experimental setup for fixed-bed dynamic adsorption is shown in Scheme 1. The adsorption column was first filled with a certain amount of 3A molecular sieves. The original NMP solution stored in the raw material tank entered the adsorption column from the upper end of the column into full contact with the molecular sieve through a peristaltic pump at a constant flow rate and flowed through the bed from top to bottom for the dehydration experiment. The adsorbed NMP solvent flows out from the bottom end of the adsorption column, and the sample is taken after a certain time interval. The water content in the effluent is measured and recorded in an analyzer, and the experiment is completed if the sample water content remains constant for a long period of time. The concentration of the raw liquid is c0, a sample is taken at the outlet to test the water content of the product ci, and the volume of the effluent is noted as V.
Scheme 1. Diagram of the Fixed-Bed Dynamic Adsorption Experimental Device.

3. Results and Discussion
3.1. Selection of Molecular Sieves
The kinetic diameters of NMP and water molecules are 0.69 and 0.27 nm, respectively,29 and the pore diameters of 3A, 4A, and 5A molecular sieves are 0.3, 0.4, and 0.5 nm, respectively, and the pore diameters of the three molecular sieves are all in the middle of the water and NMP molecules so that selective adsorption can be formed. To select appropriate molecular sieves for water removal in an NMP system, 3A, 4A, and 5A molecular sieves with varying particle sizes were assessed regarding their ability to adsorb trace water in an NMP solution under equal experimental conditions. The water removal efficiency and residual water in the solvent after adsorption of three kinds of molecular sieves are shown in Figure 1, from which it can be clearly seen that the 3A molecular sieve has the highest water removal efficiency and the lowest water content in the solvent after adsorption, the 4A molecular sieve is next, the efficiency of the 5A molecular sieve is worse, and the residual moisture in the solvent after adsorption is on the high side. It is mainly because the cation outside the skeleton of the 5A molecular sieve is Ca2+, and the charge carried by Ca2+ is twice compared with that of Na+ and K+, so the number of ions in the 5A molecular sieve is only half compared with that of 3A and 4A molecular sieves, which makes the effective pore size of the 5A molecular sieve large, and the selective adsorption is poor. Therefore, the adsorption performance of the 5A molecular sieve is weaker than that of 3A and 4A molecular sieves.
Figure 1.

Effect of the molecular sieve type and the particle size on the NMP solvent water removal efficiency and water concentration.
Particle size is also one of the important factors affecting the water removal performance of molecular sieves, and this experiment was conducted on the basis of studying the type of molecular sieve at the same time to analyze the effect of particle size, respectively, selecting three kinds of molecular sieves with particle sizes of 1.5–1.7, 2–3, and 3–5 mm for the adsorption experiments. The effect of particle size on the adsorption effect is shown in Figure 1; regardless of 3A, 4A, or 5A molecular sieves, the water removal effect of molecular sieves with the smaller particle size is higher than that of those with the larger particle size. Therefore, molecular sieves with a particle size of 1.5–1.7 mm are preferred for adsorption and dehydration of the NMP solvent. Taking the NMP solvent with a water content of 5000 ppm as an example, when the feeding amount of molecular sieves was 120 g/L and the adsorption time was 300 min, the water removal efficiencies of 3A, 4A, and 5A molecular sieves were 98, 97, and 92%, respectively, and the solvent water contents after adsorption were 140, 170, and 310 ppm, respectively.
The data comparison shows that the adsorption performance of 3A and 4A molecular sieves on trace water in the NMP solvent is similar. In order to further compare performance, the cyclic test experiments were carried out on 3A and 4A molecular sieves with a particle size of 1.5 mm at the same time, and the results are shown in Figure 2. The cyclic test results of the molecular sieve 3A are shown in Figure 2a; with the increase of the number of cycles, the adsorption capacity of the molecular sieve has not been significantly reduced, and after five adsorption–regeneration experiments of the molecular sieve, the water removal efficiency of the molecular sieve was still less than 200 ppm after saturation adsorption, and the regeneration effect is better, indicating that the molecular sieve had a good reusability. The results of the cycling test of 4A molecular sieve are shown in Figure 2b, the three cycling results are better, the adsorption performance decreases after the fourth time, and the solvent water content does not meet the requirements. In comparison, the 3A molecular sieve has the best recycling effect. Through comprehensive screening of the molecular sieve type, particle size, and recycling effect, the 3A molecular sieve with a particle size of 1.5–1.7 mm was finally determined to be more suitable for absorbing trace water in the NMP solvent.
Figure 2.

3A (a) and 4A (b) molecular sieve recycling experiment.
3.2. Optimization of Adsorption Parameters
There are many factors affecting the adsorption effect, such as temperature, molecular sieve feeding amount, and contact time. This part analyzes the influence of the above three factors on the adsorption of trace water in the NMP solvent by a 3A molecular sieve.
To investigate the effect of temperature on the adsorption effect of molecular sieves, 8 g of molecular sieves was added to 50 mL of NMP solvent containing 5000 ppm of water, and the adsorption experiments were carried out at different temperatures to ensure that the adsorption process was completely equilibrated, and then the residual water in the NMP solvent was measured. The water removal effect of molecular sieves is shown in Figure 3. It can be seen from the figure that at 25, 35, and 45 °C, the water removal efficiency of the molecular sieve is 99, 96, and 94%, respectively, and the residual water in the solvent after adsorption is 100, 180, and 360 ppm, respectively, which can be clearly seen from the data. At 25 °C, the adsorption capacity of the molecular sieve for water is greater than that at 35 and 45 °C. That is, low temperature is more conducive to the adsorption of water by molecular sieves, because the rate of adsorption–desorption equilibrium in the system will be accelerated with the increase in temperature, but the molecular sieve adsorption of water is an exothermic process, and warming up the temperature is not conducive to the adsorption process.
Figure 3.

Effect of the temperature on the water removal performance of molecular sieves.
The influence of the molecular sieve feed amount on adsorption results is mainly manifested in the adsorption sites that play a role in adsorption. As the feed amount of the molecular sieve increases, the adsorption site increases, the adsorption effect on water molecules is obviously improved, and the water adsorption rate increases. If the feeding amount is reduced, the molecular sieve cannot provide enough adsorption sites and there is still a large amount of unadsorbed water in the solution after the adsorption reaches saturation so that the purity requirements of the product cannot be met. However, the amount of feed is never the more the better, too much feeding will not only cause a waste of resources but also increase production costs. Therefore, the study of the feeding amount is essential. The adsorption capacity of 3A molecular sieves on water molecules in the NMP solvent is shown in Figure 4, from which it can be clearly seen that the water removal rate of the molecular sieves increases rapidly with the increase of the feeding amount, while the residual water in the solvent after adsorption also significantly decreases. When using an original solution of the NMP solvent containing 5000 ppm water, the water removal efficiency is 89.4%, and the residual solvent water is approximately 400 ppm at a feeding amount of 40 g/L of molecular sieve. By increasing the feeding amount to 240 g/L, the water removal efficiency can reach 99.6%, resulting in a reduction of residual solvent water to around 100 ppm after adsorption. When the amount of a molecular sieve is 120 g/L, the water content of the solvent after adsorption is 140 ppm, and at this time, the solvent has met the requirements, and when the feeding amount is increased, the water removal efficiency of the molecular sieve slows down. Therefore, for the NMP solvent with a water content of 5000 ppm, the optimum feeding amount of a 3A molecular sieve should be 120 g/L. In the actual production, it should be reasonably dosed according to the water content of the solvent, which not only ensures a high water removal effect but also saves cost.
Figure 4.
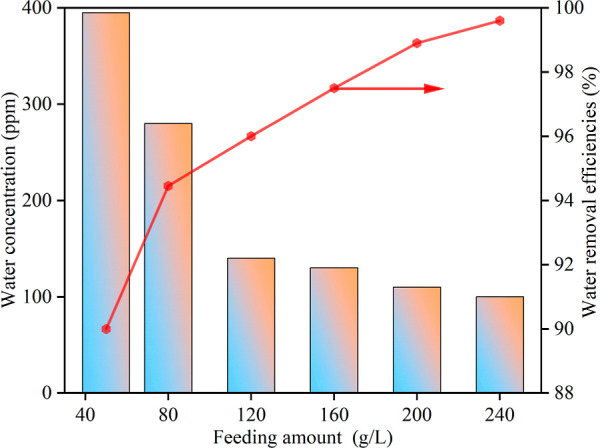
Influence of feeding amount on the water removal performance of a molecular sieve.
It is found that if the contact time between the solvent and the molecular sieve is too short, the adsorption process is not balanced, and the molecular sieve is not saturated. If the adsorption time is too long, it may cause a small amount of water in the molecular sieve to desorb into the solvent, so it is quite important to control the adsorption time during the entire adsorption process.
Figure 5 demonstrates the effect of the contact time on molecular sieves under the 120 g/L feeding amount. As shown in Figure 5a, the adsorption capacity and water removal rate of the molecular sieve increased rapidly with the extension of contact time during the contact time of 30–240 min, the adsorption of the molecular sieve was close to saturation, and the growth rate slowed down and tended to equilibrium after 240 min; at this time, the adsorption capacity of the molecular sieve was 0.048 mg/g, and the water removal efficiency was 98.5%. Figure 5b shows the alteration of the water content in the solvent during the adsorption process. The water content of the solvent reduces from the initial 5000 to 200 ppm after 30 min of adsorption. When the adsorption is continued for 240 min, the residual water in the solvent declines to 140 ppm, which satisfies the solvent content prerequisite for electronic-grade NMP. Extending the adsorption time to 300 min did not result in a significant change in the water removal rate and residual moisture of the molecular sieves. Therefore, for 5000 ppm of aqueous NMP solvent, the necessary adsorption time at 25 °C with a feed rate of 120 g/L was 240 min.
Figure 5.

Effects of different contact times on the water removal performance of molecular sieves (a) and the water content in NMP solvents (b).
3.3. Adsorption Isotherms
Both the experimental temperature and the concentration of adsorbate in solution at the adsorption equilibrium affect the equilibrium adsorption amount. When the experimental temperature is certain, the equilibrium adsorption amount is related to only the concentration of the adsorbate in the solution when the adsorption reaches equilibrium, and the adsorption isotherm is often used to visualize the relationship between the two. The adsorption isotherm is the curve that shows the relationship between the concentration of adsorbate in the liquid–solid phase and when the adsorption process reaches equilibrium. For dilute solution adsorption processes, equilibrium adsorption isotherms are commonly described by the Langmuir model and the Freundlich model.30 The Langmuir theory believes that adsorption is a single-molecular layer; that is, when all the adsorption sites on the surface of the adsorbent are filled by adsorbent molecules, the atomic force field on the surface of the adsorbent reaches a saturated state and no adsorption behavior can occur. The equation is shown in eq 1. The Langmuir relation is an ideal adsorption equation that represents the regularity when the adsorption reaches equilibrium on a homogeneous surface where the adsorbed molecules do not interact with each other and the adsorption is a monomolecular layer case.31 The Freundlich model is a semiempirical model showing that the adsorption is exponentially proportional to the pressure, which can be regarded as an extension of Henry’s adsorption equation,32 which is also more applicable for many adsorption processes in liquid phase systems, with the equations as in eq 2.
| 1 |
| 2 |
q—equilibrium adsorption capacity, mg/g; qm—saturated adsorption capacity, mg/g; b—Langmuir’s constant, L/mg; c—equilibrium concentration of adsorbent, mg/L; and k, n—constants related to the adsorbent and temperature.
To examine the adsorption process of 3A molecular sieves on trace water in the NMP solution, Langmuir and Freundlich equations were utilized to fit the static isothermal adsorption data of the adsorbent in this study. The fitted image is displayed in Figure 6, while Table 1 presents the fitted parameters. The investigation focused on ascertaining the mechanism of adsorption. From the data, the correlation coefficient R2 for the Langmuir model is 0.993, while R2 for the Freundlich model is 0.890. In contrast, Langmuir’s correlation coefficient is higher and more appropriate for accurately describing the experimental data. This indicates that the adsorption of water by 3A molecular sieves is akin to the adsorption on a single-molecular layer featuring a uniform surface and the absence of interaction forces between adsorbates as described by Langmuir’s isothermal model. The maximum saturated adsorption for water was 0.1132 mg/g, which closely aligned with the experimental value of 0.1098 mg/g. The 1/n value from fitting with the Freundlich equation is 0.187, indicating that the adsorption of water from NMP solutions by 3A molecular sieves is relatively effortless.
Figure 6.

Adsorption isothermal model curve fitting.
Table 1. Adsorption Isothermal Model Curve Fitting Parameters.
| 3A molecular sieves | relevant parameters | 25 °C | |
|---|---|---|---|
| Langmuir | qm | 0.113 | |
| b | 1.277 | ||
| R2 | 0.993 | ||
| equation | |||
| Freundlich | k | 0.065 | |
| 1/n | 0.187 | ||
| R2 | 0.890 | ||
| equation | q = 0.065c0.187 |
3.4. Adsorption Kinetics
Adsorption kinetics focuses on the time required for the adsorbent to reach dynamic adsorption equilibrium, thereby establishing the correlation between the adsorbent dosage and the adsorption time. If regarded as a reaction, the adsorption rate can be used to reflect the relationship between the adsorption capacity and adsorption time.33−35 In order to explore the adsorption mechanism of 3A molecular sieves on trace water in the NMP solution, the adsorption kinetic data of 3A molecular sieves on the trace water system of NMP with an initial concentration of 5000 ppm were measured in this study at an operating temperature of 25 °C. The pseudo-first-order kinetic model and the pseudo-second-order kinetic model were used to fit the experimental data, the mechanism of the adsorption process was explored through the regression of the kinetic model by building up the rate expression of specific adsorption process, and the equations of the two models are shown in eqs 3 and 4, respectively.
Figure 7 shows the kinetic experimental data and model fitting curves for the adsorption of trace water from the NMP solvent by 3A molecular sieves. From Figure 7a, which is a plot of the experimental test data, it can be seen that the equilibrium adsorption capacity of the 3A molecular sieve is 0.11 mg/g. The fitting curves of the pseudo-first-order kinetic model and the pseudo-second-order kinetic model are shown in Figure 7b,c, respectively, and the adsorption rates K1, K2 and the theoretical equilibrium adsorption quantities of the model, qe,cal, can be obtained from the fitting data, and the specific values are given in Table 2. The pseudo-first-order kinetic model was fitted, resulting in an R2 value of 0.9993 and a qe,cal value of 0.1096 mg/g. Additionally, the pseudo-second-order kinetic model was fitted, with an R2 value of 0.9883 and a qe,cal value of 0.136 mg/g. It can be seen from the data that the fitting curves of the two models are in good agreement with the experimental values. Compared with the pseudo-first-order kinetic model, the correlation is higher, and the equilibrium adsorption capacity is closer. Therefore, the pseudo-first-order kinetic model is more suitable to describe the adsorption process of water in the NMP solvent by the molecular sieve 3A, and the adsorption rate constant K1 is 0.0153, indicating that the process belongs to the physical adsorption process.
Figure 7.

Adsorption kinetic model fitting curve, (a) experimental value, (b) pseudo-first-order kinetic model, (c) pseudo-second-order kinetic model fitting curves, and (d) Crank single-pore adsorption model.
Table 2. Molecular Sieve Adsorption Kinetic Model Fitting Parameters.
| 3A molecular sieves | relevant parameters | 25 °C | |
|---|---|---|---|
| pseudo-first-order kinetic model | qe,cal/(mg/g) | 0.1096 | |
| K1 | 0.0153 | ||
| R2 | 0.9993 | ||
| equation | q = 0.1096(1 – e–0.0153t) | ||
| pseudo-second-order kinetic model | qe,cal/(mg/g) | 0.136 | |
| K2 | 0.113 | ||
| R2 | 0.9883 | ||
| equation | |||
| Crank single-pore adsorption model | qe,cal/(mg/g) | 0.11 | |
| De (cm2/s) | 2.986 × 10⁻⁸ | ||
| R2 | 0.9991 | ||
| equation |
The process of molecular sieve adsorption of trace water in solution mainly includes the following steps: (1) external diffusion of water molecules from the solution to the outer surface of the molecular sieve; (2) internal diffusion of water molecules from the outer surface of the molecular sieve into the pores; and (3) diffusion of water molecules from the inside of the pores to the inner surface of the molecular sieve.36 Step (3) is relatively fast and negligible, and the use of a shaker for uniform shaking reduces the interference of external diffusion. Therefore, the main part of the kinetic study is the internal diffusion of water molecules from the outer surface of the molecular sieve into the pores. Water molecules diffuse in molecular sieve pores in the following ways: free diffusion, Knudsen diffusion, surface diffusion, and solid diffusion.25,26,37 To analyze the adsorption of NMP solvent trace water by 3A molecular sieves belonging to the type of adsorption, it is necessary to calculate the diffusion coefficient so as to choose a suitable kinetic model. For the present system, the Crank single-pore diffusion model was chosen to describe the internal diffusion step,38−40 and the equation is given in eq 5.
| 3 |
| 4 |
| 5 |
| 6 |
qe—equilibrium adsorption capacity, mg/g; qt—adsorption capacity at time t, mg/g; t—adsorption time, s; K1—pseudo-first-order adsorption rate constant, min–1; K2—pseudo-second-order adsorption rate constants, g/(mg·min); De—effective diffusion coefficient, cm2/s; and r—adsorbent particle radius, cm.
When the adsorption of the molecular sieve reaches more than 65% of the equilibrium adsorption, the error is extremely small, so when n = 1 is taken, eq 5 can be simplified to eq 6 to find the effective diffusion coefficient De = 2.986 × 10⁻⁸ cm2/s. One should calculate qt by using t and qe to create a fitted curve, as depicted in Figure 7d. The De values obtained from calculations fall within the 10–9 to 10–8 orders of magnitude range, indicating that the Crank single-pore adsorption model is suitable for fitting the adsorption behavior of NMP and water systems on molecular sieves. Furthermore, these results demonstrate that the adsorption process is controlled by the diffusion of water molecules on the inner surfaces of the pore channels of 3A molecular sieves.
3.5. Fixed-Bed Dynamic Experiment
In the fixed-bed adsorption experiments, the concentration of key components of the effluent at the exit of the bed will change with the adsorption time, with the adsorption time as the horizontal coordinate, and the volume fraction of adsorbate in the fluid phase at the exit of the bed as the vertical coordinate to form a change curve; this curve is called the penetration curve. Penetration curves can be used to analyze fixed-bed adsorption processes. From the penetration curve, we can visualize whether the purity of the effluent product meets the requirements under the selected operating conditions and then analyze the adsorption capacity of the adsorbent on the adsorbent, the operating conditions required to meet the product requirements, etc.22,24
When designing a fixed-bed adsorption tower in engineering, obtaining basic data through calculation of the penetration curve is essential. Currently, the most precise and efficient method for determining the penetration curve is through experimentation. Moreover, the actual industry is impacted by numerous factors that also affect the penetration curve.26 In this part, the fixed-bed penetration curves were determined at a constant temperature and pressure for different bed heights and different flow rates. The model was also fitted by using the Thomas model and the Yoon–Nelson model, and the fitting parameters of the model were obtained to provide basic data for industrial scale-up.
3.5.1. Penetration Curves at Different Flow Rates
The penetration curves of 3A molecular sieves were determined in the NMP-trace water system, with an initial water content of 5000 ppm in the NMP solution. The bed had a height of 4 cm and an inner diameter of 2.4 cm, while flow rates of 2 and 4 mL/min were utilized, and the results are shown in Figure 8. At a flow rate of 2 mL/min, the penetration time of the molecular sieve was 780 min, and the water contained in the bed outlet liquid at this stage was less than 160 ppm, which fully met the experimental requirements. After 780 min, the water content in the outlet solution rapidly increased, while the molecular sieve did not adsorb any water molecules. By the end of 1320 min, the molecular sieve had lost its adsorption effect completely, resulting in the outlet solution’s water content being comparable to that of the raw material solution. When the flow rate reaches 4 mL/min, the molecular sieve takes 600 min to penetrate, and the average concentration of water in the outlet solution is less than 200 ppm. After 600 min, the concentration of water in the solution at the outlet began to increase substantially, at which time water molecules are no longer adsorbed by the molecular sieve; after 960 min, the bed is completely equilibrated, and the water content in the solution at the outlet is basically the same as that of the raw material solution.
Figure 8.

Penetration curves of molecular sieves at different flow rates.
At a flow rate of 4 mL/min, the penetration time of water on a 3A molecular sieve is lower than that of 2 mL/min, but the water content of the outflow of the former is higher than that of the latter, and the fixed-bed dynamic adsorption effect is better at a flow rate of 2 mL/min. Because the lower flow rate allows the contact time between the solvent and the molecular sieve to increase, the mass transfer zone is shortened, which makes the mass transfer more adequate and the adsorption effect better. However, an appropriate increase in the flow rate can improve the mass transfer efficiency and reduce the operating time.
3.5.2. Penetration Curves at Different Bed Heights
By analysis of the penetration curves at different flow rates, the flow rate was determined to be 2 mL/min. On this basis, the penetration curves of 3A molecular sieves in the adsorbed NMP-trace water system were determined at an initial water content of 5000 ppm in the NMP solution, an inner diameter of 2.4 cm, and bed heights of 4 and 8 cm, respectively, and the results are shown in Figure 9. The data at a bed height of 4 cm are consistent with the above results. When the bed height is 8 cm, the penetration time of the molecular sieve is 1080 min, and the water content of the outlet liquid of the bed at this stage is less than 140 ppm on average. The water content of the outlet liquid of the bed continues to increase after 1080 min, and the bed loses the adsorption capacity after 1620 min, and the water content of the outlet solvent is almost close to that of the feedstock liquid.
Figure 9.
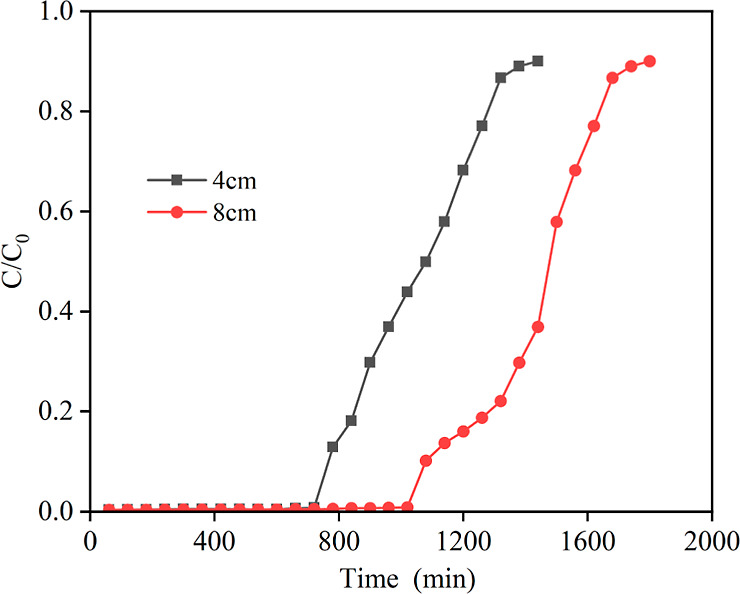
Penetration curves of molecular sieves at different bed heights.
The penetration time was 1080 min at a bed height of 8 cm, and the residual moisture in the solvent at the bed exit was less than 140 ppm, while the penetration time was 780 min at a bed height of 4 cm, and the residual moisture in the solvent at the bed exit was less than 200 ppm. The reason for the reduction in the adsorption capacity of the molecular sieve for water is attributed to the instability of the adsorption process, resulting from the weaker ability of the sieve to resist external interference during operation. This is caused by the lower bed and smaller loading of the molecular sieve. Consequently, the water content of the product before penetration was significantly increased. To enhance the performance, it is necessary to stabilize the adsorption process and increase the resistance of the sieve to external interference. Therefore, the higher the bed, the longer the penetration time required, the more stable the bed, and the longer the yield of compliant NMP obtained. In the adsorption process, it is important to select the bed height of the fixed bed wisely. If the bed height is too low, it can lead to an unstable adsorption effect. On the other hand, if the bed height is too high, it will result in increased pressure drop and energy consumption. Therefore, it is recommended to opt for a lower bed height as long as it fulfills the removal requirements and maintains a stable effect.
3.5.3. Thomas and Yoon–Nelson Model Fitting
To simulate and predict the adsorption patterns within fixed-bed adsorption columns, scholars have proposed various models based on various assumptions, such as the Thomas model, the Yoon–Nelson model, and the Adams–Bohart model.41−43 This study employed the Thomas and Yoon–Nelson models to fit the fixed-bed penetration data.
3.5.3.1. Thomas Model
The adsorption kinetic model for the Thomas fixed bed is an idealized model based on the Langmuir kinetic adsorption equation. The model can estimate the equilibrium adsorption amount and adsorption rate constant of the adsorbent in the fixed-bed adsorption process. Its expression is shown in (7), and the logarithmic eq 8 is obtained by organizing eq 7, and a straight line, i.e., the Thomas model fitting curve, can be obtained by t with ln[(C0/C) – 1].
| 7 |
| 8 |
C0—initial concentration of adsorbent, mg/mL; C—concentration of adsorbent at the outlet at different moments, mg/mL; K—Thomas rate constant, L·min–1·mg–1; qe—equilibrium adsorption capacity, mg/g; m—adsorbent quality, g; V—flow rate, mL/min; and t—adsorption time, min.
The Thomas equation was used to fit the experimental data under the different conditions described above; the fitted images are described in Figure 10, and the specific fitting parameters are shown in Table 3. From Figure 10 and Table 3, it is obvious that the experimental data correlate well with the Thomas equation; the correlation coefficient between the experimental values and the fitted Thomas equation is 0.998 for a flow rate of 2 mL/min and a bed height of 4 cm; the correlation coefficient between the experimental values and the fitted Thomas equation is 0.996 for a flow rate of 4 mL/min and a bed height of 4 cm; and the correlation coefficient between the experimental values and the Thomas equation fit is 0.995 for a flow rate of 2 mL/min and a bed height of 8 cm. The correlation coefficient R2 of the Thomas model fits for the three sets of experiments exceeded 0.995, with high correlation. It indicates that the Thomas model is suitable for describing the dynamic adsorption of water from NMP by 3A molecular sieves in a fixed bed.
Figure 10.
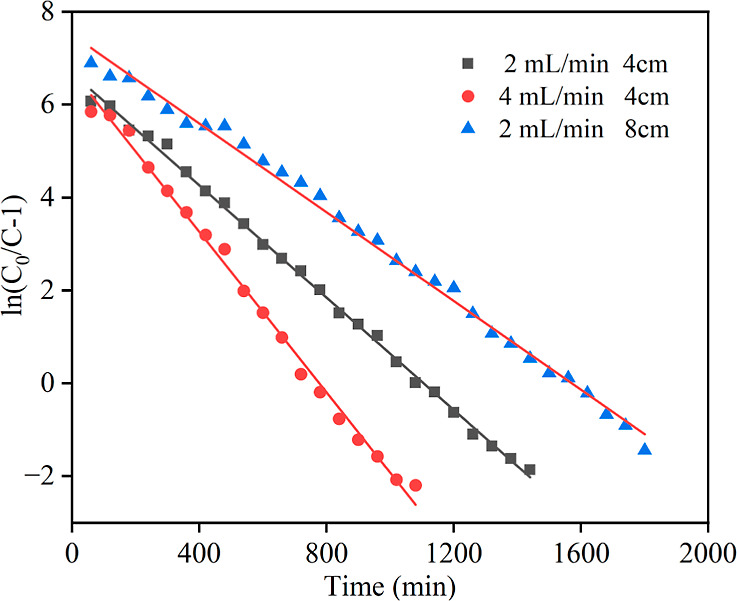
Fitted images of the Thomas model under different experimental conditions.
Table 3. Parameters of the Thomas Model Fitting under Different Experimental Conditions.
| experimental conditions | K/(mL·min–1·mg–1) | q0/(mg/g) | R2 |
|---|---|---|---|
| 2 mL/min, 4 cm | 0.00113 | 1.18 | 0.998 |
| 4 mL/min, 4 cm | 0.00162 | 1.16 | 0.996 |
| 2 mL/min, 8 cm | 0.0008 | 0.844 | 0.995 |
3.5.3.2. Yoon–Nelson Model
The Yoon–Nelson model is a semiempirical model, which is simpler compared to other dynamic adsorption models, and does not impose any particular restrictions on adsorbent types, characteristics, and physical features of the fixed bed. And the model does not have to consider the flow rate of the solution to be separated within the bed and the adsorbent dosage, which requires less known parameters. The expression is shown in eq 9, which is organized to obtain the logarithmic eq 10. According to eq 10, the Yoon–Nelson model fitting curve is obtained by plotting time t against ln[Ct/(C0 – Ct)]. Based on the fitting curve, the rate constant KYN and the time τ required for the discharge concentration to be 50% of the feed concentration can be obtained. Using the calculated value of τ, the equilibrium adsorption quantity qe-YN can be calculated by eq 11.
| 9 |
| 10 |
| 11 |
C0—initial concentration of adsorbent, mg/mL; Ct—concentration of adsorbent at the outlet at time t, mg/mL; KYN—rate constant, min–1; τ—time required for the concentration of adsorbent at the outlet to be 50% of the concentration of feedstock liquid, min; t—adsorption time, min.
The experimental data were fitted with the Yoon–Nelson equation, and the fitted images are shown in Figure 11, and the fitted parameters are shown in Table 4. The correlation coefficients of the Yoon–Nelson model fitted to the three experimental groups were 0.997, 0.994, and 0.995, respectively. The correlation coefficients of the fitted correlation coefficients R2 were more than 0.99, which were of high correlation. It indicates that the Yoon–Nelson model is also suitable for describing the dynamic adsorption process of 3A molecular sieves within a fixed bed.
Figure 11.

Fitted images of the Yoon–Nelson model under different experimental conditions.
Table 4. Parameters of the Yoon–Nelson Model Fitting under Different Experimental Conditions.
| experimental conditions | KYN/(mL·min–1·mg–1) | q0/(mg/g) | R2 |
|---|---|---|---|
| 2 mL/min, 4 cm | 0.00605 | 1.178 | 0.997 |
| 4 mL/min, 4 cm | 0.0875 | 1.565 | 0.994 |
| 2 mL/min, 8 cm | 0.000472 | 0.829 | 0.995 |
4. Conclusions
In this paper, the molecular sieve adsorption method was used to remove trace water from NMP solvents, the molecular sieves suitable for dehydration of the NMP system were identified, and the experimental conditions were optimized, based on which the adsorption mechanism was explored by adsorption isotherm, adsorption kinetics, and fixed-bed experiments. These modeling data provide support for the industrial production of trace water removal from the NMP solvent by molecular sieve adsorption, and the specific experimental conclusions are as follows:
-
(1)
By analyzing the results of molecular sieve types, particle sizes, and cycling tests, it was determined that 3A molecular sieves with a particle size of 1.5 mm were the most effective in adsorbing trace amounts of water in NMP solvents.
-
(2)
The 3A molecular sieve adsorbed the water content of the NMP solvent from 5000 to 140 ppm with a 98% water removal rate at 25 °C, a 120 g/L feed rate, and a 240 min contact time.
-
(3)
Langmuir and Freundlich equations were used to fit the adsorption equilibrium data of water in NMP on 3A molecular sieves. The correlation coefficient R2 of the Langmuir equation was 0.998, which had better correlation, indicating that the adsorption of water on 3A molecular sieves was similar to the adsorption of the monomolecular layer with a homogeneous surface and no interactions between adsorbates as described by the Langmuir isothermal model. Forces are similar to those of the monolayer adsorption described by the Langmuir isothermal model.
-
(4)
By analyzing the experimental kinetic data as well as the model fitting curves, it was found that the pseudo-first-order kinetic model has a better correlation, and the adsorption of water from NMP on 3A molecular sieves is a physical adsorption process. The Crank single-pore diffusion model was also used to fit the data, and the calculated results matched the experimental data, indicating that the diffusion of water molecules on the inner surface of the pores of 3A molecular sieves is the controlling step of the adsorption process.
-
(5)
The dynamic penetration curves of the fixed bed can be obtained that at the optimal flow rate and bed height, 3A molecular sieves can remove trace water from NMP to below 140 ppm, which meets the requirement of electronic-grade NMP. The experimental data were fitted and analyzed using the Thomas model and the Yoon–Nelson model, and the results showed that the fit of both models was relatively high. The obtained fitting parameters provide basic data support for industrial scale-up.
Acknowledgments
This research was supported by the Key Research and Development Program of Gansu Province (23YFGA0051) and the Major Science and Technology Project of Gansu Province (22ZD6GA013).
Author Contributions
Jiayi Zhang: formal analysis, writing original draft, and data curation. Jiali He: investigation and data curation. Guibing Wang: software and methodology. Haowen Ma: investigation and data curation. Xuecheng Zhan: conceptualization, investigation, and supervision. Dongqiang Zhang: conceptualization, funding acquisition, and supervision.
The authors declare no competing financial interest.
References
- Su Y.; Zhou K.; Yuan Y.; Liu W.; Deng Y. Study on prediction of binder distribution in the drying process of the coated web of positive electrode for lithium-ion battery. IOP Conf. Ser.: Mater. Sci. Eng. 2020, 793, 012025. 10.1088/1757-899X/793/1/012025. [DOI] [Google Scholar]
- Xiao Z.; Yin B.; Song L.; Kuang Y.; Zhao T.; Liu C.; Yuan R. Research progress of waste lithium-ion battery recycling process and its safety risk analysis. CIESC J. 2023, 74 (4), 1446–1456. 10.11949/0438-1157.20221550. [DOI] [Google Scholar]
- Ahmed S.; Nelson P.; Gallagher K.; Dees D. Energy impact of cathode drying and solvent recovery during lithium-ion battery manufacturing. J. Power Sources 2016, 322, 169–178. 10.1016/j.jpowsour.2016.04.102. [DOI] [Google Scholar]
- Zhang J.; He J.; Xie J.; Wang J.; Zhao Y.; Zhang D. Research progress of pervaporation technology for NMP recovery in lithium battery production. CIESC J. 2023, 74 (08), 3203–3215. 10.11949/0438-1157.20230541. [DOI] [Google Scholar]
- Di J.; Li G.; Zheng X.; Wang H. Review of recycling technology of NMP coating for lithium battery positive electrode. Guangdong Chem. Ind. 2020, 47 (3), 112–114. [Google Scholar]
- Li Y.; Xu X.; Chen X.; Song X. Comparison of NMP solvent recovery technology for manufacturing energy storage lithium-ion batteries. Chinese LABAT Man 2023, 60 (05), 245–250. [Google Scholar]
- Wang H.; Xie K.; Wang L.; Han Y. N-methyl-2-pyrrolidone as a solvent for the non-aqueous electrolyte of rechargeable Li-air batteries. J. Power Sources 2012, 219, 263–271. 10.1016/j.jpowsour.2012.07.065. [DOI] [Google Scholar]
- Wang H.; Wu B.; Jiang F.; Li C. Experimental study on distillation and purification of reclaimed NMP. J. Phys.: Conf. Ser. 2022, 2393, 012022. 10.1088/1742-6596/2393/1/012022. [DOI] [Google Scholar]
- Shen Z.; Fu Y.; He Q.; Yao M.; Liu Y.; Gao K.; Zhou X. Laboratory trail study on distillation NMP from the recovery liquid of lithium battery. Environ. Sci. Technol. 2014, 27 (05), 32–35. [Google Scholar]
- Ma X.; Huang W.; Li J. Simulation and optimization of NMP recovery process in lithium-ion battery production. Chin. Battery Ind. 2022, 26 (03), 141–144. [Google Scholar]
- Zheng X.; Liu J.; Di J.; Wang H. A brief discussion of NMP recovery based on one method of processes. Guangdong Chem. Ind. 2020, 47 (2), 89–90. [Google Scholar]
- Zheng S.; Huang P.; Huang Z.; Peng W.; Zou L.; Luo S. Simulation study on purification process of N-methylpyrrolidone recovery solution. Zhejiang Chem. Ind. 2022, 53 (03), 36–39. [Google Scholar]
- Ghosh U.; Pradhan N.; Adhikari B. Pervaporative recovery of N-methyl-2-pyrrolidone from dilute aqueous solution by using polyurethaneurea membranes. J. Membr. Sci. 2006, 285 (1–2), 249–257. 10.1016/j.memsci.2006.08.026. [DOI] [Google Scholar]
- Shao F.; Hao C.; Ni L.; Zhang Y.; Du R.; Meng J.; Liu Z.; Xiao C. Experimental and theoretical research on N-methyl-2-pyrrolidone concentration by vacuum membrane distillation using polypropylene hollow fiber membrane. J. Membr. Sci. 2014, 452, 157–164. 10.1016/j.memsci.2013.09.041. [DOI] [Google Scholar]
- Van Veen H.; Rietkerk M. D. A.; Shanahan D.; Van Tuel M. M. A.; Kreiter R.; Castricum H.; Ten Elshof J.; Vente J. Pushing membrane stability boundaries with HybSi® pervaporation membranes. J. Membr. Sci. 2011, 380 (1–2), 124–131. 10.1016/j.memsci.2011.06.040. [DOI] [Google Scholar]
- Tsai H.; Chen Y.; Lee K.; Lai J. Preparation of heat-treated PAN hollow fiber membranes for pervaporation of NMP/H2O mixtures. Sep. Purif. Technol. 2012, 100, 97–105. 10.1016/j.seppur.2012.09.005. [DOI] [Google Scholar]
- Prasad N.; Moulik S.; Bohra S.; Rani K.; Sridhar S. Solvent resistant chitosan/poly(ether-block-amide) composite membranes for pervaporation of n-methyl-2-pyrrolidone/water mixtures. Carbohydr. Polym. 2016, 136, 1170–1181. 10.1016/j.carbpol.2015.10.037. [DOI] [PubMed] [Google Scholar]
- Sato K.; Sugimoto K.; Shimotsuma N.; Kikuchi T.; Kyotani T.; Kurata T. Development of practically available up-scaled high-silica CHA-type zeolite membranes for industrial purpose in dehydration of N-methyl pyrrolidone solution. J. Membr. Sci. 2012, 409–410, 82–95. 10.1016/j.memsci.2012.03.032. [DOI] [Google Scholar]
- Sunitha K.; Yamuna Rani K.; Moulik S.; Satyanarayana S.; Sridhar S. Separation of NMP/water mixtures by nanocomposite PEBA membrane: part I. Membrane synthesis, characterization and pervaporation performance. Desalination 2013, 330, 1–8. 10.1016/j.desal.2013.09.016. [DOI] [Google Scholar]
- Zeng W.The research on pervaporative applications, fouling and regeneration of NaA zeolite membrane [Dissertation], Ning Bo University, 2020. [Google Scholar]
- Zeng W.; Li B.; Li H.; Li W.; Jin H.; Li Y. Mass produced NaA zeolite membranes for pervaporative recycling of spent N-Methyl-2-Pyrrolidone in the manufacturing process for lithium-ion battery. Sep. Purif. Technol. 2019, 228, 115741. 10.1016/j.seppur.2019.115741. [DOI] [Google Scholar]
- Lin R.; Ladshaw A.; Nan Y.; Liu J.; Yiacoumi S.; Tsouris C.; DePaoli D.; Tavlarides L. Isotherms for Water Adsorption on Molecular Sieve 3A: Influence of Cation Composition. Ind. Eng. Chem. Res. 2015, 54 (42), 10442–10448. 10.1021/acs.iecr.5b01411. [DOI] [Google Scholar]
- Lu Y.; Luan Y.; Yang J. Study on Water Content of MMA Adsorbed By 4A Molecular Sieve. China Plast. Ind. 2011, 39 (7), 76. [Google Scholar]
- Hao X.; Li H. Effects of water on structure and adsorption performance of molecular sieve. Mater. Sci. Technol. 2017, 25 (3), 13–18. 10.11951/j.issn.1005-0299.20160394. [DOI] [Google Scholar]
- Jin Y.Study on adsorption of water from 2-methyltetrahydrofuran by molecular sieves [Dissertation], Taiyuan University of Technology, 2019. [Google Scholar]
- Zhang L.Removal of trace water from anisole by adsorption [Dissertation], Tianjin University, 2013. [Google Scholar]
- Zhao J.; Zhang X.; Zhou S. Study on removal of trace water from dimethyl carbonate. Chem. Eng. Manage. 2022, 12, 141–143. [Google Scholar]
- Hendriyana B.; Prabowo L.; Nurdini G.; Trilaksono. Adsorption of water from methanol solution using various adsorbent. Proceedings of the 3rd International Symposium on Applied Chemistry, 2017; Vol. 1904, p 020031.
- Peng Y.; Wei X.; Wang Y.; Li W.; Zhang S.; Jin J. Metal-organic framework composite photothermal membrane for removal of high-concentration volatile organic compounds from water via molecular sieving. ACS Nano 2022, 16 (5), 8329–8337. 10.1021/acsnano.2c02520. [DOI] [PubMed] [Google Scholar]
- Feng Y.; Ning Z.; Liu H.; Kong D. Methane adsorption characteristics of gas shale. Special Oil & Gas Reservoirs 2013, 20 (5), 133–136. [Google Scholar]
- Wang T.; Tian S.; Li G.; Sheng M.; Ren W.; Liu Q.; Tan Y.; Zhang P. Experimental study of water vapor adsorption behaviors on shale. Fuel 2019, 248 (15), 168–177. 10.1016/j.fuel.2019.03.029. [DOI] [Google Scholar]
- Wang Q.; Jiang R.; Liu C. Study on adsorption capability for ammonia-nitrogen using X zeolite synthe-sized from coal gangue. New Chem. Mater. 2012, 40 (7), 129–131. [Google Scholar]
- Zhang M.; Liu G.; Liu R.; Xu J.; Si W.; Wei Y. High-efficient co-removal of copper and zinc by modified biochar derived from tea stalk: Characteristics, adsorption behaviors, and mechanisms. J. Water Proc. Eng. 2024, 57, 104533. 10.1016/j.jwpe.2023.104533. [DOI] [Google Scholar]
- Dang W.; Jiang S.; Zhang J.; Li P.; Nie H.; Liu Y.; Li F.; Sun J.; Tao J.; Shan C.; Tang X.; Wang R.; Yin Y. A systematic experimental and modeling study of water adsorption/desorption behavior in organic-rich shale with different particle sizes. Chem. Eng. J. 2021, 426, 130596. 10.1016/j.cej.2021.130596. [DOI] [Google Scholar]
- Chen Q.; Tian Y.; Li P.; Yan C.; Pang Y.; Zheng L.; Deng H.; Zhou W.; Meng X. Study on shale adsorption equation based on monolayer adsorption, multilayer adsorption, and capillary condensation. J. Chem. 2017, 2017, 1–11. 10.1155/2017/1496463. [DOI] [Google Scholar]
- Zavareh S.; Farrokhzad Z.; Darvishi F. Modification of zeolite 4A for use as an adsorbent for glyphosate and as an antibacterial agent for water. Ecotoxicol. Environ. Saf. 2018, 155, 1–8. 10.1016/j.ecoenv.2018.02.043. [DOI] [PubMed] [Google Scholar]
- Yang R.; Chen J.; Zhang Z.; Wu D. Performance and mechanism of lanthanum-modified zeolite as a highly efficient adsorbent for fluoride removal from water. Chemosphere 2022, 307, 136063. 10.1016/j.chemosphere.2022.136063. [DOI] [PubMed] [Google Scholar]
- Yang Y.; Liu J.; Yao J.; Kou J.; Li Z.; Wu T.; Zhang K.; Zhang L.; Sun H. Adsorption behaviors of shale oil in kerogen slit by molecular simulation. Chem. Eng. J. 2020, 387, 124054. 10.1016/j.cej.2020.124054. [DOI] [Google Scholar]
- Wynnyk K.; Hojjati B.; Marriott R. Sour gas and water adsorption on common high-pressure desiccant materials: zeolite 3A, zeolite 4A, and silica gel. J. Chem. Eng. Data 2019, 64 (7), 3156–3163. 10.1021/acs.jced.9b00233. [DOI] [Google Scholar]
- Goldsworthy M. Measurements of water vapour sorption isotherms for RD silica gel, AQSOA-Z01, AQSOA-Z02, AQSOA-Z05 and CECA zeolite 3A. Microporous Mesoporous Mater. 2014, 196, 59–67. 10.1016/j.micromeso.2014.04.046. [DOI] [Google Scholar]
- Köse T. E.; Öztürk N. Boron removal from aqueous solutions by ion-exchange resin: Column sorption-elution studies. J. Hazard. Mater. 2008, 152 (2), 744–749. 10.1016/j.jhazmat.2007.07.041. [DOI] [PubMed] [Google Scholar]
- Chowdhury Z.; Zain S.; Rashid A.; Rafique R.; Khalid K. Breakthrough curve analysis for column dynamics sorption of Mn(II) Ions from wastewater by using mangostana garcinia peel-based granular-activated carbon. J. Chem. 2013, 2013, 1–8. 10.1155/2013/959761. [DOI] [Google Scholar]
- Jeppu G.; Clement T. A modified Langmuir-Freundlich isotherm model for simulating pH-dependent adsorption effects. J. Contam. Hydrol. 2012, 129–130, 46–53. 10.1016/j.jconhyd.2011.12.001. [DOI] [PubMed] [Google Scholar]