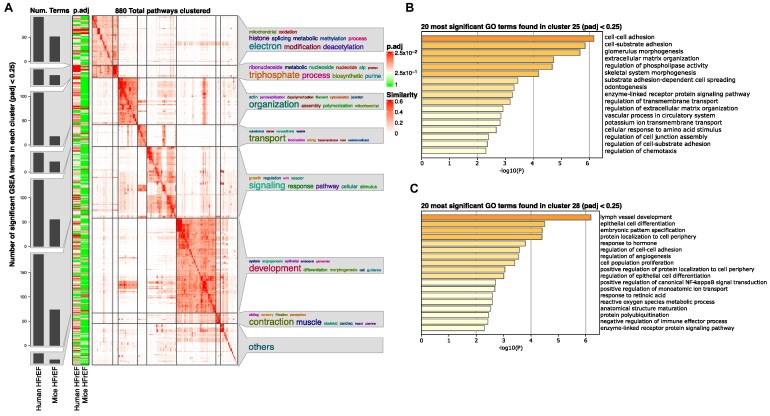
Figure 5:
GSEA analysis reveals more regulated pathways in heart failure in human cardiomyocytes than in mice, with the terms found sharing many keywords. (A) Heatmap clustering of significant GSEA results (P-adjusted < 0.25) of DEGs found in human and mouse cardiomyocytes by similar GeneIDs in the pathways. Bar graphs are shown on the left y-axis representing the number of pathways found in the respective cluster for the given species and condition. In addition, the adjusted P value is color-coded from 1 (green) to the smallest P value found, ∼0.025 (red). On the right side of the y-axis, keywords describing the found pathways in that cluster are shown, where the size of the word represents its frequency in the terms (larger = most, smaller = less). (B) Bar graph showing the first 20 GO terms found by analyzing genes in cluster 25. Terms were sorted by their logarithmized and Bonferroni-adjusted P values, resulting in high significant pathways depicted first (P-adjusted < 0.05). (C) Bar graph similar to (B) terms found in a subsection of genes in cluster 28.

