

Abstract
Background:
Most of the subjects eligible for annual low-dose computed tomography (LDCT) lung screening will not develop lung cancer for their life. It is important to identify novel biomarkers that can help identify those at risk of developing lung cancer and improve the efficiency of LDCT screening programs.
Objective:
This study aims to investigate the association between the morphology of the pulmonary circulatory system (PCS) and lung cancer development using LDCT scans acquired in the screening setting.
Methods:
We analyzed the PLuSS cohort of 3,635 lung screening patients from 2002–2016. Circulatory structures were segmented and quantified from LDCT scans. The time from the baseline CT scan to lung cancer diagnosis, accounting for death, was used to evaluate the prognostic ability (i.e., hazard ratio (HR)) of these structures independently and with demographic factors. Five-fold cross-validation was used to evaluate prognostic scores.
Results:
Intrapulmonary vein volume had the strongest association with future lung cancer (HR=0.63, p<0.001). The joint model of intrapulmonary vein volume, age, smoking status, and clinical emphysema provided the strongest prognostic ability (HR=2.20, AUC=0.74). The addition of circulatory structures improved risk stratification, identifying the top 10% with 28% risk of lung cancer within 15 years.
Conclusion:
PCS characteristics, particularly intrapulmonary vein volume, are important predictors of lung cancer development. These factors significantly improve prognostication based on demographic factors and non-circulatory patient characteristics, particularly in the long term. Approximately 10% of the population can be identified with risk several times greater than average.
Keywords: low dose CT, pulmonary circulatory system, lung cancer risk, image biomarker
I. INTRODUCTION
Lung cancer is responsible for a staggering 25% of all cancer-related deaths in the United States (U.S.) 1,2. The high mortality is partly attributed to the lack of early-stage symptoms and limited access to screening. The National Lung Screening Trial (NLST) showed that low-dose computed tomography (LDCT) scans can reduce lung cancer-related deaths by approximately 20% compared to chest X-rays 3,4. As a result, the Center for Medicare and Medicaid Services (CMS) has decided to cover annual lung cancer screening with LDCT scans for asymptomatic adults with a history of tobacco smoking. The NLST findings served as the primary motivation for this decision. In 2021, the U.S. Preventive Services Task Force (USPSTF) updated its recommendation for annual lung screening with LDCT. The updated guideline recommends annual screening for adults aged 50 – 80 years with a tobacco smoking history of 20 pack-years or more who either smoked or quit within the past 15 years 5. The updated recommendation expands the population eligible for LDCT lung screening by approximately 87%, resulting in 14.5 million people in the U.S. being eligible for screening 6.
Despite the promise of LDCT for lung cancer screening, the results from NLST show that only a tiny percentage of patients who underwent the procedure were diagnosed with lung cancer3,4. Out of the 53,454 smokers enrolled in the study, only 3.85% (2,058 subjects) were diagnosed with lung cancer, indicating that the majority of screened subjects did not develop the disease but are still recommended to have annual LDCT scans. This will not only cause unnecessary radiation exposure to those healthy subjects but also impose a significant economic burden on public health and low-income families. Additionally, it is worth mentioning that there are still 16% of women and 10% of men who never smoke but are diagnosed with lung cancer 7,8, underscoring the need for identifying additional biomarkers that can accurately assess the risk of developing the disease. The high cost and exposure to unnecessary radiation associated with LDCT scans also highlight the importance of finding more reliable methods for predicting lung cancer risk, by which a large portion (e.g., 30%–50%) of subjects eligible for LDCT lung cancer screening can be excluded from unnecessary annual screening (e.g., subjects with low risk of lung cancer will have an LDCT scan every 2–3 years instead of every year). The reduction of unnecessary screening by this personalized strategy could potentially further expand the eligibility for lung cancer screening without incurring additional cost burdens.
In this study, we leveraged an ongoing lung cancer screening program, namely the Pittsburgh Lung Screening Study (PLuSS) 9 starting in 2002, to systematically study the underlying relationship between pulmonary circulatory system (PCS) and lung cancer development. The goal is to clarify whether the morphological characteristics of PCS can serve as risk predictors for lung cancer. The underlying rationale of this study is that lung cancer development cannot be independent of its surrounding structures, especially the PCS that is responsible for delivering oxygen and nutrition to the lungs.
II. METHODS
A. Study population
We used a community-based research cohort, the Pittsburgh Lung Screening Study (PLuSS), to test the premise and develop the prediction models. The PLuSS cohort enrolled 3,642 current and ex-smokers, screened with baseline LDCT between 2002 and 2005, and followed for lung cancer 9. Excluded were individuals who: 1) quit smoking >10 years earlier, 2) reported a history of lung cancer, or 3) reported chest CT within one year of enrollment. Demographic and smoking history data were collected using structured interviews and questionnaires at baseline, and smoking status is updated yearly. Upon study entry, participants underwent LDCT screening and received a total of 3 LDCT over 2 years (T0, T1 and T2). Seven participants enrolled in the PLuSS but later refused the CT scan. As a result, this cohort has 3,635 patients observed from 2002 to 2006 (Table 1), which were involved in the data analyses. There were 1,769 (48.7%) women, 3,422 (94.1)% white, 200 (5.5%) black, and 13 (0.4%) other non-white race. Mean age at enrollment was 59.1 years (from 44 to 70), and 60.2% were current smokers. The cohort consists of roughly equal numbers of males and females, predominantly white individuals aged 44 and above, and over 60% of them are current smokers.
Table 1.
Demographic and other patients’ characteristics
| Variable | Summary |
|---|---|
|
| |
| 59. 09 (5.38) | |
| Age in years, mean (SD) | |
| Survival status, N (%) | 2314 (65.7) |
| Censor | 385 (10.6) |
| Cancer | 936 (25.8) |
| Non-cancer death | |
| Emphysema, N (%) | 1,546 (42.5) |
| Yes | 2,089 (57.5) |
| No | |
| Gender, N (%) | 1,769 (48.7) |
| Female | 5 ( 0.1) |
| Unknown | 1,861 (51.2) |
| Male | |
| Smoking, N (%) | 2,188 (60.2) |
| Current | 1,447 (39.8) |
| Former | |
| Race, N (%) | 3,422 (94.1) |
| White | 200 (5.5) |
| Black | 13 (0.4) |
| Non-White | |
| BMI, mean (SD) | 28.85 (5.48) |
As of the analysis cutoff date (07/30/2021), 1,218 (29.0%) patients have died, and 385 (10.6%) have developed lung cancer (including 282 patients who have died thereafter). Hence, 936 patients have died without known cancer. Among 1,218 patients who had died, approximately 138 (11.3%) died within 4 years, 370 (30.4%) within 8 years, and 690 (56.7%) within 12 years. Among 385 patients who had developed lung cancer, approximately 100 (25%) developed cancer within the first 4 years, and approximately 100 (25%) developed cancer after 12 years. The follow-up time ranged from 0.3 to 19 years, with a median of 17.5 years (Kaplan-Meier estimate).
This study was approved by the University of Pittsburgh Institutional Review Board (IRB) (IRB #: 21020128).
B. Pulmonary circulatory system (PCS) parameters
We used our available computer algorithms 10,11 to automatically segment PCS structures, including pulmonary arteries and veins, as well as heart regions, on LDCT scans (Figure. 1). Utilizing the lung volume segmentation 12, we further differentiated intra- and extra-pulmonary arteries and veins. The volumes of these structures were calculated based on the segmentation results.
Figure 1.
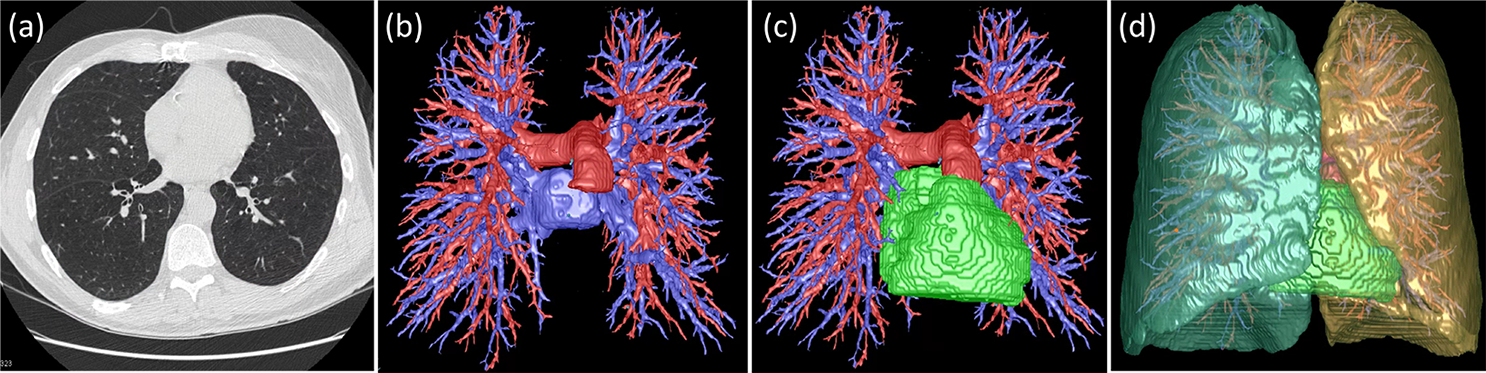
Automated segmentation of pulmonary circulatory system (PCS) structures on LDCT scans. (a) a LDCT scan, (b) segmented arteries (blue) and veins (red), (c) heart (green), and (d) right/left lungs.
C. Statistical analysis
The analysis of time from the baseline CT scans to the lung cancer diagnosis, accounting for the competing event of death (PROC PHREG, SAS v.9.4, SAS Institute, Cary, NC) 13, was used to evaluate patient demographics and other baseline characteristics, as well as CT-derived PCS characteristics in predicting lung cancer in the future. Continuous parameters were normalized and standardized (to mean zero and variance of ‘1’, after the logarithmic transformation) to improve the assessment’s robustness, enable the evaluation of ratios of the parameters, and facilitate the comparison of the relative effects. HR was used to evaluate individual significance both in univariate analyses and within the combined models. This was achieved by assessing the HR for a change from the reference group for categorical variables or an increase of one standard deviation for continuous variables. Our approach involved using a forward selection technique, which was subsequently confirmed through a process of backward elimination. The added prognostic ability was assessed by examining the improved performance of a prognostic score or linear predictor. This predictor was created by forming a linear combination of factors with the natural logarithm of HRs serving as coefficients. For these evaluations, the performance of a five-fold cross-validated prognostic score was quantified by HR for one standard deviation change. The standard time-dependent receiver operating characteristic (ROC) analysis was used to illustrate the prognostic ability of different models over the considered time range (by counting death before lung cancer being at risk at all considered time points). Based on observed lung cancer in approximately 10% of participants, the cross-validated prognostic score of the overall model was used to define the risk strata by grouping the top 10% of participants as “high risk”, the bottom 50% as “low risk”, and the remaining as “intermediate risk” that is used for illustrating the prognostic potential. Cumulative incidence function and Gray’s test (PROC LifeTest, SAS v.9.4) were used to evaluate the final risk strata.
III. RESULTS
A. Cumulative incidence function and overall survival
Table 2 summarizes the computed PCS parameters based on the LDCT scans in our cohort. Based on our study cohort with a cutoff day of 07/30/2021, the cumulative incidence rate of lung cancer reached 11.2%, and the overall survival rate dropped to 60% by 19 years. At 17.5 years, the incidence of lung cancer was 10.7%, and the overall survival rate was 67%, respectively. Participants in this cohort had an 80% chance of surviving within 12 years from the first CT scan (approximately at the time of enrollment) with a 7.7% risk of developing lung cancer (Figure. 2).
Table 2.
Mean values (and standard deviations) of the raw pulmonary circulatory system (PCS) parameters computed from LDCT chest CT scans in our cohort (n=3,635)
| Volumes (in liters) | Smoking status | Sex | Overall (n=3,635) | |||
|---|---|---|---|---|---|---|
| Current (n=2,188) | Former (n=1,447) | Male (n=1,861) | Unknown (n=5) | Female (n=1,769) | ||
| Heart volume | 0.536 (0.126) | 0.570 (0.137) | 0.617 (0.128) | 0.584 (0.052) | 0.478 (0.092) | 0.550 (0.131) |
| Extra artery volume | 0.092 (0.022) | 0.097 (0.023) | 0.107 (0.021) | 0.117 (0.015) | 0.081 (0.017) | 0.094 (0.023) |
| Extra vein volume | 0.084 (0.021) | 0.090 (0.023) | 0.093 (0.023) | 0.090 (0.013) | 0.079 (0.018) | 0.086 (0.022) |
| Intra artery volume | 0.096 (0.023) | 0.095 (0.022) | 0.109 (0.019) | 0.106 (0.022) | 0.081 (0.016) | 0.095 (0.022) |
| Intra vein volume | 0.091 (0.021) | 0.088 (0.021) | 0.099 (0.021) | 0.080 (0.017) | 0.081 (0.017) | 0.090 (0.021) |
Extra – extrapulmonary, Intra – intrapulmonary
Figure 2.

Cumulative incidence function (left) for lung cancer with a competing event of death and the overall survival probability (right) up to 19 years after baseline CT scan (based on 3635 participants with 385 lung cancers and 936 deaths)
B. Demographics and future lung cancer development
Table 3 summarizes the hazard ratios of lung cancer and the corresponding p-value for the demographic and other characteristics of the study participants. Among the patient characteristics, the presence of emphysema had the strongest association with future lung cancer (HR= 2.5, 95% CI: 2.1–3.1). In our data, the presence of emphysema was associated with multiple patient characteristics, showing higher prevalence (with p<0.01) among males, current smokers, older, and low-BMI participants. In the multivariate model, emphysema as well as age and smoking status remained statistically significant predictors (p<0.001). Adjustment for these factors reveals no meaningful association between BMI and future lung cancer in this cohort (HR=0.99, 95%CI: 0.90–1.09), indicating that the standalone relevance of BMI appeared to be confounded by the smoking and emphysema statuses (both associated with lower BMI).
Table 3.
Participant characteristics and their association with future lung cancer diagnosis
| Univariate/standalone | Multivariable/joint* | |||
|---|---|---|---|---|
| Characteristics (non-reference level) | Hazard Ratio | p-value | Hazard Ratio | p-value |
| Sex (Female) | 0.85 | 0.12 | --- | --- |
| Age | 1.50** | <.001 | 1.46 | <.001 |
| Smoking Status (current smoker) | 1.65 | <.001 | 1.75 | <.001 |
| Race (White) | 0.93 | 0.74 | --- | --- |
| BMI | 0.85**,+ | <.001 | --- | --- |
| Emphysema (present) | 2.53 | <.001 | 2.20 | <.001 |
excluded variables had p-value>0.05
per increase in one standard deviation
log-transformed before standardization
The cross-validated prognostic score based on age, smoking status, and emphysema showed moderate prognostication for future lung cancer (HR=1.87, 95% CI: 1.69–2.07, per a change of one standard deviation). However, its prognostic ability gradually diminishes over a longer time span, with the cross-validated time-dependent AUC decreasing from 0.74 (95%CI: 0.70–0.77) at 5.5 years to 0.69 (95%CI: 0.66–0.72) at 15 years after the baseline CT scans (Figure 3). Therefore, there is greater potential and the need for improving the long-term prognostic ability.
Figure 3.

Time-dependent AUC curve (left) and the ROC curve (right) at 15 years for age standalone and combined with smoking status and the presence of emphysema (under the five-fold cross-validation adjustment).
C. CT-derived PCS parameters and future lung cancer development
Table 4 presents the HRs and the corresponding p-values for five circulatory parameters considered in our study (significant associations with future lung cancer were determined based on the Bonferroni adjusted significance level, i.e., p<0.01). Among the circulatory parameters, intrapulmonary vein volume was univariately the strongest predictor of future lung cancer (HR=0.63, p<.001, per one standard deviation change of a log-transformed volume). This parameter maintained a consistently strong effect in a joint model including intra- and extra-pulmonary artery volumes. The latter parameters appeared to play largely supportive roles, warranting the further exploration of the joint effect.
Table 4.
CT-computed PCS parameters and their association with future lung cancer
| Parameter | Univariate/standalone | Multivariable/ joint | ||
|---|---|---|---|---|
| Hazard Ratio** | p-value | Hazard Ratio** | p-value | |
| Intrapulmonary artery volume*,+ | 0.89 | 0.023 | 1.59 | <.001 |
| Extrapulmonary artery volume * | 1.06 | 0.32 | 1.21 | 0.006 |
| Intrapulmonary vein volume* | 0.63 | <.001 | 0.41 | <.001 |
| Extrapulmonary vein volume *,+ | 0.84 | 0.001 | --- | --- |
| Heart volume* | 0.88 | 0.014 | --- | --- |
Continuous variables were log-transformed for the statistical analysis
per increase in one standard deviation (after the transformation)
The joint-model coefficients for log-transformed intrapulmonary artery and vein volumes were 0.46 and −0.90, respectively (as logs of hazard ratios, Table 4), suggesting the relevance of the ratio of the intrapulmonary artery volume to the square of the intrapulmonary vein volume as a predictor of future lung cancer. This intrapulmonary vessel ratio provides greater interpretability of circulatory structures and shows a strong standalone association with future lung cancer (HR=1.78, 95% CI: 1.62–1.94, per one-standard-deviation change), resulting in a 15-year AUC of 0.69 (95% CI: 0.66–0.72). Among other PCS parameters, only the addition of extrapulmonary artery volume significantly improves the joint model but does not meaningfully improve the long-term prognostication of lung cancer. In contrast to the demographic characteristics, the prognostic ability of the PCS parameters is more relevant for prognostication at 10–15 year span rather than near-term prediction (Figure 4).
Figure 4.

Time-dependent AUC curves (left) and the 15 year-ROC curve (right) of PCS (represented by the intrapulmonary vessel ratio) (AUC=0.69, 95% CI:0.66–0.72 at 15 years)
D. Composite model for predicting future lung cancer
The intrapulmonary vessel ratio remains strongly prognostic after the adjustment for non-circulatory parameters, including age, smoking status, and emphysema, with an HR=1.67 (95% CI: 1.51–1.84). The cross-validated composite-model score showed a meaningful improvement over the circulatory or demographic models with an HR=2.20 (95% CI:2.00–2.43) and a 15-year AUC of 0.74 (95% CI: 0.71–0.77).
The composite model of intrapulmonary vessel ratio with demographic and other baseline characteristics of participants can be further improved by incorporating extrapulmonary characteristics (measured by correlated vessel or heart volume, which are correlated with at least 0.6 level) as well as BMI (correlated at approximately 0.3 level with extrapulmonary characteristics), which gain importance in the multivariate model. These adjustments, however, do not lead to meaningful changes in the overall prognostic ability and, hence, are not considered in this study (where we focus on verifying prognostic potential of the PCS parameters standalone in addition to demographic and other participants’ characteristics).
The cross-validated prognostic score of the composite model illustrates the distinct improvement that PCS parameters offer over prognostication based solely on demographic and other baseline characteristics (Figure 5). At 15 years, the cross-validated composite prognostic score shows a uniformly higher ROC curve with an AUC of 0.74 (95%CI: 0.71–0.77) and regular shape, indicating a similar ability to identify high and low-risk participants in the long term.
Figure 5.

Time-dependent AUC curves (left) and the 15-year ROC curves (right) for the cross-validated prognostic scores of several models (at 15 years AUC=0.69, 95% CI:0.66–0.72 for non-circulatory, and 0.69, 95%CI: 0.66–0.72 for circulatory, and 0.74, 95%CI:0.71–0.77 for the composite model)
E. Risk stratification based on the composite model
To further illustrate the prognostic ability of the composite model, we stratified participants into three risk strata based on the top 10% (approximately the cancer incidence level in our cohort) of the cross-validated overall prognostic score (“high risk”), the bottom 50% of the prognostic score (low risk), and the remaining participants (“intermediate risk”). Table 5 summarizes the strata and their corresponding 15-year estimates of cumulative incidence function (CIF), while Figure 6 shows the CIF curves. Compared to the low-risk stratum, the intermediate-risk stratum has an HR=3.2 (95% CI: 2.46–4.12), and the high-risk stratum has an HR=8.0 (95% CI: 6.02–10.69).
Table 5.
Risk strata based on the predictions by the composite model
| Model’s risk strata | Lung Cancers | Deaths | Total patients | 15-year risk estimate | 95% CI |
|---|---|---|---|---|---|
| Low risk | 81 | 332 | 1,818 | 3.7% | (0.029, 0.047) |
| Intermediate | 194 | 467 | 1,452 | 12.2% | (0.106, 0.140) |
| High Risk | 110 | 137 | 365 | 28.5% | (0.239, 0.332) |
| Total | 385 | 936 | 3,635 |
Figure 6.

Cumulative incidence of lung cancer (from the first CT) for the risk strata based on the composite model combining PCS features (represented by the intrapulmonary vessel ratio) with demographics and other participants’ characteristics.
IV. DISCUSSION
We conducted a study using a large lung cancer screening cohort (n=3635) to investigate the relationship between PCS characteristics and future lung cancer risk, while also taking into account non-circulatory parameters such as age, smoking status, emphysema, heart volume, and BMI. Our findings suggest that the intrapulmonary vessel ratio, defined as the ratio of intrapulmonary artery volume to the square of intrapulmonary vein volume, is a strong predictor of future lung cancer risk, providing a more interpretable measure of circulatory structures. Incorporating non-circulatory parameters improves the accuracy of lung cancer prediction models and outperforms models based solely on circulatory or demographic parameters. The composite model can identify patients with negligibly low risk of lung cancer as well as approximately 10% of the population with a risk several times greater than average. To our knowledge, our study is the first to demonstrate the prognostic ability of PCS in predicting lung cancer development. Furthermore, the computer algorithms used in this study to quantify relevant PCS features are fully automated for LDCT scans, making it relatively easy to implement this tool in a screening setting. Our study employs cross-validation to evaluate the accuracy and generalizability of the models, providing a robust assessment of their prognostic ability.
We note that this study does not attempt to develop an optimal prognostic tool. Instead, our focus is on verifying the standalone prognostic potential of the PCS parameters and their potential contribution alongside demographic and patient characteristics like age, smoking status, and the presence of emphysema. The development and assessment of an optimal prognostic tool will necessitate more flexible methods and rigorous validations, including external validation. In this study, we used a straightforward rule to define risk strata based on the cumulative incidence of lung cancer in our cohort (approximately 10%) and a lower risk stratum encompassing 50% of the population. The risk strata for the clinically relevant tools should be established based on the externally validated performance of the prognostic tool, characteristics of the target population, and possible clinical actions. The development of such stratification would follow the development and external validation of the prognostic tool in later studies.
One of the unique aspects of this study is the exploration of PCS characteristics as predictors of lung cancer risk. Awareness of these factors will help identify those who are at risk of developing lung cancer, refine the eligibility for LDCT lung cancer screening, and develop novel ways (e.g., breathing exercises14) to change the PCS morphology, or potential chemoprevention strategies, and thus reduce the chance of developing lung cancer. As far as we are aware, no prior study has explored the underlying relationship between PCS characteristics, particularly the differentiation of lung arteries and veins, and the risk of developing lung cancer in the future. This is likely due to the difficulty in automatically identifying intra- and extrapulmonary arteries and veins on non-contrast CT scans. Given the prevalence of lung cancer and the wide adoption of LDCT lung cancer screening in the U.S. and worldwide, there could be significant potential clinical and translational implications. Our study also leverages one of the unique features of LDCT lung cancer screening, in that the LDCT provides detailed information about all anatomic structures in the thorax, beyond the presence or absence of suspicious findings for lung cancer. This is why LDCT, in contrast to all other cancer screening modalities, uniquely reduces all-cause mortality, as well as lung cancer mortality3. Our results are one of the first studies to use data from the LDCT, present in all subjects screened (not just those with lung nodules) to predict lung cancer development.
Currently, the exact mechanism linking PCS characteristics and future lung cancer risk is not fully understood. One possible explanation for the association between intrapulmonary vein volume and lung cancer risk is that alterations in the pulmonary vasculature may affect the oxygenation and nutrient supply to lung tissue, leading to cellular stress and potential tumor development 15–17. Intrapulmonary veins are responsible for draining deoxygenated blood from the lung tissue and returning it to the heart, and their volume may reflect the efficiency of this process. Alterations in intrapulmonary vein volume, such as dilation or constriction, could potentially affect blood flow and nutrient delivery to lung tissue, leading to cellular stress and creating an environment conducive to the development of cancerous cells. Moreover, changes in intrapulmonary vein volume may reflect alterations in the microenvironment of lung tissue, such as inflammation or fibrosis, which could also contribute to cancer development.
Interestingly, even after adjusting for non-circulatory parameters such as age, smoking status, and emphysema, the intrapulmonary vessel ratio remains a strong prognostic factor for future lung cancer risk. This suggests that the intrapulmonary vessel ratio captures a unique aspect of lung physiology that is distinct from these other risk factors. It is likely influenced by a variety of factors, such as smoking history, inflammation, and underlying lung diseases, which can affect the structure and function of blood vessels in the lung. Changes in the intrapulmonary vessel ratio may indicate alterations in the lung tissue’s microenvironment, such as increased angiogenesis or vascular remodeling, known to be involved in the development and progression of lung cancer. Therefore, a higher intrapulmonary vessel ratio may indicate an increased risk of future lung cancer, while a lower ratio may suggest a healthier lung microenvironment and a lower risk of lung cancer.
Our study found that incorporating heart volume and BMI into the composite model improved the prediction of future lung cancer risk. To our knowledge, no study reported the underlying association between heart volume and lung cancer risk, while there are studies about the association between BMI and lung cancer risk 18–25. The inverse association between BMI and lung cancer risk (Table 3) as we found is consistent with many available studies 18–23. However, it is unclear about the inverse association between heart volume and lung cancer risk.
Despite the promising findings, this study has some limitations. First, the study cohort was generated from a single medical institution. The enrolled patients were primarily distributed geographically across Western Pennsylvania, and the majority of them were white. Second, although our algorithms for segmenting various structures and tissues on LDCT scans are not perfect, our promising results on thousands of LDCT scans demonstrated their unique potential as novel biomarkers for predicting the risk of lung cancer. Also, we only measured the volume of the PCS and did not analyze other parameters such as the diameters of the PCS, which may provide additional insights into their clinical potential for predicting lung cancer development. Finally, our analysis did not take into account the presence of suspicious nodules in this study, because a large portion of the enrolled subjects do not have suspicious lung nodule findings. Actually, we think this could also be considered a strength of this study in that it demonstrates the potential of these biomarkers in predicting lung cancer risk in patients without suspicious nodules.
V. CONCLUSION
Our study provided evidence that PCS characteristics, especially the intrapulmonary vessel ratio, could serve as important predictors of future lung cancer risk. Their combination with subject demographics can allow outlining a sizable stratum of patients with negligibly low risk of lung cancer as well as identifying approximately a large portion of the population with risk several times greater than average, thereby improving the eligibility and enabling personalized LDCT lung screening. Nonetheless, further research is needed to better understand the underlying mechanisms and to validate these findings in larger and more diverse populations, as well as determine whether additional imaging analysis of other thoracic structures (e.g., airways features) present on LDCT could be added to the PCS model.
Acknowledgment
This work is supported in part by research grants from the National Institutes of Health (NIH) (R01CA237277, U01CA271888, R61AT012282, and P30CA047904) and UPMC Hillman Developmental Pilot Program.
Footnotes
Conflict of Interest Statement: The authors have no conflicts to disclose.
Data availability statement:
The data that support the findings of this study are available upon request from the corresponding author.
REFERENCES
- 1.Siegel RL, Miller KD, Fuchs HE, Jemal A. Cancer Statistics, 2021 [published online ahead of print 2021/01/13]. CA Cancer J Clin. 2021;71(1):7–33. [DOI] [PubMed] [Google Scholar]
- 2.Bray F, Ferlay J, Soerjomataram I, Siegel RL, Torre LA, Jemal A. Global cancer statistics 2018: GLOBOCAN estimates of incidence and mortality worldwide for 36 cancers in 185 countries [published online ahead of print 2018/09/13]. CA Cancer J Clin. 2018;68(6):394–424. [DOI] [PubMed] [Google Scholar]
- 3.Aberle DR, DeMello S, Berg CD, et al. Results of the two incidence screenings in the National Lung Screening Trial [published online ahead of print 2013/09/06]. N Engl J Med. 2013;369(10):920–931. [DOI] [PMC free article] [PubMed] [Google Scholar]
- 4.National Lung Screening Trial Research T, Aberle DR, Adams AM, et al. Reduced lung-cancer mortality with low-dose computed tomographic screening [published online ahead of print 2011/07/01]. N Engl J Med. 2011;365(5):395–409. [DOI] [PMC free article] [PubMed] [Google Scholar]
- 5.Jin J Screening for Lung Cancer [published online ahead of print 2021/03/10]. JAMA. 2021;325(10):1016.33687464 [Google Scholar]
- 6.Meza R, Jeon J, Toumazis I, et al. Evaluation of the Benefits and Harms of Lung Cancer Screening With Low-Dose Computed Tomography: Modeling Study for the US Preventive Services Task Force [published online ahead of print 2021/03/10]. Jama. 2021;325(10):988–997. [DOI] [PMC free article] [PubMed] [Google Scholar]
- 7.Siegel DA, Fedewa SA, Henley SJ, Pollack LA, Jemal A. Proportion of Never Smokers Among Men and Women With Lung Cancer in 7 US States [published online ahead of print 2020/12/04]. JAMA Oncol. 2021;7(2):302–304. [DOI] [PMC free article] [PubMed] [Google Scholar]
- 8.Subramanian J, Govindan R. Lung cancer in never smokers: a review [published online ahead of print 2007/02/10]. J Clin Oncol. 2007;25(5):561–570. [DOI] [PubMed] [Google Scholar]
- 9.Wilson DO, Weissfeld JL, Fuhrman CR, et al. The Pittsburgh Lung Screening Study (PLuSS): outcomes within 3 years of a first computed tomography scan [published online ahead of print 2008/07/19]. Am J Respir Crit Care Med. 2008;178(9):956–961. [DOI] [PMC free article] [PubMed] [Google Scholar]
- 10.Pu J, Leader JK, Sechrist J, et al. Automated identification of pulmonary arteries and veins depicted in non-contrast chest CT scans [published online ahead of print 2022/01/24]. Med Image Anal. 2022;77:102367. [DOI] [PMC free article] [PubMed] [Google Scholar]
- 11.Pu L, Leader JK, Ali A, Gent Z, Wilson D. Predicting left/right lung volumes, thoracic cavity volume, and heart volume from subject demographics to improve lung transplant. Paper presented at: SPIE Medical Imaging; 19 – 23 February 2023, 2023; San Diego, California, United States. [DOI] [PMC free article] [PubMed] [Google Scholar]
- 12.Pu J, Roos J, Yi CA, Napel S, Rubin GD, Paik DS. Adaptive border marching algorithm: automatic lung segmentation on chest CT images [published online ahead of print 2008/06/03]. Comput Med Imaging Graph. 2008;32(6):452–462. [DOI] [PMC free article] [PubMed] [Google Scholar]
- 13.Gooley TA, Leisenring W, Crowley J, Storer BE. Estimation of failure probabilities in the presence of competing risks: new representations of old estimators [published online ahead of print 1999/04/16]. Stat Med. 1999;18(6):695–706. [DOI] [PubMed] [Google Scholar]
- 14.Tavoian D, Craighead DH. Deep breathing exercise at work: Potential applications and impact [published online ahead of print 2023/01/31]. Front Physiol. 2023;14:1040091. [DOI] [PMC free article] [PubMed] [Google Scholar]
- 15.Hompland T, Fjeldbo CS, Lyng H. Tumor Hypoxia as a Barrier in Cancer Therapy: Why Levels Matter [published online ahead of print 2021/02/03]. Cancers (Basel). 2021;13(3). [DOI] [PMC free article] [PubMed] [Google Scholar]
- 16.Emami Nejad A, Najafgholian S, Rostami A, et al. The role of hypoxia in the tumor microenvironment and development of cancer stem cell: a novel approach to developing treatment [published online ahead of print 2021/01/22]. Cancer Cell Int. 2021;21(1):62. [DOI] [PMC free article] [PubMed] [Google Scholar]
- 17.Muz B, de la Puente P, Azab F, Azab AK. The role of hypoxia in cancer progression, angiogenesis, metastasis, and resistance to therapy [published online ahead of print 2016/10/25]. Hypoxia (Auckl). 2015;3:83–92. [DOI] [PMC free article] [PubMed] [Google Scholar]
- 18.Dewi NU, Boshuizen HC, Johansson M, et al. Anthropometry and the Risk of Lung Cancer in EPIC [published online ahead of print 2016/07/03]. Am J Epidemiol. 2016;184(2):129–139. [DOI] [PMC free article] [PubMed] [Google Scholar]
- 19.Yu D, Zheng W, Johansson M, et al. Overall and Central Obesity and Risk of Lung Cancer: A Pooled Analysis [published online ahead of print 2018/03/09]. J Natl Cancer Inst. 2018;110(8):831–842. [DOI] [PMC free article] [PubMed] [Google Scholar]
- 20.Ardesch FH, Ruiter R, Mulder M, Lahousse L, Stricker BHC, Kiefte-de Jong JC. The Obesity Paradox in Lung Cancer: Associations With Body Size Versus Body Shape [published online ahead of print 2020/11/28]. Front Oncol. 2020;10:591110. [DOI] [PMC free article] [PubMed] [Google Scholar]
- 21.Kabat GC, Kim M, Hunt JR, Chlebowski RT, Rohan TE. Body mass index and waist circumference in relation to lung cancer risk in the Women’s Health Initiative [published online ahead of print 2008/05/17]. Am J Epidemiol. 2008;168(2):158–169. [DOI] [PMC free article] [PubMed] [Google Scholar]
- 22.Smith L, Brinton LA, Spitz MR, et al. Body mass index and risk of lung cancer among never, former, and current smokers [published online ahead of print 2012/03/30]. J Natl Cancer Inst. 2012;104(10):778–789. [DOI] [PMC free article] [PubMed] [Google Scholar]
- 23.Tarnaud C, Guida F, Papadopoulos A, et al. Body mass index and lung cancer risk: results from the ICARE study, a large, population-based case-control study [published online ahead of print 2012/05/23]. Cancer Causes Control. 2012;23(7):1113–1126. [DOI] [PubMed] [Google Scholar]
- 24.Jee SH, Yun JE, Park EJ, et al. Body mass index and cancer risk in Korean men and women [published online ahead of print 2008/07/25]. Int J Cancer. 2008;123(8):1892–1896. [DOI] [PubMed] [Google Scholar]
- 25.Parr CL, Batty GD, Lam TH, et al. Body-mass index and cancer mortality in the Asia-Pacific Cohort Studies Collaboration: pooled analyses of 424,519 participants [published online ahead of print 2010/07/03]. Lancet Oncol. 2010;11(8):741–752. [DOI] [PMC free article] [PubMed] [Google Scholar]
Associated Data
This section collects any data citations, data availability statements, or supplementary materials included in this article.
Data Availability Statement
The data that support the findings of this study are available upon request from the corresponding author.