Abstract
Semiconductor films are crucial in photocatalysis applications, yet their controlled production remains challenging. Previous studies have mainly focused on deposition processes, heating rates, and doping of semiconductor oxides. In this paper, we introduce a novel method for fabricating tenorite (CuO) semiconductor films with varying precursor concentrations (0.01, 0.02, 0.04, 0.06, and 0.1 g/ml) using a dip-coating technique. We explore the impact of contact angles, 3D surface topography, and film thickness on photoactivation properties, areas with limited previous research focus. The results demonstrate that higher-concentration tenorite films (0.1 g/ml) exhibit rougher surfaces (77.3 nm), increased hydrophobicity (65.61°), improved light-harvesting ability, enhanced charge separation, and higher active oxygen output. The crystal sizes were within the range of 7.3–44.1 nm. Wettability tests show a 21.47% improvement in the 0.1 g/ml film surface under indirect sunlight compared to darkness. Transmittance rates in the 600 nm range were from 0.02 to 90.94%. The direct optical band gaps were 1.21–2.74 eV, while the indirect band gaps remained unaffected (0.9–1.11 eV). Surface morphology analysis reveals an increased presence of grains with higher concentrations. Regarding photocatalysis's impact on film morphology and copper content, SEM images reveal minimal changes in film structure, while copper content remains stable with slight variations. This suggests strong adhesion of tenorite to the film after photocatalysis. Tenorite thin films display exceptional photocatalytic efficiency, making them suitable for practical applications.
Keywords: Surface roughness, Wettability, Tenorite, Photocatalysis, Dip-coating
Subject terms: Pollution remediation, Chemical engineering
Introduction
Freshwater is among the most fundamental needs of humanity on planet1, and it has become a big issue in the twenty-first decade2–4. Over 80% of the total ground and surface waters are contaminated5, Every day, 7.5 billion people need clean water for a variety of functions1, and according to the UNWWD (United Nations World Water Development) report, throughout the world, nearly 750 million individuals lack access to a reliable source of drinking water, and the need for water in the manufacturing sector is expected to increase 400% by 20506. The problem of water contamination has been increasingly significant7,8, since the late twentieth century because of fast economic growth9. Several research organizations have focused heavily on pollution-related issues10–12. These include pollution from organic and inorganic pollutants6, which are generally challenging to decompose by nature itself13 and have been widely investigated due to their negative impact on human life and health14.
In light of this, photocatalysis utilizing semiconductor photocatalysts emerges as the most cost-effective and promising approach for efficiently harnessing recoverable solar energy3,15,16 and it has been widely developed in response to the rising weight of the global energy problem and pollution17,18. As a result, one of the world’s biggest concerns is the efficient treatment of dirty water using photocatalytic processes5, which are regarded as among the most successful methods of resolving environmental issues. On the other hand, photocatalysis represents one of the most sophisticated water treatment techniques available today6, due to its ease of use, low cost, lack of pollution, repeatability, renewable technology, reliance on just oxygen in the atmosphere13,19, and the potential to turn solar energy into clean H2 fuel20. As a function, it is used in a variety of industries, including CO2 reduction and N2 fixation21, and the decomposition of organic molecules in wastewater, disinfecting, H2 purification, etc.22,23; that can produce electron–hole pairs effectively by absorbing incoming light and subsequently initiating surface redox reactions20,24. As well acknowledged, advanced oxidative processes (AOPs) are regarded as an excellent choice for degrading organic contaminants from water, owing to the production of extremely reactive oxygen species (ROS) such as hydroxyl radicals (•OH) and superoxide radicals (O2−)25.
Some photocatalysts are restricted in their practical applicability due to rapid charge carrier recombination and inadequate absorption of visible light26. Thus, it is crucial to develop the material's band gap to identify the optimal photocatalyst with a suitable band gap27. Consequently, researchers were attracted to fabricating thin films as they effectively control the band gaps of the catalyst materials33. Thin films are sol–gel applications with several functions10 that provide more flexibility in terms of lower sintering temperatures depending on precursors, reduced cost, improved compositional control, increased bioactivity, and improved coating morphological control28,29. It may also be readily synthesized utilizing sol–gel spin-coating or dip-coating procedures, which are complex or impossible to do using conventional synthetic methods30,31.
The dip-coating method is a technique for depositing thin layers onto a substrate surface32. It is the preferred technology due to its high deposition, chemical composition controllability, production capability, and excellent homogeneity over large areas of deposition. Furthermore, controlling the band gap in transition metal oxides is important33 and provides advantages in terms of cost34. In addition, it is easily applied to diverse geometric forms of substrates and has a high potential for usage in large-scale commercial manufacturing35. The thickness of the coating layer is determined by the coating slurry viscosity, as well as the withdrawn speed and dwell duration36.
Cupric oxide exists in two stable compounds: Tenorite (CuO), which has band gap values ranging from 1.2 to 1.9 eV as well as being capable of considerable light absorption despite its low photocatalytic efficacy37, and cuprite (Cu2O), which has band gap values ranging from 2.0 to 2.2 eV38. Because of the monoclinic phase of CuO, it is more thermostable than Cu2O, which has a cubic phase39. On the other hand, CuO is a prevalent semiconducting metal oxide based on its conductivity and the presence of p-type semiconductors owing to copper gaps in the crystalline lattice40, which is sensitive to visible light and has strong photocatalytic oxidation activity in eliminating organic contaminants under both artificial and solar light41. Tenorite has appealing properties, including strong electrical conductivity, excellent stability, and high catalytic activity. Furthermore, tenorite is a low-cost, plentiful, and non-toxic semiconductor42.
Babu et al.43 described the function of Co-doped CuO (CCO) thin films with p-to n-type properties as a nonmagnetic semiconductor through a half-metal transition. Using the Hall Effect to calculate p- to n-type conductivity. The lower resistivity and mobility at 8 at.% of CCO thin film were found to be 07.83 × 10³ Ω cm and 0.003 cm2 V−1 s−1, respectively. The findings above show that 8 at.% of CCO thin films have the potential for use in spintronic and optoelectronic devices. Y. Chen et al.44 used reactive magnetron sputtering to create CuO (1 1 1) preferred-oriented thin films with a nanoscale wheatear array. It has been discovered that altering the length of the nano wheatear may control the band gaps of CuO films from 1.54 to 1.25 eV. The measurements made by C-AFM for a work function, as well as the band gap, match those made by KPFM. Finally, it is proposed that KPFM, as well as C-AFM, can both offer practical approaches for determining the semiconductor's band gap.
Methylene blue is extensively used in chemical indicators, pigments, biological staining, and other applications due to its inexpensive cost, water solubility, and high colorability45. MB has an aromatic ring structure that is difficult to decompose in a water sample under natural circumstances46. Importantly, the nervous system will be damaged when MB enters the human body47. MB in water produces a variety of health concerns, including eye irritation, breathing difficulties, mental disorientation, vomiting, and excessive perspiration48. Adsorption49, electrochemical oxidation50, and photocatalytic51 are now the most extensively utilized techniques for removing MB from water. Among them, photocatalytic technology was adopted due to its advantages in photocatalyst recoverability52.
The majority of studies published in the literature, including these previous studies, have focused on semiconductor oxides, the deposition process, doping, heating rate, or co-doping with other materials53. The effects of contact angles, 3D surface topography, and film thickness on the photoactivation properties of semiconductor oxide films are relatively unknown. The effects of contact angles and 3D surface topography on the photocatalysis of pure tenorite films under sunlight have been thoroughly investigated for the first time in this study. This approach seeks to generate new concepts for future study and implement tenorite photocatalytic films by investigating the mechanism of tenorite photocatalysis, associated production methodologies (sol–gel by dip-coating method), and varying the manufacturing precursor concentrations (0.01, 0.02, 0.04, 0.06, and 0.1 g/ml) to improve its photocatalytic performance. The following tests were utilized in this paper: UV–visible was applied to analyze the optical properties. The structural properties were studied using XRD. For morphological features, 3D surface topography, water droplet contact angles, SEM, and EDX were utilized. As a dye, MB was utilized.
Results and discussion
X-ray diffraction (XRD)
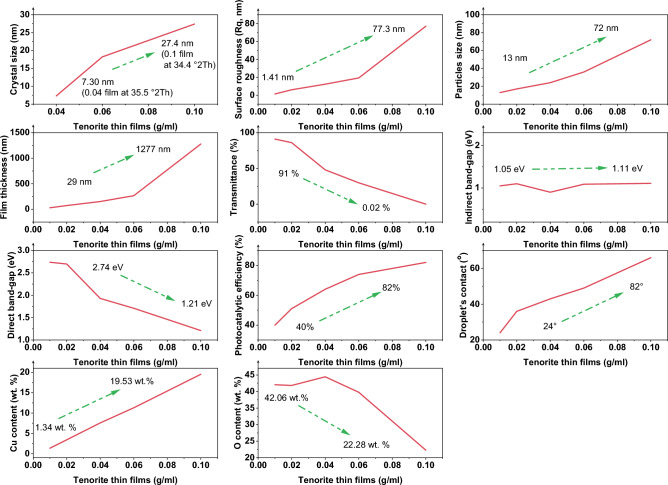
The findings indicated that films containing precursor concentrations of 0.04, 0.06, and 0.1 g/ml displayed a crystal structure that aligned with the CuO monoclinic crystal system, precisely corresponding to (JCPDS no. 01-074-1021, 080-1917, and 045-0937), while the 0.01 and 0.02 g/ml films exhibited a lower crystallite, as shown in Fig. 1 and Table 1. The size of the crystallites exhibited an upward trend with increasing tenorite precursor concentrations within the films. This is evident from the larger crystallite sizes observed in the 0.1 g/ml film (44.1 nm) compared to the 0.06 g/ml (18 nm) and 0.04 g/ml (7.3 nm) films, as outlined in Table 1. Furthermore, it was observed that augmenting the thickness of the films exerted a discernible impact on crystal growth. This is substantiated by the presence of larger crystal sizes within the 0.1 g/ml film, which also possessed the greatest thickness, measuring at 1276 nm. Overall, these results suggest that controlling the precursor concentrations and thickness of tenorite thin films can be an effective way to control their crystal structure and size, as shown in Table 1.
Figure 1.
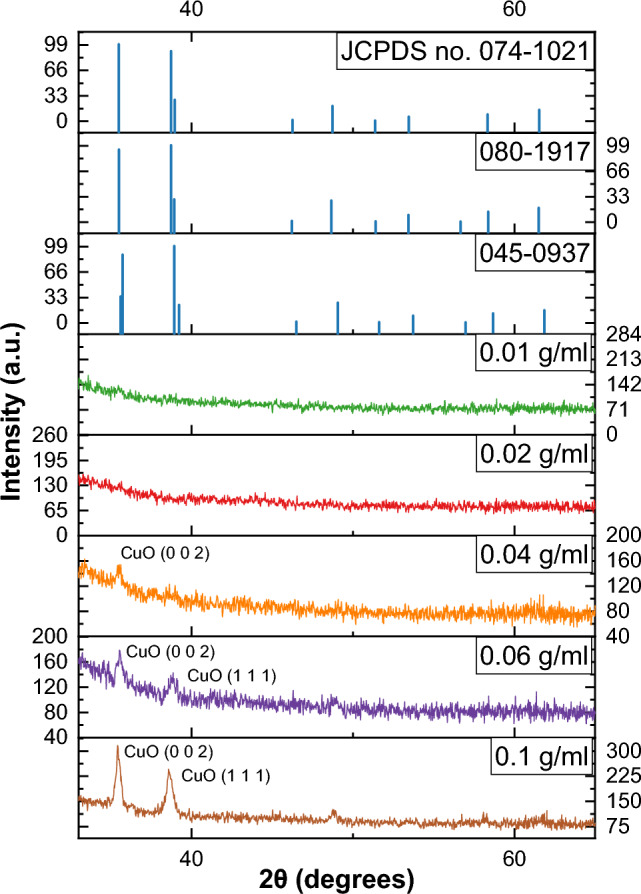
Displays the tenorite thin films XRD patterns for precursor concentrations of 0.01, 0.02, 0.04, 0.06, and 0.1 g/ml.
Table 1.
Results report.
| Parameters | Units | Concentration (g/ml) | ||||||
|---|---|---|---|---|---|---|---|---|
| 0.01 | 0.02 | 0.04 | 0.06 | 0.1 | ||||
| Crystallographic phase | – | – | – | CuO | CuO | CuO | ||
| Positions | °2Th | – | – | 35.501 | 35.585 | 38.807 | 34.45 | 38.61 |
| Crystal size | nm | – | – | 7.3 ± 0.004 | 18.2 ± 0.071 | 18 ± 0.08 | 27.4 ± 0.096 | 44.1 ± 0.067 |
| Surface roughness (Rq) | nm | 1.41 | 6.07 | 12.3 | 19.4 | 77.3 | ||
| Particles size | nm | 13 ± 4 | 17 ± 6 | 24 ± 7 | 36 ± 5 | 72 ± 8 | ||
| Film thickness | nm | 28.63 ± 7 | 73.23 ± 33 | 152.66 ± 13 | 266.92 ± 42 | 1276.85 ± 53.6 | ||
| Transmittance | % | ~ 90.94 | ~ 86.38 | ~ 48.16 | ~ 30.07 | ~ 0.02 | ||
| Optical band gap (Indirect) | eV | 1.05 | 1.10 | 0.90 | 1.09 | 1.11 | ||
| Optical band gap (Direct) | eV | 2.74 | 2.70 | 1.93 | 1.71 | 1.21 | ||
| Photocatalytic Efficiency | % | ~ 40.08 | ~ 51.48 | ~ 63.90 | ~ 74.42 | ~ 82.24 | ||
| Average of water droplet’s contact | ° | 23.79 ± 3 | 36.16 ± 4 | 43.5 ± 4.5 | 49.38 ± 7 | 65.61 ± 6 | ||
| Regression coefficient (R2) | – | 0.96648 | 0.99401 | 0.99664 | 0.9853 | 0.993 | ||
| Rate constant photocatalytic (Kapp) | min-1 | 0,002,704 | 0,004,028 | 0,005,742 | 0,007,320 | 0,009,365 | ||
| Half-time photocatalytic (t1/2) | min | 256.34 | 172.08 | 120.71 | 94.69 | 74.01 | ||
Analysis of contact angles and film thickness
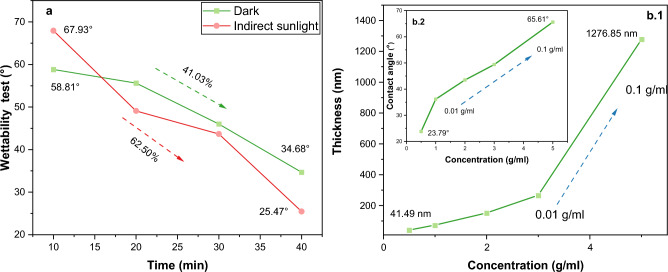
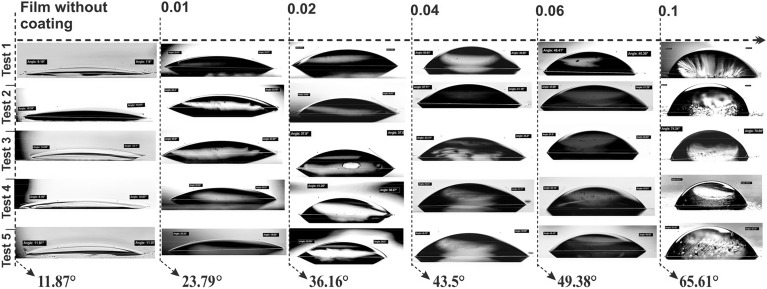
The contact angle measurements showed that the surface area of the tenorite films (at 0.01, 0.02, 0.04, 0.06, and 0.1 g/ml) had a significant effect on the wettability (hydrophilic), with a maximum value of 65.61° at 0.1 g/ml. The surface energies (γ) of all the film areas were quite high, as all films were less than 90°54. Figure 2b.2 shows the average contact angle (water droplet) on the film surface, where the tenorite films were found to be hydrophobic with increasing concentration increased (from 23.79 to 65.61° at 0.01 to 0.1 g/ml). Consequently, this phenomenon results in an augmented self-cleaning effect with the increased precursor concentrations. The higher contact angle value (65.61°) on the tenorite film (0.1 g/ml) surface may be explained by the fact that the nanostructure applied to the surfaces used in this investigation may have improved surface wettability (hydrophilicity) because of the rougher surface (77.3 nm)55.
Figure 2.
(a) Wettability rate of tenorite film surface (0.1 g/ml) over 40 min; (b.1) the effect of increasing the precursor concentrations on the thickness of the tenorite films; and (b.2) the contact angles.
When the tenorite film (0.1 g/ml) was exposed to indirect sunlight for 40 min, the angle of water contact gradually decreased from 69.93° to 25.47°, indicating a hydrophilicity rate of 62.5%, as shown in Fig. 2a. In contrast, in the dark, the contact angle decreased from 58.81° to 34.68° at a rate of 41.03%; this proves that the wettability on the surface of the 0.1 g/ml film increased by 21.47% under indirect sunlight. It was observed that by increasing the illumination period from 20 to 30 min under indirect sunlight, the contact angle remained stable in the 40–50° range. Similarly, after 10–20 min in the dark, the contact angle remained steady in the 55–60° range (Fig. 3); this explains that the wettability is minimal at the beginning of time and increases dramatically after some time (for tenorite films). The contact angle of water on tenorite film (0.1 g/ml) that was maintained in the dark did not shift significantly (with a rate of 41.03%) over the period of 40 min. This results in tenorite films exhibiting hydrophilic behavior when exposed to sunlight. With increasing precursor concentrations, the thickness of the tenorite film significantly increased from 28.63 to 1276.85 nm, as depicted in Fig. 2b.1. This change can be attributed to alterations in the physical and chemical properties of the solution, including viscosity (with increasing precursor concentrations).
Figure 3.
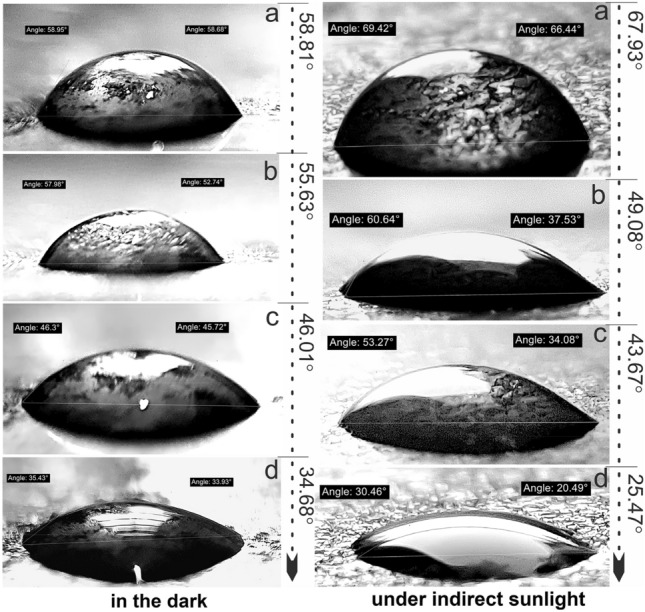
Hydrophilic effect on tenorite film (0.1 g/ml) surface under indirect sunlight and in the dark.
Study of 3D surface topography
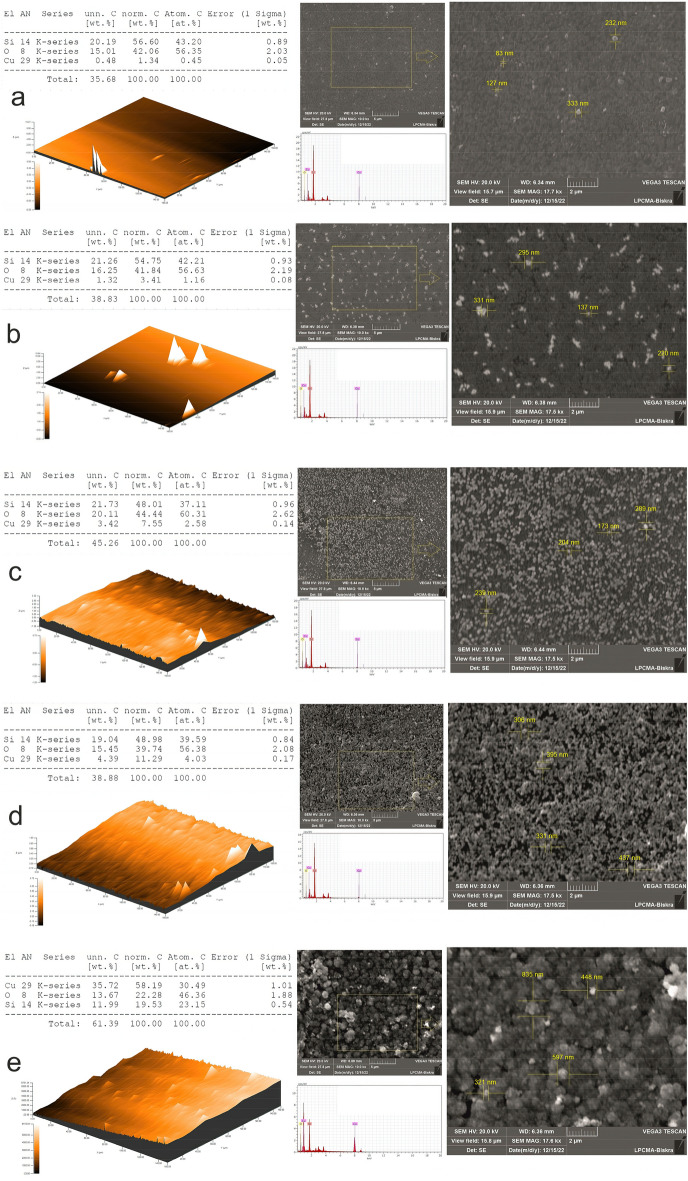
The 3D surface topography depicts the surface roughness gradients for the tenorite thin films shown in Fig. 4, which concludes in the results that the surface becomes rougher and more heterogeneous as the precursor concentrations of tenorite increase (from 0.01 to 0.1 g/ml). Root-mean-square roughness (Rq) values for all films were in the 1.41–77.3 nm range, as indicated in Table 1. A surface roughness value of 77.3 nm was found in tenorite thin film at 0.1 g/ml, increasing the specific surface area of the film (the film is not continuous and has a high level of surface roughness), which makes the photocatalytic activity substantial10. The maximum peak heights (Rp) of the tenorite thin film surfaces were 2.79, 64.3, 60.4, 144, and 299 nm at 0.01, 0.02, 0.04, 0.06, and 0.1 g/ml, respectively. The study encompassed the determination and calculation of various parameters of surface roughness. These parameters, comprising the arithmetic mean roughness (Ra), quantifying the average deviation of surface height from the mean; skewness (Rsk), measuring the asymmetry of the surface profile; kurtosis (Rku), characterizing the sharpness or flatness of the surface peaks and valleys; total height of the profile (Rt), representing the overall height variation of the surface; mean height of the profile elements (Rc), providing the average height of individual surface features; and maximum profile valley depth (Rv), indicating the deepest valley present on the surface, were determined and are showcased in Table 2.
Figure 4.
Tenorite thin films 3D surface topography (measurement area: 150 × 150 um) and SEM images with EDX analysis at precursor concentrations of (a) 0.01 g/ml; (b) 0.02 g/ml; (c) 0.04 g/ml; (d) 0.06 g/ml; and (e) 0.1 g/ml.
Table 2.
Roughness variables' impact on raising precursor concentrations.
| Roughness profile parameters | Concentration | Unit | ||||
|---|---|---|---|---|---|---|
| 0.01 | 0.02 | 0.04 | 0.06 | 0.1 | g/ml | |
| Ra | 1.11 | 3.13 | 9.26 | 13.6 | 58.9 | nm |
| Rsk | - 0.617 | 5.49 | 1.08 | 2.09 | 0.387 | nm |
| Rku | 3.40 | 49.8 | 5.56 | 15.7 | 3.74 | nm |
| Rt | 7.40 | 376.6 | 91.1 | 198 | 523 | nm |
| Rc | 3.48 | 10.6 | 30.5 | 44.1 | 170 | nm |
| Rv | 4.61 | 12.3 | 30.7 | 54.1 | 223 | nm |
The roughness parameters (Ra, Rc, Rt, and Rv) of the 0.1 g/ml film were higher in comparison to the values found in the 0.01, 0.02, 0.04, and 0.06 g/ml films; this explains the dramatic change in the surface (homogeneity and roughness) and morphological structure (Fig. 4) of the films as the precursor concentrations increase. These findings may be described by assuming that increasing the precursor concentrations of the tenorite on the surface of the films causes instability with non-static impacts, resulting in narrower and larger aggregations in the particles of the film’s surface.
Tenorite thin films EDX analysis patterns and morphological
EDX measurement was utilized to look at the tenorite film's chemical components, which showed the peaks connected to the elements Cu, Si, and O (Fig. 4). SEM images of tenorite thin films unveiled bumpy particle accumulation, suggesting a heterogeneous surface, which intensified with increasing tenorite precursor concentrations ranging from 0.01 to 0.1 g/mL, as depicted in Fig. 4a–e. These particles' expansion can be attributed to rapid diffusion and reduced activation energies when the tenorite concentration increases56. Furthermore, the emergence of grains on the films surface increased, with the size of these grains expanding proportionally to the precursor concentrations, resulting in a rougher surface, as corroborated by the roughness results presented in Tables 1 and 2. Moreover, as tenorite precursor concentrations rise (from 0.01 to 0.1 g/ml), average particle size grows from 13 ± 4 to 72 ± 8 nm. The presence of a heterogeneous surface increases the amount of MB adsorbed on these surfaces, enhancing the photocatalytic efficiency of the films10.
UV–visible spectral analysis
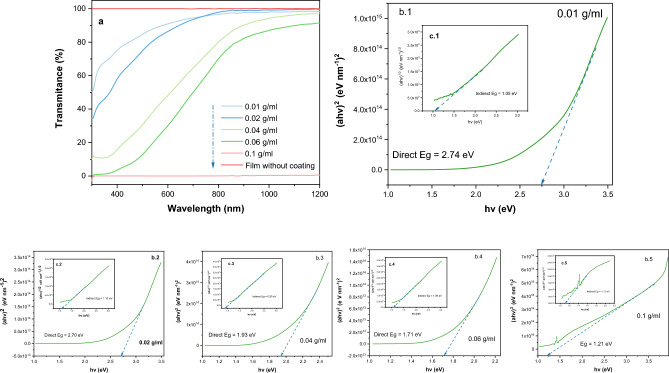
Tenorite thin films transmission spectra show extremely low to high transparency in the visible region. Figure 5a represents a light spectrum with a variety of outcomes from tenorite films, with transmittance rates ranging from 0.02 to 90.94% at the wavelength (600 nm). The results of 0.01, 0.06, and 0.1 g/ml films show the effect of the amount of oxygen (42.06, 39.74, and 22.28 C norm. [wt%]) and film thickness (28.63, 266.92, and 1276.85 nm) on the transmittance (0.02, 30.07, and 90.94%), respectively. The optical transmittance decreases dramatically (to the point of impermeability as 0.1 g/ml film) as the film thickness of the tenorite increases. The variation of the optical band gap for tenorite thin film was shown by the Tauc and Menth plot in Fig. 5b1–b5 for direct and Fig. 5c1–c5 for indirect. The direct and indirect band gap (transitions) were simultaneously observed within the same films, an occurrence attributed to the combined influence of the films' monoclinic crystal structure, variable particle size, and crystallite dimensions. Within this context, the films exhibited a spectrum of crystal size variations, spanning from a lower crystallite structure (0.01 and 0.02 g/ml) to nanometer-scale dimensions (7.3, 18.2, and 27.4 nm) at precursor concentrations of 0.04, 0.06, and 0.1 g/ml, respectively. These distinctions in crystal size intricately corresponded to discernible alterations in the band gap characteristics. In particular, the direct band gap, extending from 1.21 to 2.74 eV, exhibited a clear association with crystal size, revealing a narrower energy band gap as crystal size increased from 7.3 to 27.4 nm. Conversely, crystal size variations did not exert a significant impact on the values of the indirect band gap, which ranged from 0.90 eV to 1.11 eV. The direct band gap values of tenorite films (ranging from 0.01 to 0.1 g/ml) showed a significant decrease from 2.74 to 1.21 eV when the particle size increased from 13 to 72 nm. In contrast, there was no discernible change in the indirect bandgap values in response to changes in particle size (as detailed in Table 1). Tripathi et al. engineered the CuO’s band gap (a p-type semiconductor) from an initial indirect band gap of ∼1 eV to a direct band gap of ∼4 eV, achieved through precise adjustments in nanostructure morphology and mid gap defect states57. As shown in Table 1, the indirect band gap values (1.05–1.11 eV) of tenorite films were not affected by changing the precursor concentrations of Cu(NO3)2· xH2O, the amount of Cu, the crystal size, or the film thickness. Conversely, increasing these factors led to lower direct band gap values (from 2.74 to 1.21 eV) for tenorite thin films. This suggests that the precursor concentrations of CuO in the films can influence their electronic properties. This influence is probably due to changes in film structure, composition58, or reduction in oxygen content, which is a consequence of the increased film density enabled by the increased film thickness.
Figure 5.
(a) visible light spectrum of tenorite thin films after seven dips as a response to the precursor concentrations (0.01, 0.02, 0.04, 0.06, and 0.1 g/ml); (b1–b5)) representation of the Tauc and Menth plot's for the direct optical band gap (Eg); and (c1–c5)) indirect band gap for tenorite films.
Photodegradation of MB dye under sunlight irradiation
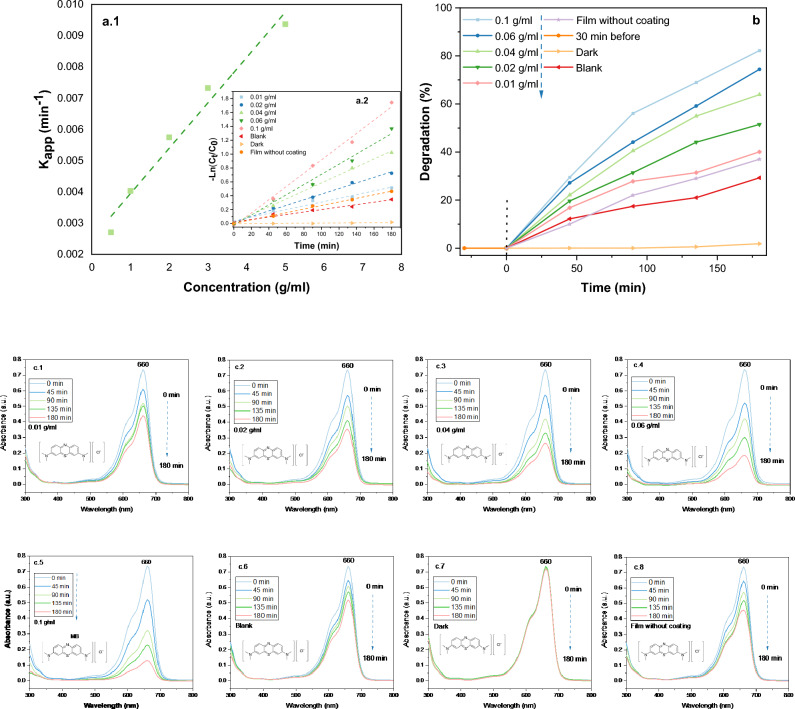
CuO films show a pronounced upward trend in photocatalytic performance when the precursor concentrations of CuO thin films increases from 0.01 to 0.1 g/ml, leading to a significant improvement in photocatalytic efficiency from 40 to 82%. This phenomenon can be attributed to the heightened density of active sites or enhanced light absorption achieved at elevated concentrations59. Figure 6c1–c8 shows graphs depicting the degradation of MB throughout the irradiation period (180 min) of tenorite thin films, as well as graphs depicting the deterioration of MB solution in sunlight without a film and in a darkened room. In consideration of the relationship between hydrophilicity and photocatalysis, it was observed that a higher contact angle of water droplets on the film surface correlates with increased efficiency of photocatalysis (Table 1). However, it is important to note that this does not necessarily imply a direct causation where greater hydrophobicity leads to enhanced photocatalysis. This observation arises from tests conducted by fully immersing the film in the MB solution. Nevertheless, such properties could offer significant benefits for self-cleaning water applications60. Regarding the influence of surface roughness on photocatalyst efficiency, findings indicate that an increase in roughness, ranging from 1.41 to 77 nm, corresponds to an enhancement in photocatalytic efficiency. This enhancement is observed to escalate from 40 to 82% for CuO films with precursor concentrations spanning from 0.01 to 0.1 g/ml, respectively. Figure 6a.2 depicts the progression of the MB ratio oxidation process −Ln(Ct/C0) throughout degradation time. The film with a concentration of 0.1 g/ml exhibited the highest photocatalytic efficiency, as depicted in Fig. 6b. This phenomenon can be attributed to both the rough surface morphology (Fig. 4) and the highly crystalline state of the film (Table 1). Furthermore, EDX analysis indicates that increasing the amount of the Cu component influences photocatalytic efficiency (Table 1).
Figure 6.
(a.1) kapp values (constant rate) per precursor concentrations (0.01, 0.02, 0.04, 0.06, and 0.1 g/ml); (a.2) Final MB concentration concerning first MB concentration (–Ln(Ct/C0)) for 180 min; (b) degradation rate of all tenorite films in relative to 180 min (with tests of dark, blank, and 30 min before); (c1–c8)) The absorption of MB about 180 min for tenorite thin films with dark and blank.
The wind velocity, amount of solar radiation, humidity61, and temperature affect the photocatalytic process. Table 3 demonstrates the difference between these parameters for each 45 min from 10a.m to 1p.m. In Fig. 6b, 0.06 and 0.1 g/ml films with a high thickness at (266–1276 nm) demonstrated a high photocatalysis rate of (74–82%), respectively. This study compares its results with previous research on photocatalysis, focusing on the films produced and the conditions involved, as outlined in Table 4.
Table 3.
Changes in wind, temperature, humidity, and sun radiation every 45 min at the MB breakdown test on October 15, 2022 (Biskra, Algeria).
| Time (min) | 0 | 45 | 90 | 135 | 180 |
| Wind speed (km/h) | 16 | 15 | 15 | 12.5 | 9.2 |
| Day temp (C0) | 28.5 | 29.2 | 29.7 | 30.7 | 31.1 |
| Humidity (%) | 38.6 | 37.4 | 36.7 | 34.3 | 33.2 |
| Radiation amount | Moderate | High | Moderate | ||
Table 4.
Presents a comparative analysis between the findings of this study and those of prior research endeavors pertaining to photocatalysis.
| Film materials | Dye type and concentration | Technique type | Degradation (%) | Time (min) | Irradiation Source | References |
|---|---|---|---|---|---|---|
| CuO (0.1 g/ml) | Methylene blue, 0.0022 g/l | Dip-coating (glass Substrate) | 82 | 180 | Visible light | Current study |
| CuO NWs | Methylene blue, 0.0012 g/l | Porous CuO nanowire (NW) matrix | 34 | 180 | Visible light | 62 |
| CuO@TiO2-300 | Methylene blue, 0.0012 g/l | ALD process was performed on CuO NW | 42 | 180 | Visible light | 62 |
| CuO/ZnO (Simple A) | Methylene blue, 0.005 g/l | Spin-coating with Glass Substrate | 44 | 120 | Xe lamp of 150 W | 63 |
| Cu2O | Methylene blue, 0.005 g/l | Spray pyrolysis growth technique | 60 | 120 | solar simulator (Dayan) 100 mW/cm2 | 64 |
| CuO | Methylene blue, 0.003 g/l | Spraying (glass Substrate) | 74 | 360 | Visible light | 65 |
| CuO-ZnO (1:3) | Methylene blue, 0.003 g/l | Spraying (glass Substrate) | 85 | 360 | Visible light | 65 |
| Cu:Co (70:30) | Methylene blue, 0.003 g/l | Dip-coating (glass Substrate) | 78 | 240 | Visible light | 7 |
| CuO | Rhodamine-b, 0.01 g/l | Sputtering and thermal annealing (glass Substrate) | 56 | 120 | 250W Xenon lamp | 66 |
The impact of direct band gaps on photocatalysis was observed to demonstrate that as the values of direct band gaps decrease (from 2.74 to 1.21 eV), there is a corresponding increase in photocatalytic efficiency (from 40.08 to 82.24%). In contrast, concerning indirect band gaps, no discernible relationship was identified to the enhancement or reduction of photocatalytic efficiency. Regarding the impact of photocatalysis on film morphology and copper content, SEM images in Fig. 7 reveal minimal differences in film morphology. Additionally, copper content remains relatively unchanged, with slight variations observed (Fig. 7). This suggests strong adhesion of tenorite to the film post-photocatalytic.
Figure 7.
Showcases SEM and EDX images following the photodegradation of MB at the various precursor concentrations: (a) 0.01 g/ml, (b) 0.02 g/ml, (c) 0.04 g/ml, (d) 0.06 g/ml, and (e) 0.1 g/ml.
The photocatalytic mechanism is illustrated in Fig. 8, while the ensuing equations succinctly encapsulate the photocatalytic properties exhibited by tenorite films in methylene blue solution37:
| 1 |
Figure 8.
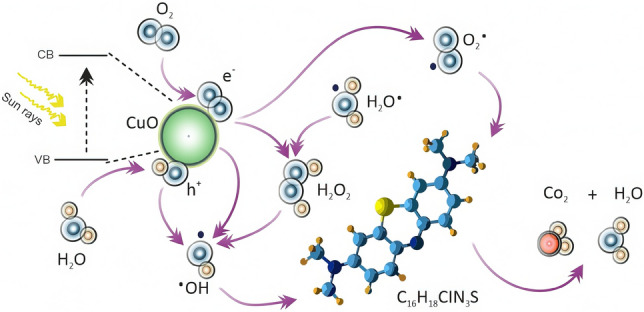
The photocatalytic mechanism of tenorite in MB under sunlight.
Following that, the generation of is stated as follow:
| 2 |
Hydroxyl radicals carry free electrons, while superoxide anion radicals have an extra negative charge. Considering their chemical properties, it's sensible to start the degradation process with hydroxylated radicals that have few ions in solution. This sets the stage for the tenorite photocatalysis process37:
| 3 |
| 4 |
| 5 |
| 6 |
Moreover, due to anions' natural charge, their interactions should cause significant mineralization with minimal hydroxylated radicals and a realistic level of inorganic ions, if present in the organic structure. After photocatalysis produces superoxide anions ()) and hydroxyl radicals (), they react with organic molecules (MB) as detailed37:
| 7 |
The photo-electrons convert dissolved oxygen into radicals that decompose MB. At the same time, the gaps in the valence band (vb) oxidize water via the radical, extending carrier lifetime and preventing recombination.
The first-order concept is extensively used to describe the kinetics of MB photodegradation (Eq. 15), which allows the integration:
| 8 |
The −Ln(Ct/C0) progressions are linear for each initial concentration, indicating unstable Kapp values (0.002704 to 0.009365 min-1) with increasing precursor concentrations on tenorite films (0.01 to 0.1 g/ml) as shown in Fig. 6(a.1). R2 (the regression coefficient) was ~ 0.99 (a stable value according to the Langmuir–Hinshelwood hypothesis). It is possible to determine the half-time (t1/2) using the Kapp parameters:
| 9 |
The initial degradation rate increases with concentration (C0), driven by t1/2 and Kapp values. Enhanced interaction between MB and photogenerated molecules on tenorite film boosts overall photocatalytic efficiency. Detailed analysis of tenorite thin film properties and their influence on study results, illustrated in Fig. 9.
Figure 9.
Summary of tenorite thin films properties and their results in this study.
Methods
Materials
Copper(II) nitrate hydrate (Cu(NO3)2·xH2O) (Sigma Aldrich, Product No.: 923087, 99.99%) served as a crucial component in the synthesis of tenorite, the precursor material. To ensure optimal performance, a number of carefully selected solvents and chelating agents, namely ethylene glycol (C2H6O2) (Sigma Aldrich, Product No.: 721972, 99.9 atom % D), 1-Propanol (C3H8O) (Sigma Aldrich, Product No.: 34871, ≥ 99.9%), and hydrochloric acid (HCl) (Sigma Aldrich Product No.: 320331) were employed. In addition, double-distilled water and hydrochloric acid were used as effective detergents. Finally, methylene blue (C16H18ClN3S) (Sigma Aldrich Product No.: PHR3838), was used for photocatalytic degradation.
Dip-coating technique of preparing tenorite films
To synthesize tenorite films, dissolve 0.5, 1, 2, 3, and 5 g of copper(II) nitrate hydrate in 50 ml of 1-propanol and stir for 30 min until all particles of salt were dispersed (each concentration was prepared individually). Then, for 10 min, 0.5 mL of ethylene glycol and 0.2 mL of hydrochloric acid were added dropwise to the stirring solution to increase viscosity and efficiently disperse throughout the solutions. Finally, continuous stirring was performed until the solution was homogenous (for 1 h). Glass substrates (25.4*76.2*1 mm) in size were immersed in hydrochloric acid and distilled water (20:100%) for 30 min to remove impurities before being washed with double distilled water (DW) and dried with lightly cleaned paper. The films were immersed for 2 min in the solutions with different precursor concentrations of 0.01, 0.02, 0.04, 0.06, and 0.1 g/ml using the HOLMARC apparatus (No. HO-TH-02B). This approach was performed seven times at a withdrawal speed of 9 mm/s. Then, all films were annealed for 30 min at 550 °C with a heating rate of 5 °C/min in an oven (Wisd, Daihan Scientific). The results show that the surface structure of the tenorite films changes significantly with increasing precursor concentrations, as shown in Fig. 10.
Figure 10.
The impact of precursor concentrations (0.01, 0.02, 0.04, 0.06, and 0.1 g/ml) on the morphological structure of tenorite thin films.
Tenorite films characterization
The structural analysis of tenorite thin films was thoroughly explored through multiple techniques. X-ray diffraction was performed using a state-of-the-art Bruker (D8 Advance model) diffractometer with CuKa radiation (= 1.5406) and a scan range from 10 to 80° at a rate of 0.03° s-1 at room temperature. The size of the tenorite crystallites was determined by employing the standard Scherrer's equation on the X-ray diffraction pattern. This technique proved to be highly effective in providing detailed insights into the structural properties of the tenorite thin films.
| 10 |
where is the crystallite size, is a numerical factor, is the wavelength of X-ray, is half-width maximum, and is the diffraction angle67.
To investigate the hydrophobicity/hydrophilicity of the film surfaces, a handmade approach was employed at ambient temperature. The progression of contact angles was captured using a charge-coupled camera (CCD) connected to an image analyzer. An average value of the water droplet contact angle for each film surface was calculated using the software IC. The contact angles were measured five times carefully using a micropipette (SCILOGEX-iso 9001/13485), corresponding to 10 μl. The average droplet contact angle was calculated using the following equation, as shown in Fig. 11:
| 11 |
where is the and average value (°), is the left angle of the water drop (°), and is the right angle (°).
Figure 11.
Illustration of tests for calculating the contact angle of a water droplet.
The film thickness (t) was calculated using the following equation:
| 12 |
where t is the film thickness (cm), A is the film surface area (cm2), m is the mass of the film (g), and g is the film density (g.cm-3)68. Additionally, the film thickness was calculated for each side of the film (front, back, and bottom, along with the small sides).
A mechanical profilometer (Tencor P-7) was used to measure the 3D surface topography and surface roughness (done in ambient atmosphere and at room temperature) using the 2-bar technique with filter modification (Gaussian filter, 0.800 m cut-off with edge effects).
A scanning electron microscope (SEM, JEOL-JSM 5800) with energy-dispersive X-ray spectroscopy (EDX) was used to investigate the basic chemical composition and morphology.
A UV–vis instrument (JASCO V-770) with a wavelength range of 280–1200 nm was used to investigate the optical transmission spectra of the films. Band gap values were calculated using the equation of Tauc and Menth.
| 13 |
where α is the absorptivity, h is Planck's constant, v is the frequency of the radiation, Eg is the visual indirect band gap, A is the constant of proportionality, and η is the type of optical transition that occurs as a result of photon absorption.
Preparation of the photocatalytic process
The photocatalytic performance of the tenorite thin film was evaluated by measuring the degradation of MB under solar irradiation in weather conditions recorded on October 15, 2022, in Biskra, Algeria. A stock solution of 2.2 ppm MB was prepared by dissolving MB in 1 L of double distilled water, and then stirring for 15 min. The solution was then stored in a dark place for 30 min. Each film with an area of approximately 20 cm2 was placed in 100 ml of MB solution and positioned at an angle of 37° ± to align with the sun's rays in Biskra. Photocatalytic degradation was monitored for 180 min, with measurements of air temperature, wind speed, and humidity taken at regular intervals. During the reaction, 2.5 ml of the mixture was taken every 45 min and the change in absorbance was measured using a spectrophotometer (UV–VIS JASCO V-770) at a wavelength range of 300–800 nm. To confirm the photocatalytic activity of the tenorite films, the MB solution was exposed under sunlight without the film as well as in a dark place for 3 h. The rate of photocatalytic efficiency (% degradation) was calculated using the following equation:
| 14 |
where C0 and Ct are the dye (MB) concentration (C0 is the initial concentration at 0 time and Ct at t time). The equation of the constant rate (Kapp) and the correlation coefficient (R2) was calculated using the following equation:
| 15 |
where r is the rate, C is the concentration, t is the time evolution, and Kapp (min-1) is the pseudo-1st rate constant.
Conclusion
The study investigated the impact of precursor concentrations variation on the properties of tenorite thin films prepared by sol–gel processes and applied to the films by the dip-coating method. The results showed that with the increase of precursor concentrations of tenorite from 0.01 to 0.1 g/ml, the size of the crystal structure increased (from 0.04 to 0.1 g/ml), the particle size distribution became wider (from 13 to 72 nm), the surface of the films became more hydrophobic (from 23.7 to 65.6°), the thickness of the films increased (from 28.6 to 1276.8 nm), and the surface roughness increased (from 1.41 to 77.3 nm). The wettability test showed that the surface of the 0.1 g/ml film improved by 21.47% in indirect sunlight compared to the darkness. Analysis of surface morphology showed that the appearance of grains on the surface of the films increased with increasing precursor concentrations. The transmittance rates of the films at 600 nm ranged from 0.02% to 90.94%. The direct optical band gaps of the films ranged from 2.74 to 1.21 eV, and the indirect band gaps ranged from 1.05 to 1.11 eV, indicating that the indirect band gaps were not affected by precursor concentrations variation. The photocatalytic efficiency of the films toward dyes (MB) was affected by the precursor concentrations of tenorite, crystal phase, crystal size, thickness, wettability, surface roughness, and direct band gap. These tenorite thin films are unique photocatalysts that are highly efficient and environmentally friendly due to their heterogeneous and wettable surfaces, hydroxyl radicals, and superoxide anions. In addition, the study found that these tenorite thin films are highly reusable and stable, making them ideal for real-world applications.
Acknowledgements
The authors would like to thank the Algerian Directorate General for Scientific Research and Technological Development-DGRSDT for financial assistance.
Author contributions
M.A.: Experimental investigation (lead), methodology (lead), data analysis (lead), visualization (lead), writing—original draft (lead), writing and revision (lead), sample fabrication (lead), theory (lead), conceptualization (lead). H.B.T.: Supervision (lead), funding acquisition (lead). E.G.T.: Supervision (contributed), funding acquisition (contributed), writing, and revision (contributed). S.R.: Supervision (contributed). B.G.: Writing, and revision (contributed). G.G.H.: Writing, and revision (contributed).
Data availability
All data generated or analysed during this study are included in this published article.
Competing interests
The authors declare no competing interests.
Footnotes
Publisher's note
Springer Nature remains neutral with regard to jurisdictional claims in published maps and institutional affiliations.
References
- 1.Sridevi M, et al. Role of nanomaterial’s as adsorbent for heterogeneous reaction in waste water treatment. J. Mol. Struct. 2021;1241:130596. doi: 10.1016/j.molstruc.2021.130596. [DOI] [Google Scholar]
- 2.Wang J, Shi Y, Wang Y, Li Z. Rational design of metal halide perovskite nanocrystals for photocatalytic CO2 Reduction: Recent advances, challenges, and prospects. ACS Energy Lett. 2022;7:2043–2059. doi: 10.1021/acsenergylett.2c00752. [DOI] [Google Scholar]
- 3.Wu L, et al. In-situ assembling 0D/2D Z-scheme heterojunction of Lead-free Cs2AgBiBr 6/Bi2WO6 for enhanced photocatalytic CO2 reduction. J. Colloid Interface Sci. 2023;629:233–242. doi: 10.1016/j.jcis.2022.08.152. [DOI] [PubMed] [Google Scholar]
- 4.Mashkoor F, et al. A smart recycling solution: WS2-halloysite nanocomposite for heavy metals remediation from wastewater and postliminar application in electrochemical supercapacitor for energy storage. Appl. Clay Sci. 2023;245:107149. doi: 10.1016/j.clay.2023.107149. [DOI] [Google Scholar]
- 5.Zhang Y, et al. Ferroelectric polarization effect on the photocatalytic activity of Bi0.9Ca0.1FeO3/CdS S-scheme nanocomposites. J. Environ. Sci. 2023;124:310–318. doi: 10.1016/j.jes.2021.09.021. [DOI] [PubMed] [Google Scholar]
- 6.Chellammal Gayathri R, Elakkiya V, Sumathi S. Synthesis of cerium and bismuth doped nickel aluminate for the photodegradation of methylene blue, methyl orange and rhodamine B dyes. Chemosphere. 2022;303:135056. doi: 10.1016/j.chemosphere.2022.135056. [DOI] [PubMed] [Google Scholar]
- 7.Althamthami M, et al. Effect of different Cu: Co film concentrations on photocatalytic reactions of ethanol, MB, AMX, and Cr(VI): A study of film properties and effects of photoxidation. J. Environ. Chem. Eng. 2023;11:111247. doi: 10.1016/J.JECE.2023.111247. [DOI] [Google Scholar]
- 8.Jeong C, et al. A review on metal-organic frameworks for the removal of hazardous environmental contaminants. Sep. Purif. Technol. 2023;305:122416. doi: 10.1016/j.seppur.2022.122416. [DOI] [Google Scholar]
- 9.Sun H, Lee SY, Park SJ. Bimetallic CuPd alloy nanoparticles decorated ZnO nanosheets with enhanced photocatalytic degradation of methyl orange dye. J. Colloid Interface Sci. 2023;629:87–96. doi: 10.1016/j.jcis.2022.09.054. [DOI] [PubMed] [Google Scholar]
- 10.Althamthami M, Guettaf Temam E, Ben Temam H, Hasan GG, Malfi N. Influence of hole-scavenger and different withdrawn speeds on photocatalytic activity of Co3O4 thin films under sunlight irradiation. Ceram. Int. 2022;48:31570–31578. doi: 10.1016/j.ceramint.2022.07.078. [DOI] [Google Scholar]
- 11.Maroudas A, et al. Synergetic decolorization of azo dyes using ultrasounds, photocatalysis and photo-fenton reaction. Ultrason. Sonochem. 2021;71:105367. doi: 10.1016/j.ultsonch.2020.105367. [DOI] [PMC free article] [PubMed] [Google Scholar]
- 12.Althamthami M, Guettaf Temam E, Temam HB, Saad R, Hasan GG. Improved photocatalytic activity under the sunlight of high transparent hydrophilic Bi-doped TiO2 thin-films. J. Photochem. Photobiol. A Chem. 2023;443:114818. doi: 10.1016/j.jphotochem.2023.114818. [DOI] [Google Scholar]
- 13.Dursun S, Akyıldız H, Kalem V. Production of CuCoO2 nanoparticle/SnO2 nanofiber heterostructures for visible light photocatalytic applications. J. Photochem. Photobiol. A Chem. 2023;434:114233. doi: 10.1016/j.jphotochem.2022.114233. [DOI] [Google Scholar]
- 14.Gautam RK, et al. Biochar for remediation of agrochemicals and synthetic organic dyes from environmental samples: A review. Chemosphere. 2021;272:129917. doi: 10.1016/j.chemosphere.2021.129917. [DOI] [PubMed] [Google Scholar]
- 15.Trang TNQ, Doanh TT, Trinh NTP, Thu VTH. Self-assembly of Ag photosensitized SrTiO3 3D binary architectures for highly efficient visible light-driven dyeing wastewater splitting. J. Alloys Compd. 2022;916:165323. doi: 10.1016/j.jallcom.2022.165323. [DOI] [Google Scholar]
- 16.Hasan GG, et al. Synergistic effect of novel biosynthesis SnO2@Fe3O4 nanocomposite: A comprehensive study of its photocatalytic of Dyes & antibiotics, antibacterial, and antimutagenic activities. J. Photochem. Photobiol. A Chem. 2023;443:114874. doi: 10.1016/j.jphotochem.2023.114874. [DOI] [Google Scholar]
- 17.Zhang C, et al. Continuous inactivation of human adenoviruses in water by a novel g-C3N4/WO3/biochar memory photocatalyst under light-dark cycles. J. Hazard Mater. 2023;442:130013. doi: 10.1016/j.jhazmat.2022.130013. [DOI] [PubMed] [Google Scholar]
- 18.Ansari SA. Elemental semiconductor red phosphorus/ZnO nanohybrids as high performance photocatalysts. Ceram. Int. 2023;49:17746–17752. doi: 10.1016/j.ceramint.2023.02.140. [DOI] [Google Scholar]
- 19.Ansari SA, et al. Emerging NiO–rGO nanohybrids for antibiotic pollutant degradation under visible-light irradiation. Surfaces Interfaces. 2023;40:103078. doi: 10.1016/j.surfin.2023.103078. [DOI] [Google Scholar]
- 20.Zhao G, et al. Two birds with one stone: Engineering polymeric carbon nitride with n-π∗ electronic transition for extending light absorption and reducing charge recombination. Adv. Powd. Mater. 2023;2:100077. doi: 10.1016/j.apmate.2022.100077. [DOI] [Google Scholar]
- 21.Hunge YM, Yadav AA, Kang SW, Jun Lim S, Kim H. Visible light activated MoS2/ZnO composites for photocatalytic degradation of ciprofloxacin antibiotic and hydrogen production. J. Photochem. Photobiol. A Chem. 2023;434:114250. doi: 10.1016/j.jphotochem.2022.114250. [DOI] [Google Scholar]
- 22.Chen X, Liu L, Yu PY, Mao SS. Increasing solar absorption for photocatalysis with black hydrogenated titanium dioxide nanocrystals. Science. 2011;1979(331):746–750. doi: 10.1126/science.1200448. [DOI] [PubMed] [Google Scholar]
- 23.Trang TNQ, et al. In situ spatial charge separation of an Ir@TiO2 multiphase photosystem toward highly efficient photocatalytic performance of hydrogen production. J. Phys. Chem. C. 2020;124:16961–16974. doi: 10.1021/acs.jpcc.0c03590. [DOI] [Google Scholar]
- 24.Yosefi L, Haghighi M, Maleki M. Influence of solvent on solvothermal fabrication of BixOyIz nanophotocatalyst over Zn-Fe spinel for comparative demineralization of orange II and methylene blue under simulated solar light illumination. J. Environ. Chem. Eng. 2022;10:107613. doi: 10.1016/j.jece.2022.107613. [DOI] [Google Scholar]
- 25.Wang S, et al. Development of CuO coated ceramic hollow fiber membrane for peroxymonosulfate activation: A highly efficient singlet oxygen-dominated oxidation process for bisphenol a degradation. Appl. Catal. B. 2019;256:117783. doi: 10.1016/j.apcatb.2019.117783. [DOI] [Google Scholar]
- 26.Hasan GG, Khelef A, Chaabia N, Tedjani ML, Althamthami M. Electrochemical deposition of Ag nanoparticles on ITO-coated glass: Effect of different cyclic voltammetry scan rates on Ag deposition. Ferroelectrics. 2023;602(1):121–134. doi: 10.1080/00150193.2022.2149307602,121-134. [DOI] [Google Scholar]
- 27.Heng ZW, Chong WC, Pang YL, Koo CH. An overview of the recent advances of carbon quantum dots/metal oxides in the application of heterogeneous photocatalysis in photodegradation of pollutants towards visible-light and solar energy exploitation. J. Environ. Chem. Eng. 2021;9:105199. doi: 10.1016/j.jece.2021.105199. [DOI] [Google Scholar]
- 28.Ahmadi R, Afshar A. In vitro study: Bond strength, electrochemical and biocompatibility evaluations of TiO2/Al2O3 reinforced hydroxyapatite sol–gel coatings on 316L SS. Surf. Coat. Technol. 2021;405:126594. doi: 10.1016/j.surfcoat.2020.126594. [DOI] [Google Scholar]
- 29.Singh PP, Dixit K, Sinha N. A sol-gel based bioactive glass coating on laser textured 316L stainless steel substrate for enhanced biocompatability and anti-corrosion properties. Ceram. Int. 2022;48:18704–18715. doi: 10.1016/j.ceramint.2022.03.144. [DOI] [Google Scholar]
- 30.Inkrataitė G, Stankevičiūtė Ž, Skaudžius R. Determination of different garnet films characteristics prepared via sol-gel spin or dip-coatings techniques. J. Lumin. 2022;244:118751. doi: 10.1016/j.jlumin.2022.118751. [DOI] [Google Scholar]
- 31.Bidaud C, et al. Photocrosslinking and photopatterning of magneto-optical nanocomposite sol–gel thin film under deep-UV irradiation. Sci. Rep. 2021;2021(11):1–13. doi: 10.1038/s41598-021-84376-6. [DOI] [PMC free article] [PubMed] [Google Scholar]
- 32.Zaremba OT, Goldt AE, Khabushev EM, Anisimov AS, Nasibulin AG. Highly efficient doping of carbon nanotube films with chloroauric acid by dip-coating. Mater. Sci. Eng.: B. 2022;278:115648. doi: 10.1016/j.mseb.2022.115648. [DOI] [Google Scholar]
- 33.Anusha S, Ravinder G, Murthi MN, Rao PC, Sreelatha CJ. Study on structural, morphological, optical, and luminescence properties of nickel oxide thin-film synthesized by dip-coating technique. Mater. Today Proc. 2022;52:1733–1738. doi: 10.1016/j.matpr.2021.11.378. [DOI] [Google Scholar]
- 34.Chen Y, et al. Controllable β-phase formation in poly(9,9-dioctylfluorene) by dip-coating for blue polymer light-emitting diodes. Thin Solid Films. 2022;746:139118. doi: 10.1016/j.tsf.2022.139118. [DOI] [Google Scholar]
- 35.Lei L, Bai Y, Liu Y, Liu J. An investigation on dip-coating technique for fabricating anode-supported solid oxide fuel cells. Int. J. Appl. Ceram. Technol. 2015;12:351–357. doi: 10.1111/ijac.12147. [DOI] [Google Scholar]
- 36.Beyribey B, Bayne J, Persky J. The effect of dip-coating parameters on the thickness and uniformity of BCZYZ electrolyte layer on porous NiO-BCZYZ tubular supports. Ceram. Int. 2022;48:6046–6051. doi: 10.1016/j.ceramint.2021.11.141. [DOI] [Google Scholar]
- 37.Li J, Guo J, Zhang J, Sun Z, Gao J. Surface etching and photodeposition nanostructures core-shell Cu2O@CuO-Ag with S-scheme heterojunction for high efficiency photocatalysis. Surfaces Interfaces. 2022;34:102308. doi: 10.1016/j.surfin.2022.102308. [DOI] [Google Scholar]
- 38.Das HT, et al. Tuning the optical, electrical, and optoelectronic properties of CuO thin films fabricated by facile SILAR Dip-coating technique for photosensing applications. J. Inorg. Organomet. Polym. Mater. 2021;31:2606–2614. doi: 10.1007/s10904-021-01928-z. [DOI] [Google Scholar]
- 39.Hamad H, et al. The superior photocatalytic performance and DFT insights of S-scheme CuO@TiO2 heterojunction composites for simultaneous degradation of organics. Sci. Rep. 2022;2022(12):1–20. doi: 10.1038/s41598-022-05981-7. [DOI] [PMC free article] [PubMed] [Google Scholar]
- 40.Musa AMM, Farhad SFU, Gafur MA, Jamil ATMK. Effects of withdrawal speed on the structural, morphological, electrical, and optical properties of CuO thin films synthesized by dip-coating for CO2 gas sensing. AIP Adv. 2021;11:115004. doi: 10.1063/5.0060471. [DOI] [Google Scholar]
- 41.Yahia B, Faouzi S, Ahmed C, lounis S, Mohamed T. A new hybrid process for Amoxicillin elimination by combination of adsorption and photocatalysis on (CuO/AC) under solar irradiation. J. Mol. Struct. 2022;1261:132769. doi: 10.1016/j.molstruc.2022.132769. [DOI] [Google Scholar]
- 42.Sudha V, Murugadoss G, Thangamuthu R. Structural and morphological tuning of Cu-based metal oxide nanoparticles by a facile chemical method and highly electrochemical sensing of sulphite. Sci. Rep. 2021;2021(11):1–12. doi: 10.1038/s41598-021-82741-z. [DOI] [PMC free article] [PubMed] [Google Scholar]
- 43.Babu MMH, Podder J, Tofa RR, Ali L. Effect of Co doping in tailoring the crystallite size, surface morphology and optical band gap of CuO thin films prepared via thermal spray pyrolysis. Surfaces Interfaces. 2021;25:101269. doi: 10.1016/j.surfin.2021.101269. [DOI] [Google Scholar]
- 44.Chen Y, et al. Band gap manipulation and physical properties of preferred orientation CuO thin films with nano wheatear array. Ceram. Int. 2018;44:1134–1141. doi: 10.1016/j.ceramint.2017.10.070. [DOI] [Google Scholar]
- 45.Gamal Hasan G, et al. Fabrication and characterization of NFMA/FTO electrochemical thin film by electrodeposition and immersion techniques: An effective detector for H2O2 and sunlight-driven MB degradation. J. Photochem. Photobiol. A Chem. 2023;445:115112. doi: 10.1016/j.jphotochem.2023.115112. [DOI] [Google Scholar]
- 46.Chen ML, et al. Exploration of double Z-type ternary composite long-afterglow/graphitic carbon nitride@metal-organic framework for photocatalytic degradation of methylene blue. J. Colloid Interface Sci. 2023;629:409–421. doi: 10.1016/j.jcis.2022.08.189. [DOI] [PubMed] [Google Scholar]
- 47.Arif M, et al. Synthesis, characteristics and mechanistic insight into the clays and clay minerals-biochar surface interactions for contaminants removal: A review. J Clean Prod. 2021;310:127548. doi: 10.1016/j.jclepro.2021.127548. [DOI] [Google Scholar]
- 48.El-Ghobashy MA, Salem IA, El-Dahrawy WM, Salem MA. Fabrication of α-MnO2/Fe-Mn binary oxide nanocomposite as an efficient adsorbent for the removal of methylene blue from wastewater. J. Mol. Struct. 2023;1272:134118. doi: 10.1016/j.molstruc.2022.134118. [DOI] [Google Scholar]
- 49.Khalil AM, Kenawy SH. Hybrid membranes based on clay-polymer for removing methylene blue from water. Acta Chim. Slov. 2020;67:96–104. doi: 10.17344/acsi.2019.5227. [DOI] [PubMed] [Google Scholar]
- 50.Wang K-S, et al. Treatment and toxicity evaluation of methylene blue using electrochemical oxidation, fly ash adsorption and combined electrochemical oxidation-fly ash adsorption. J. Environ. Manage. 2010;91:1778–1784. doi: 10.1016/j.jenvman.2010.03.022. [DOI] [PubMed] [Google Scholar]
- 51.Siddiqui SI, Manzoor O, Mohsin M, Chaudhry SA. Nigella sativa seed based nanocomposite-MnO2/BC: An antibacterial material for photocatalytic degradation, and adsorptive removal of Methylene blue from water. Environ. Res. 2019;171:328–340. doi: 10.1016/j.envres.2018.11.044. [DOI] [PubMed] [Google Scholar]
- 52.Ramar V, Balasubramanian K. Reduced graphene oxide/WO3 nanorod composites for photocatalytic degradation of methylene blue under sunlight irradiation. ACS Appl. Nano Mater. 2021;4:5512–5521. doi: 10.1021/acsanm.1c00863. [DOI] [Google Scholar]
- 53.Yıldız DE, Gullu HH, Cavus HK. Effect of TiO2 thin film with different dopants in bringing Au-metal into a contact with n-Si. J. Inorg. Organomet. Polym. Mater. 2022;2021(32):1067–1077. doi: 10.1007/s10904-021-02201-z. [DOI] [Google Scholar]
- 54.Ge X, et al. Micro/nano-structured TiO2 surface with dual-functional antibacterial effects for biomedical applications. Bioact. Mater. 2019;4:346–357. doi: 10.1016/j.bioactmat.2019.10.006. [DOI] [PMC free article] [PubMed] [Google Scholar]
- 55.Hayashi M, et al. In vitro characterization and osteoblast responses to nanostructured photocatalytic TiO2 coated surfaces. Acta Biomater. 2012;8:2411–2416. doi: 10.1016/j.actbio.2012.03.010. [DOI] [PubMed] [Google Scholar]
- 56.Kabir MH, Ibrahim H, Ayon SA, Billah MM, Neaz S. Structural, nonlinear optical and antimicrobial properties of sol-gel derived, Fe-doped CuO thin films. Heliyon. 2022;8:e10609. doi: 10.1016/j.heliyon.2022.e10609. [DOI] [PMC free article] [PubMed] [Google Scholar]
- 57.Tripathi A, Dixit T, Agrawal J, Singh V. Bandgap engineering in CuO nanostructures: Dual-band, broadband, and UV-C photodetectors. Appl. Phys. Lett. 2020;116:111102. doi: 10.1063/1.5128494. [DOI] [Google Scholar]
- 58.Siddiqui H, Parra MR, Pandey P, Qureshi MS, Haque FZ. Performance evaluation of optimized leaf-shaped two-dimension (2D) potassium doped CuO nanostructures with enhanced structural, optical and electronic properties. Ceram. Int. 2020;46:20404–20414. doi: 10.1016/j.ceramint.2020.05.131. [DOI] [Google Scholar]
- 59.Diao F, Tian F, Liang W, Feng H, Wang Y. Mechanistical investigation on the self-enhanced photocatalytic activity of CuO/Cu2O hybrid nanostructures by density functional theory calculations. Phys. Chem. Chem. Phys. 2016;18:27967–27975. doi: 10.1039/C6CP03977D. [DOI] [PubMed] [Google Scholar]
- 60.Wei Y, Wu Q, Meng H, Zhang Y, Cao C. Recent advances in photocatalytic self-cleaning performances of TiO2-based building materials. RSC Adv. 2023;13:20584. doi: 10.1039/D2RA07839B. [DOI] [PMC free article] [PubMed] [Google Scholar]
- 61.Zhang L, Moralejo C, Anderson WA. A review of the influence of humidity on photocatalytic decomposition of gaseous pollutants on TiO2-based catalysts. Can. J. Chem. Eng. 2020;98:263–273. doi: 10.1002/cjce.23652. [DOI] [Google Scholar]
- 62.Choi JS, et al. Ag-decorated CuO NW@TiO2 heterojunction thin film for improved visible light photocatalysis. Surfaces Interfaces. 2022;34:102380. doi: 10.1016/j.surfin.2022.102380. [DOI] [Google Scholar]
- 63.Xu L, Su J, Zheng G, Zhang L. Enhanced photocatalytic performance of porous ZnO thin films by CuO nanoparticles surface modification. Mater. Sci. Eng. B. 2019;248:114405. doi: 10.1016/j.mseb.2019.114405. [DOI] [Google Scholar]
- 64.Madkour M. CuxO thin films via ultrasonic spray pyrolysis as efficient solar photocatalysts: Single source polymeric coordinated precursor. Colloid Interface Sci. Commun. 2021;44:100497. doi: 10.1016/j.colcom.2021.100497. [DOI] [Google Scholar]
- 65.Mrabet C, Jaballah R, Mahdhi N, Boukhachem A, Amlouk M. CuO–ZnO nanocomposites-based thin films: Characterization, physical properties and sunlight photocatalytic degradation of organic pollutants. J. Alloys Compd. 2023;968:172252. doi: 10.1016/j.jallcom.2023.172252. [DOI] [Google Scholar]
- 66.Nguyen DT, et al. Experimental and numerical study on photocatalytic activity of the ZnO nanorods/CuO composite film. Sci. Rep. 2020;2020(10):1–8. doi: 10.1038/s41598-020-64784-w. [DOI] [PMC free article] [PubMed] [Google Scholar]
- 67.Devesa S, Rooney AP, Graça MP, Cooper D, Costa LC. Williamson-hall analysis in estimation of crystallite size and lattice strain in Bi1.34Fe0.66Nb1.34O6.35 prepared by the sol-gel method. Mater. Sci. Eng.: B. 2021;263:114830. doi: 10.1016/j.mseb.2020.114830. [DOI] [Google Scholar]
- 68.Guettaf Temam E, Djani F, Rahmane S, Ben Temam H, Gasmi B. Photocatalytic activity of Al/Ni doped TiO2 films synthesized by sol-gel method: Dependence on thickness and crystal growth of photocatalysts. Surfaces Interfaces. 2022;31:102077. doi: 10.1016/j.surfin.2022.102077. [DOI] [Google Scholar]
Associated Data
This section collects any data citations, data availability statements, or supplementary materials included in this article.
Data Availability Statement
All data generated or analysed during this study are included in this published article.


