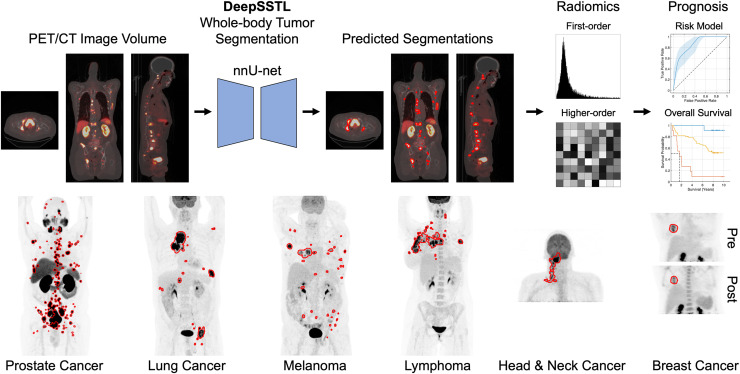
Visual Abstract
Keywords: deep learning, semisupervised transfer learning, PET/CT, tumor segmentation, cancer prognosis
Abstract
Automatic detection and characterization of cancer are important clinical needs to optimize early treatment. We developed a deep, semisupervised transfer learning approach for fully automated, whole-body tumor segmentation and prognosis on PET/CT. Methods: This retrospective study consisted of 611 18F-FDG PET/CT scans of patients with lung cancer, melanoma, lymphoma, head and neck cancer, and breast cancer and 408 prostate-specific membrane antigen (PSMA) PET/CT scans of patients with prostate cancer. The approach had a nnU-net backbone and learned the segmentation task on 18F-FDG and PSMA PET/CT images using limited annotations and radiomics analysis. True-positive rate and Dice similarity coefficient were assessed to evaluate segmentation performance. Prognostic models were developed using imaging measures extracted from predicted segmentations to perform risk stratification of prostate cancer based on follow-up prostate-specific antigen levels, survival estimation of head and neck cancer by the Kaplan–Meier method and Cox regression analysis, and pathologic complete response prediction of breast cancer after neoadjuvant chemotherapy. Overall accuracy and area under the receiver-operating-characteristic (AUC) curve were assessed. Results: Our approach yielded median true-positive rates of 0.75, 0.85, 0.87, and 0.75 and median Dice similarity coefficients of 0.81, 0.76, 0.83, and 0.73 for patients with lung cancer, melanoma, lymphoma, and prostate cancer, respectively, on the tumor segmentation task. The risk model for prostate cancer yielded an overall accuracy of 0.83 and an AUC of 0.86. Patients classified as low- to intermediate- and high-risk had mean follow-up prostate-specific antigen levels of 18.61 and 727.46 ng/mL, respectively (P < 0.05). The risk score for head and neck cancer was significantly associated with overall survival by univariable and multivariable Cox regression analyses (P < 0.05). Predictive models for breast cancer predicted pathologic complete response using only pretherapy imaging measures and both pre- and posttherapy measures with accuracies of 0.72 and 0.84 and AUCs of 0.72 and 0.76, respectively. Conclusion: The proposed approach demonstrated accurate tumor segmentation and prognosis in patients across 6 cancer types on 18F-FDG and PSMA PET/CT scans.
Cancer is a worldwide health concern and the second leading cause of death in the United States, with approximately 2 million projected cases in 2023 (1). Prostate, breast, lung, melanoma, lymphoma, and oral cavity and pharyngeal cancers were among the leading types of new estimated cases (1). Delays in cancer diagnosis and treatment were associated with increased mortality for surgical, chemotherapeutic, and radiotherapeutic modalities and may lead to increased advanced-stage disease (2).
Quantitative measures of molecular tumor burden on 18F-FDG and prostate-specific membrane antigen (PSMA) PET/CT are prognostic biomarkers (3). However, manual tumor quantification by radiologists is time-consuming, laborious, and subject to inter- and intrareader variability (4). Generalizable approaches for automated PET/CT tumor quantification are an important clinical need for early detection and treatment of cancer.
Radiomics performs high-throughput extraction of quantitative engineered features of malignant tumors from radiologic data (4). Deep learning methods automatically extract features from input images to model medical endpoints directly and require large training datasets with physician-defined annotations (4). Additionally, manual tumor delineation is not easily scalable, especially for patients with a high tumor burden. Manual delineation is further impacted by interobserver variability because of differences in levels of reader experience. Lastly, deep learning models for PET/CT are often developed for specific radiotracers, limiting their general applicability.
We developed a deep, semisupervised transfer learning (DeepSSTL) approach for fully automated whole-body tumor segmentation and prognosis on 18F-FDG and PSMA PET/CT scans using limited annotations. Radiomics features and whole-body imaging measures were extracted from predicted segmentations to build prognostic models for risk stratification, overall survival analysis, and prediction of response to therapy. Our approach demonstrated robust performance across patients with melanoma; lymphoma; and prostate, lung, head and neck, and breast cancers and may help alleviate physician workload for whole-body PET/CT tumor analysis.
MATERIALS AND METHODS
This retrospective study was approved by the Johns Hopkins institutional review board with a waiver for obtaining informed consent. Deidentified data were collected, in part, from The Cancer Imaging Archive (5).
Semisupervised Transfer Learning
A semisupervised transfer learning framework was developed to learn the whole-body tumor segmentation task using limited manual tumor annotations. The approach jointly optimized a nnU-net backbone, an automatically self-configuring deep learning framework (6), across source and target domains of 18F-FDG and PSMA PET/CT images with complete and incomplete annotations comprising fully and partially labeled manual segmentations, respectively. The DeepSSTL approach performed domain adaptation on 18F-FDG and PSMA PET/CT while iteratively improving segmentation performance.
Data
Data from 1,019 patients with cancer with PET/CT scans across 5 datasets and 6 cancer types were used. Patient demographics are provided in Table 1.
Table 1.
Patient Characteristics
| Characteristic | Data | Characteristic | Data |
|---|---|---|---|
| Dataset 1* | Dataset 3† | ||
| Age (y) (mean ± SD) | 65.67 ± 7.97 | Age (y) (mean ± SD) | 60.11 ± 16.51 |
| Sex | Sex | ||
| Men | 270 | Men | 290 |
| Women | 0 | Women | 211 |
| Overall PSMA-RADS score | Dataset 4‡ | ||
| NA | 12 | Age (y) (mean ± SD) | 62.47 ± 7.78 |
| 1 | 3 | Sex | |
| 2 | 24 | Men | 62 |
| 3 | 63 | Women | 12 |
| 4 | 48 | AJCC stage | |
| 5 | 120 | I | 14 |
| Dataset 2* | II | 5 | |
| Age (y) (mean ± SD) | 66.46 ± 7.35 | III | 13 |
| Sex | IV | 42 | |
| Men | 138 | Surgery | |
| Women | 0 | No | 70 |
| Gleason score | Yes | 4 | |
| NA | 2 | Chemotherapy | |
| ≤6 | 11 | No | 61 |
| 7 | 43 | Yes | 13 |
| 8 | 29 | Radiotherapy time (d) | 37 (31–47) |
| 9 | 44 | Dataset 5§ | |
| 10 | 9 | Age (y) (mean ± SD) | 48.69 ± 10.33 |
| Initial PSA level (ng/mL) | 6.38 (0.02–5,000.00) | Sex | |
| Follow-up PSA level (ng/mL) | 2.24 (0.00–7,270.00) | Men | 0 |
| PSA doubling time (mo) | 5.20 (0.23–81.70) | Women | 36 |
| Post-PSMA PET therapy | Pathologic response | ||
| NA | 37 | pCR | 10 |
| None | 7 | Non-pCR | 26 |
| Local | 18 | ||
| Systemic androgen-targeted | 56 | ||
| Systemic and cytotoxic | 20 |
Prostate cancer.
Lung cancer, melanoma, and lymphoma.
Head and neck cancer.
Breast cancer.
NA = not applicable.
Qualitative data are number; continuous data are median and range, except for age.
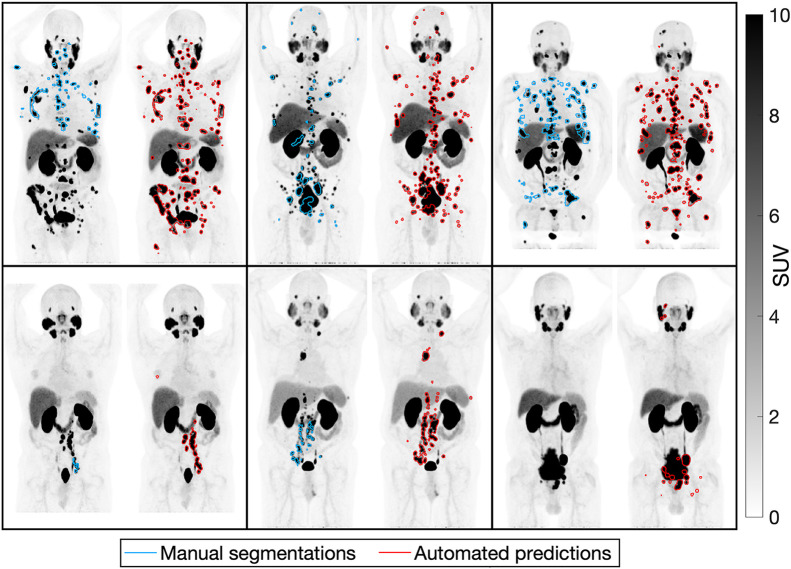
Datasets 1 and 2 included 18F-DCFPyL PSMA PET/CT scans of prostate cancer patients. Dataset 1 had 270 patients with incomplete manual segmentations (Fig. 1), with PSMA reporting and data system (PSMA-RADS) scores of 1–5 being assigned to segmented lesions and overall scans indicating the likelihood of prostate cancer (7). Dataset 2 had Gleason scores, initial serum prostate-specific antigen (PSA) levels, follow-up PSA levels, PSA doubling times, and post-PSMA PET/CT therapies for 138 patients with no tumor annotations.
FIGURE 1.
Incomplete manual tumor segmentations compared with predicted segmentations on maximum-intensity projections of PSMA PET scans of 6 patients with prostate cancer.
Datasets 3–5 consisted of 18F-FDG PET/CT scans from The Cancer Imaging Archive. Dataset 3 had complete manual tumor annotations for 168, 188, and 145 patients with lung cancer, melanoma, and lymphoma, respectively (8). Dataset 4 had clinical information on overall staging (by the cancer staging manual of the American Joint Committee on Cancer [AJCC], seventh edition), surgery, chemotherapy, radiotherapy duration, and overall survival for 74 head and neck cancer patients with no tumor annotations (9). Dataset 5 had longitudinal scans of 36 breast cancer patients undergoing neoadjuvant chemotherapy (10). Pre- and posttherapy scans were acquired for 36 and 25 patients, respectively, with no tumor annotations. Pathologic complete response (pCR) was defined as the absence of invasive cancer in the breast or lymph nodes at definitive surgery. Non-pCR was defined as residual invasive cancer or disease progression.
Datasets 1 and 3 were used to cross-validate the segmentation task via 5-fold cross-validation. Datasets 2, 4, and 5 were used for external testing and prognostic model development.
Tumor Quantification
Tumor detection and segmentation were evaluated on a lesionwise and voxelwise basis. True-positive rate, positive predictive value, Dice similarity coefficient, false-discovery rate, true-negative rate, and negative predictive value were assessed. Tumor detection performance was compared with that of models trained only on 18F-FDG or PSMA PET/CT images. Imaging measures, including molecular tumor volume (MTV), total lesion activity (TLA), number of lesions, SUVmean, and SUVmax, were quantified from predicted segmentations.
Radiomics Analysis
We used the Standardized Environment for Radiomics Analysis based on the Image Biomarker Standardization Initiative (11). First-order statistical and higher-order textural features, including morphology, intensity, intensity histogram, intensity volume histogram, cooccurrence matrix, run length matrix, size zone matrix, distance zone matrix, and neighborhood gray tone difference matrix, were extracted and redundant features were removed. In total, 397 radiomics features were calculated from PET/CT volumes of interest. Radiomics classifiers using random forest detected true-positive volumes of interest via 10-fold cross-validation (12). Overall accuracy and receiver-operating-characteristic analysis were assessed.
Risk Stratification
A risk model for prostate cancer was developed using the extracted whole-body imaging measures. Initial PSA levels of less than 10 ng/mL, 10–20 ng/mL, or more than 20 ng/mL were assigned to low-, intermediate-, or high-risk groups, respectively (13). The risk model used random forest to classify low- to intermediate- versus high-risk via 10-fold cross-validation. Risk predictions and Gleason scores were combined; patients who were predicted as high-risk, with Gleason scores of at least 8, were considered high-risk. Patients predicted as low-risk, with Gleason scores of 7, and patients with Gleason scores of 6 or lower were considered low-risk. Other cases were intermediate-risk. Overall accuracy, area under the receiver-operating-characteristic (AUC) curve, follow-up PSA levels, and PSA doubling times were assessed.
Survival Analysis
A risk score for head and neck cancer incorporated imaging measures and AJCC staging. Imaging measures in the lower quartile, within the interquartile range, or in the upper quartile were assigned 0, 1, or 2 points, respectively. AJCC stages I, II, or III–IV were assigned 0, 1, or 2 points, respectively. Points were summed to yield a risk score ranging from 0 to 12. Patients with a risk score of 0, 1–9, and 10–12 were considered low-, intermediate-, and high-risk, respectively. Overall survival was estimated by the Kaplan–Meier method, with groups being compared by the log-rank test (14). Univariable and multivariable Cox regression models were assessed. The Harrell C-index was evaluated.
Treatment Response Prediction
Imaging measures were extracted and assessed for both pre- and posttherapy scans of breast cancer patients undergoing neoadjuvant chemotherapy. Decision tree classifiers predicted pCR via leave-one-out cross-validation using pre- and posttherapy imaging measures. Overall accuracy, AUC, area under the precision-recall curve, true-positive rate, positive predictive value, true-negative rate, and negative predictive value were assessed.
Statistical Assessment
Normality was assessed by the Shapiro–Wilk test. Statistical significance was assessed using the Wilcoxon signed-rank test, Wilcoxon rank-sum test, and McNemar test when comparing paired, unpaired, and binary observations, respectively. A P value of less than 0.05 was used to infer significant differences. The Benjamini–Hochberg method was used for multiple comparisons. Spearman rank correlation coefficients (ρ) were quantified. Receiver-operating-characteristic curves with 95% CIs were computed with 1,000 bootstrap samples. Optimal thresholds were determined by receiver-operating-characteristic analysis using the Youden index. Analyses were conducted with MATLAB (2023b) and Python (3.10.5). The approach was implemented with PyTorch (1.12.0) using an NVIDIA A6000 GPU.
RESULTS
Tumor Quantification
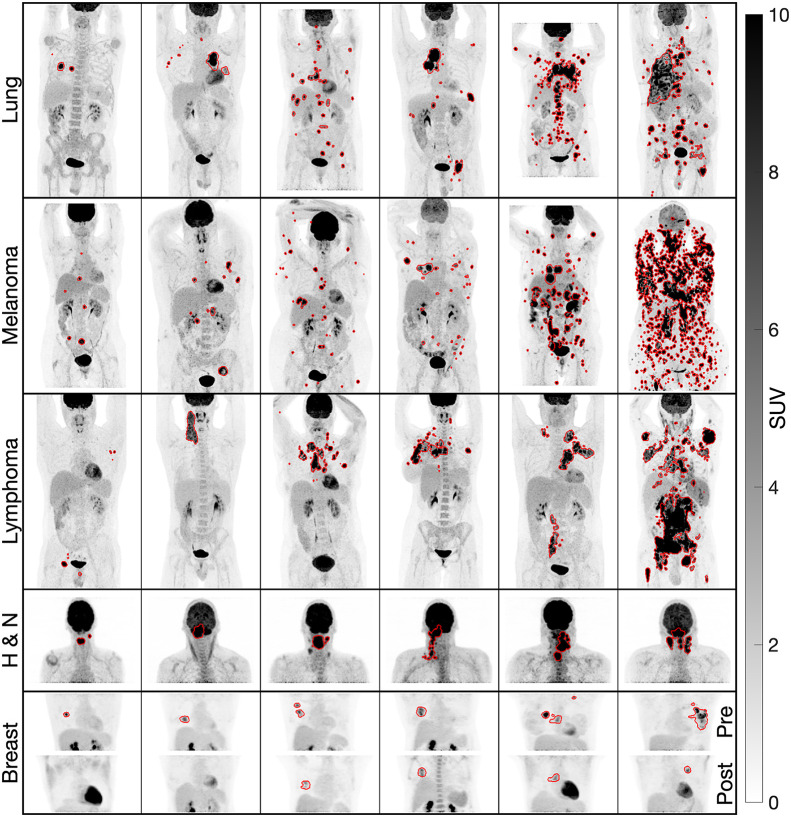
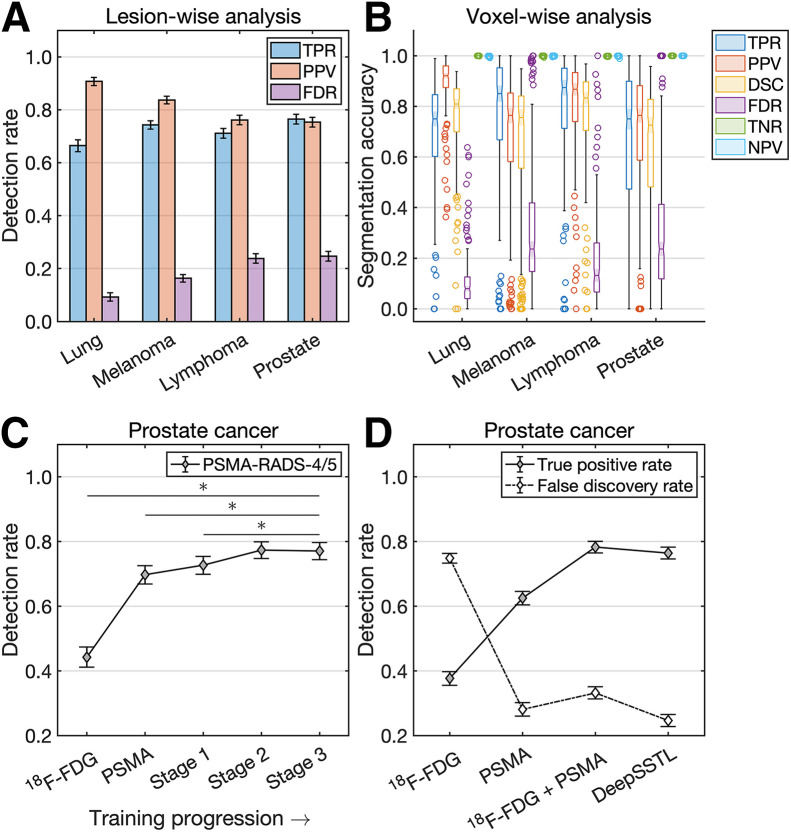
Illustrative examples of predicted segmentations are shown in Figures 1 and 2. Tumor detection and segmentation performances are quantified in Figure 3. Our approach yielded median true-positive rates of 0.75, 0.85, 0.87, and 0.75; median positive predictive values of 0.92, 0.76, 0.87, and 0.76; median Dice similarity coefficients of 0.81, 0.76, 0.83, and 0.73; and median false-discovery rates of 0.08, 0.24, 0.13, and 0.24 for patients with lung cancer, melanoma, lymphoma, and prostate cancer, respectively, on voxelwise segmentation. The approach yielded median true-negative rates and negative predictive values of 1.00 across all patients.
FIGURE 2.
Predicted segmentations on maximum-intensity projections of 18F-FDG PET scans of lung cancer, melanoma, lymphoma, head and neck cancer (H & N), and breast cancer. Pre- and posttherapy scans of breast cancer are shown (bottom row), with first 2 patients from left to right having pCR and the others being nonresponders.
FIGURE 3.
(A and B) Lesionwise (A) and voxelwise (B) analysis of tumor detection and segmentation. (C and D) Prostate cancer detection rates by DeepSSTL approach throughout different stages of training progression (C) and compared with baseline models (D). DSC = Dice similarity coefficient; FDR = false-discovery rate; NPV = negative predictive value; PPV = positive predictive value; TNR = true-negative rate; TPR = true-positive rate.
The DeepSSTL approach yielded a true-positive rate of 0.77 on PSMA-RADS-4/5 lesions, with improved detection rates throughout training (P < 0.001) (Fig. 3C). The approach had a higher true-positive rate of 0.76 on prostate cancer lesions than did baseline models trained on only 18F-FDG or PSMA PET/CT images, with true-positive rates of 0.38 and 0.63, respectively (P < 0.001) (Fig. 3D). Although a model trained on 18F-FDG and PSMA PET/CT images had a higher true-positive rate than baseline models, the model trained on both sets of images had a higher false-discovery rate of 0.33 than did the model trained only on PSMA PET/CT images, which had a false-discovery rate of 0.28. Our DeepSSTL approach maintained a high true-positive rate and had the lowest false-discovery rate (0.25) of all models (P < 0.05).
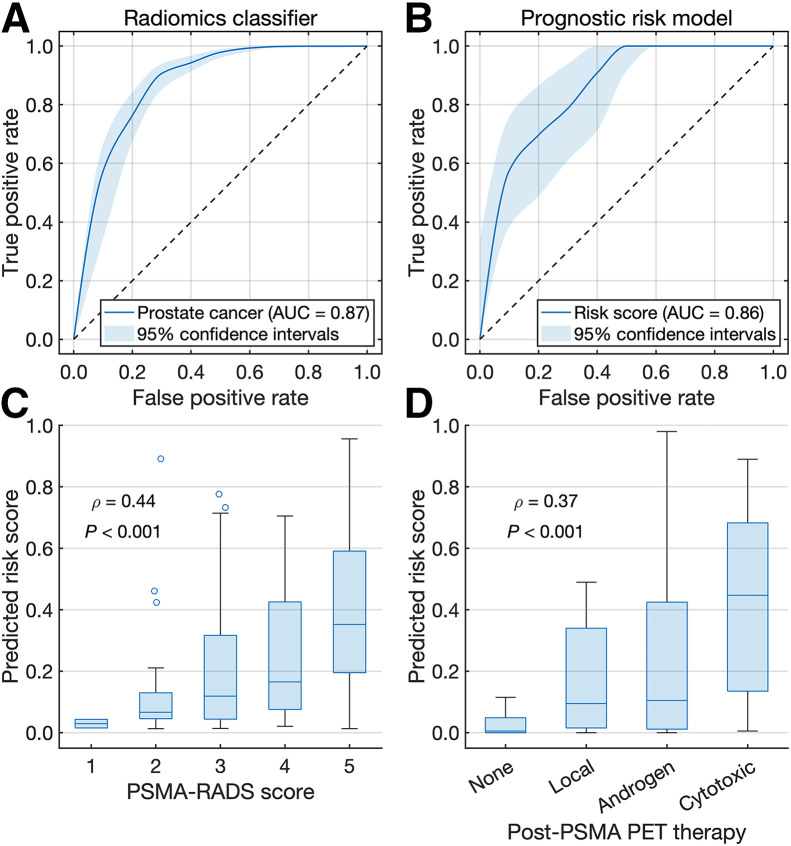
The DeepSSTL approach yielded higher detection rates for lesions with higher tumor volumes across all cancer types (Supplemental Fig. 1; supplemental materials are available at http://jnm.snmjournals.org). Radiomics classifiers detected true-positive volumes of interest with overall accuracies of 0.85, 0.81, 0.74, and 0.93 and AUCs of 0.87, 0.83, 0.79, and 0.87 for patients with lung cancer, melanoma, lymphoma, and prostate cancer, respectively (Supplemental Fig. 2; Fig. 4A).
FIGURE 4.
(A and B) Receiver-operating-characteristic curves for radiomics classifier (A) and risk model (B) for prostate cancer. (C and D) Box plots of predicted risk scores vs. overall PSMA-RADS scores (C) and post-PSMA PET therapies (D).
Risk Stratification
A prognostic risk model stratified prostate cancer patients by low- to intermediate- versus high-risk with an overall accuracy of 0.83 and an AUC of 0.86 (Fig. 4B). Risk scores derived from the model had positive correlations with overall PSMA-RADS scores (ρ = 0.44, P < 0.001) and post-PSMA PET therapies (ρ = 0.37, P < 0.001) (Figs. 4C and 4D). Risk stratifications by imaging measures, initial PSA levels, Gleason scores, risk model predictions, and the risk model predictions combined with Gleason scores were evaluated (Supplemental Fig. 3). Optimal thresholds for MTV, TLA, lesion number, SUVmean, SUVmax, and Gleason score were 22.00 cm3, 174.56 SUV⋅cm3, 10, 9.38, 38.87, and 8, respectively.
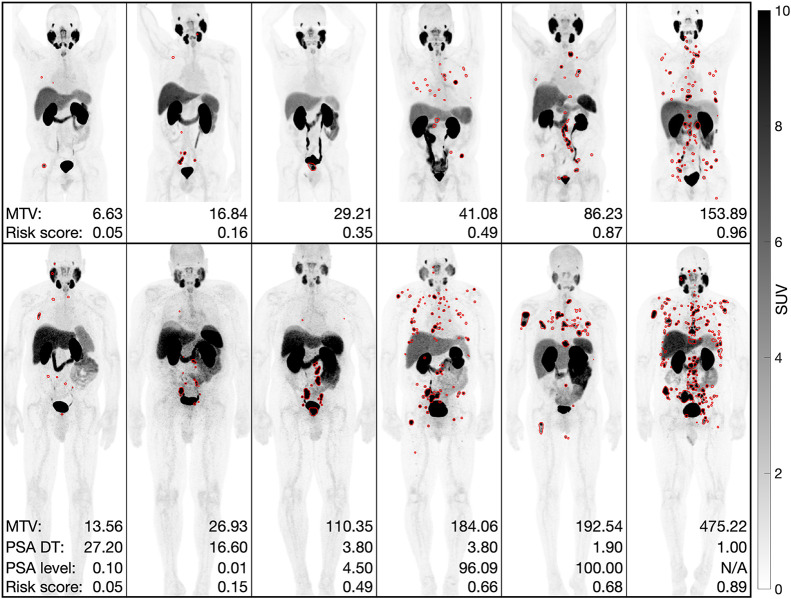
High-risk patients classified by MTV, TLA, the risk model, and the risk model combined with Gleason scores had higher follow-up PSA levels than low- to intermediate-risk patients (P < 0.05). High-risk patients classified by Gleason scores and the risk model with Gleason scores had shorter PSA doubling times than low- to intermediate-risk patients (P < 0.05). Low-, intermediate-, and high-risk patients classified by the risk model combined with Gleason scores had mean follow-up PSA levels of 9.18, 26.92, and 727.46 ng/mL and mean PSA doubling times of 8.67, 8.18, and 4.81 mo, respectively. Illustrative examples are shown in Figure 5.
FIGURE 5.
Predicted segmentations on maximum-intensity projections of PSMA PET scans of prostate cancer from datasets 1 (top row) and 2 (bottom row). MTV, PSA doubling times (DT), and follow-up PSA levels were measured in cubic centimeters, months, and ng/mL, respectively.
Survival Analysis
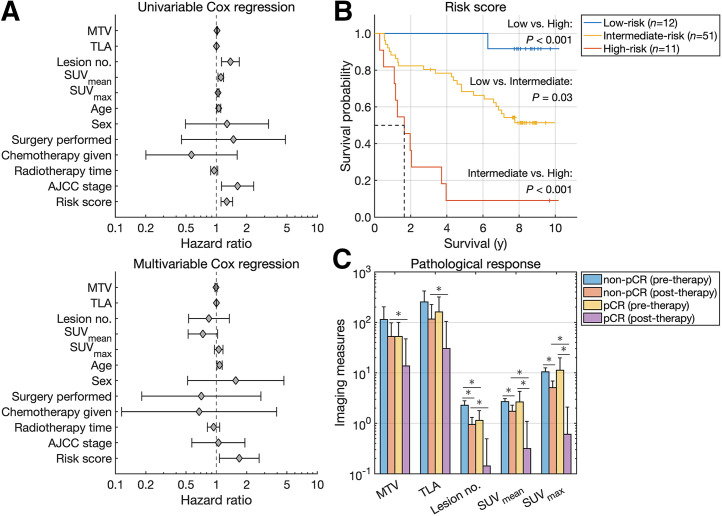
Imaging measures were extracted from 18F-FDG PET/CT scans of head and neck cancer patients. MTV (measured in cm3), TLA, SUVmean, and SUVmax were used as continuous variables in the survival analysis. MTV, TLA, lesion number, SUVmean, SUVmax, age, AJCC stage, and the risk score were significantly associated with overall survival by univariable Cox regression analysis (Fig. 6A). Age and risk score were independent prognosticators of overall survival by multivariable Cox regression analysis. The risk score yielded a C-index value of 0.71, indicating concordance between overall survival and the predicted risk scores. Hazard ratios with 95% CI and C-index values are reported in Table 2.
FIGURE 6.
(A) Forest plots of univariable and multivariable Cox regression analysis. (B) Kaplan–Meier survival curves for head and neck cancer. (C) Imaging measures quantified from pre- and posttherapy scans of breast cancer.
TABLE 2.
Cox Regression Analysis and Respective C-Index Values
| Univariable Cox regression | Multivariable Cox regression | ||||||
|---|---|---|---|---|---|---|---|
| Parameter | Hazard ratio | 95% CI | P | Hazard ratio | 95% CI | P | C index |
| MTV | 1.01 | 1.01–1.02 | <0.001 | 0.99 | 0.97–1.02 | 0.57 | 0.68 |
| TLA | 1.00 | 1.00–1.00 | <0.001 | 1.00 | 1.00–1.00 | 0.27 | 0.69 |
| Lesion no. | 1.38 | 1.13–1.69 | 0.002 | 0.84 | 0.53–1.34 | 0.47 | 0.69 |
| SUVmean | 1.11 | 1.04–1.18 | 0.002 | 0.74 | 0.53–1.03 | 0.07 | 0.65 |
| SUVmax | 1.04 | 1.02–1.06 | <0.001 | 1.06 | 0.96–1.17 | 0.27 | 0.65 |
| Age | 1.06 | 1.01–1.10 | 0.02 | 1.08 | 1.02–1.14 | 0.01 | 0.61 |
| Sex | 1.27 | 0.49–3.28 | 0.62 | 1.56 | 0.52–4.67 | 0.43 | 0.47 |
| Surgery | 1.48 | 0.45–4.83 | 0.52 | 0.71 | 0.18–2.76 | 0.62 | 0.50 |
| Chemotherapy | 0.57 | 0.20–1.61 | 0.29 | 0.67 | 0.12–3.95 | 0.66 | 0.47 |
| Radiotherapy time | 0.95 | 0.88–1.03 | 0.23 | 0.94 | 0.82–1.08 | 0.38 | 0.46 |
| AJCC stage | 1.62 | 1.12–2.34 | 0.01 | 1.05 | 0.57–1.92 | 0.88 | 0.61 |
| Risk score | 1.27 | 1.11–1.45 | <0.001 | 1.69 | 1.07–2.66 | 0.02 | 0.71 |
Stratification of patients was based on median values for all imaging measures and plotted using Kaplan–Meier estimators (Supplemental Fig. 4). For MTV, TLA, and SUVmax, patients in the upper half had a significantly shorter median overall survival (P < 0.05). Stratification of patients was based on the risk score and plotted using Kaplan–Meier estimators (Fig. 6B). High-risk patients had a shorter median overall survival than low- or intermediate-risk patients (1.64 y vs. median not reached, P < 0.001). Intermediate-risk patients had a shorter median overall survival than low-risk patients (P < 0.05).
Treatment Response Prediction
Imaging measures were extracted from pre- and posttherapy 18F-FDG PET/CT scans of breast cancer patients (Fig. 6C). Posttherapy measures were all lower for pCR than for non-pCR, indicating a higher posttherapy tumor burden for nonresponders (P < 0.05). Optimal thresholds of pretherapy measures for MTV, TLA, lesion number, SUVmean, and SUVmax were 188.96 cm3, 96.46 SUV⋅cm3, 2, 1.85, and 7.84, respectively. Accuracy metrics for predicting pCR using pretherapy measures are reported in Table 3. Classifiers trained to predict pCR using only pretherapy measures (decision tree 1) and both pre- and posttherapy measures (decision tree 2) had overall accuracies of 0.72 and 0.84, AUCs of 0.72 and 0.76, and areas under the precision-recall curve of 0.51 and 0.67, respectively.
TABLE 3.
Predicting pCR
| Model and parameter | Accuracy | AUC | Area under precision-recall curve | True-positive rate | Positive predictive value | True-negative rate | Negative predictive value |
|---|---|---|---|---|---|---|---|
| MTV | 0.42 | 0.55 | 0.28 | 1.00 | 0.32 | 0.19 | 1.00 |
| TLA | 0.67 | 0.58 | 0.30 | 0.50 | 0.42 | 0.73 | 0.79 |
| Lesion no. | 0.47 | 0.67 | 0.39 | 0.80 | 0.32 | 0.35 | 0.82 |
| SUVmean | 0.72 | 0.44 | 0.28 | 0.30 | 0.50 | 0.88 | 0.77 |
| SUVmax | 0.64 | 0.44 | 0.27 | 0.40 | 0.36 | 0.73 | 0.76 |
| Decision tree 1 | 0.72 | 0.72 | 0.51 | 0.50 | 0.50 | 0.81 | 0.81 |
| Decision tree 2 | 0.84 | 0.76 | 0.67 | 0.43 | 1.00 | 1.00 | 0.82 |
DISCUSSION
Molecular imaging modalities provide important molecular insights into the pathophysiologic processes underlying disease and are powerful tools for the detection and localization of cancer and metastases (15). Deep learning approaches have been developed for research and clinical care in nuclear medicine (7,16–21). Methods developed for narrow applications, such as image classification and segmentation, often require vast training datasets with physician-defined annotations, which are expensive to produce, subject to interreader variability, and unscalable. Accordingly, we developed a DeepSSTL approach and used it to perform fully automated whole-body tumor detection and segmentation on 18F-FDG and PSMA PET/CT images of 1,019 patients with 6 different cancer types using limited annotations. The proposed approach demonstrated accurate quantification of molecular tumor burden and prediction of risk, survivability, and treatment response. Our approach may also play a role in longitudinal tumor quantification to track whole-body tumor volume changes in response to therapy.
The approach performed domain adaptation, with source domain 18F-FDG PET/CT images of patients with lung cancer, melanoma, and lymphoma with complete manual annotations being used for training and cross-validation (Figs. 1 and 2). DeepSSTL was applied and enabled tumor segmentation on target domain PSMA PET/CT images of prostate cancer patients with incomplete annotations. Despite limited annotations, the approach yielded accurate tumor segmentation on PSMA PET/CT and achieved a high detection rate of PSMA-RADS-4/5 lesions, for which prostate cancer was highly likely, while limiting false discoveries by leveraging radiomics analysis (Fig. 3). The approach generalized across 18F-FDG– and PSMA-targeted radiotracers and performed well on external test datasets with out-of-distribution cancers not seen during training or cross-validation, including head and neck and breast cancers.
A risk model for prostate cancer using PSMA PET/CT imaging measures achieved an accuracy of 0.83 in classifying low- to intermediate- versus high-risk. Higher-risk scores were predicted for patients who received higher PSMA-RADS scores and systemic therapies, corroborating the risk model against 2 separate indications (Fig. 4). Although SUV measures and initial PSA levels were individually poor predictors of risk based on follow-up PSA levels and PSA doubling times, respectively, the risk model yielded improved performance by incorporating all molecular imaging measures, including MTV, TLA, number of lesions, SUVmean, and SUVmax (Fig. 5). Risk model predictions combined with Gleason scores were validated against follow-up PSA levels and PSA doubling times and yielded significant differences between risk groups.
A risk score for head and neck cancer incorporated 18F-FDG PET/CT imaging measures and overall AJCC staging based on tumor–node–metastasis classification. The risk score and all imaging measures were significant prognosticators of overall survival by univariable Cox regression. The risk score was a negative prognosticator of overall survival with a hazard ratio of 1.69 by multivariable Cox regression, with patients who had higher risk levels having a shorter median overall survival by Kaplan–Meier analysis (Fig. 6). Risk stratification and survival estimation were improved when imaging measures were combined with Gleason scores and AJCC staging for patients with prostate cancer and head and neck cancer, respectively, indicating synergy between molecular imaging measures and clinical, pathologic, and anatomic factors.
A classifier for breast cancer using 18F-FDG PET/CT imaging measures from pre- and posttherapy scans predicted pCR with an accuracy of 0.84. Although the classifier achieved a positive predictive value of 1.00, true-negative rate of 1.00, and negative predictive value of 0.82, the classifier had a true-positive rate of 0.43. Interestingly, predicting pCR with an optimized MTV threshold yielded a perfect true-positive rate and negative predictive value of 1.00 with an accuracy of 0.42, highlighting the trade-off between prediction strategies. A classifier using only pretherapy measures predicted pCR with an accuracy of 0.72, demonstrating the feasibility of predicting pCR to inform treatment management before neoadjuvant therapy and surgery using a small cohort of 36 patients. Larger prospective studies will be required to validate the approach.
18F-FDG PET/CT has broad utility in oncologic imaging by targeting glycolytic metabolism present in most malignancies. Many prostate cancers are not 18F-FDG–avid, and alternative imaging agents have been developed to target metabolic pathways, including 18F-fluciclovine and 11C-choline, and specific cell-surface receptors, such as PSMA (15). PSMA-targeted agents, including 18F-DCFPyL and 68Ga-PSMA-11, have demonstrated prostate cancer detection rates superior to those of conventional imaging (15).
Given the wide array of available radiotracers, artificial intelligence approaches must generalize across molecular imaging agents to support automated analysis. Indeed, our approach performed whole-body tumor quantification on 18F-FDG and PSMA PET/CT images of multiple cancers despite the differences in biodistribution between 18F-FDG and PSMA-targeted uptake patterns. A prospective study by Buteau et al. found that an SUVmean of 10 or higher on PSMA PET and an MTV lower than 200 cm3 on 18F-FDG PET were predictive biomarkers for a higher PSA response to 177Lu-PSMA therapy in metastatic castration-resistant prostate cancer (3). Interestingly, our retrospective analysis found that an SUVmean of 9.38 on PSMA PET was the optimal cutoff for prostate cancer risk stratification. That agreement, combined with the generalizability of our approach, highlights the potential utility of the proposed approach for selection of patients for PSMA-targeted radioligand therapy.
We and others have developed convolutional neural networks for tasks on PSMA PET, including classification according to the PSMA-RADS and PROMISE (Prostate Cancer Molecular Imaging Standardized Evaluation) frameworks and segmentation of intraprostatic gross tumor volume and metastases (7,22–24). Jemaa et al. proposed cascaded 2- and 3-dimensional convolutional neural networks with a U-net architecture for region-specific tumor segmentation on 18F-FDG PET/CT (25). Unlike approaches focusing on specific volumes of interest or cross-sectional slices, our approach provides fully automated whole-body PET/CT tumor quantification and lesionwise radiomics analysis to support more precise staging, disease tracking, and therapeutic monitoring. We used the state-of-the-art nnU-net architecture (6) as a backbone for our approach and achieved robust tumor quantification. nnU-net was among the top performers in the autoPET challenge for automated tumor segmentation on 18F-FDG PET/CT, with a common feature of the top algorithms being the use of a U-net backbone (26). Comparison of the performance of the proposed DeepSSTL approach to publicly available benchmarks, such as the autoPET challenge, is an important area of investigation. Another approach used nnU-net for normal-organ segmentation on 18F-FDG PET/CT (27). Our DeepSSTL approach may also incorporate multiorgan segmentation for systemic analysis and radiation dosimetry applications.
Deep learning models require training data with extensive expert annotations. That limitation is partially ameliorated by our DeepSSTL approach that learns the segmentation task on the target domain using incomplete annotations. However, our approach remains reliant on manual annotations for performance assessment, which may be confounded by inaccurate or inconsistent annotations. Consensus readings or histopathologic validation may be warranted in such scenarios. Alternatively, realistic simulated images with known ground truth may be used to assess task-based performance (17). Our approach may incorporate physician-in-the-loop continuous feedback and assist physicians by flagging potential foci of disease as a second reader.
A limitation of this study was that prostate cancer detection was evaluated on advanced PSMA-RADS-4/5 lesions and that testing on lower PSMA-RADS scores was lacking. Evaluation of indeterminant findings, such as PSMA-RADS-3, may provide further insights into the true positivity of such lesions (28). Another limitation was that the available retrospective imaging and clinical datasets were heterogeneous, dependent on cancer type. However, such heterogeneity reflects real-world clinical settings where information is often incomplete across patient cohorts. Although evaluation on independent test data is ideal, the performance of the proposed approach was evaluated via cross-validation because of the limited availability of heterogeneous datasets. All aspects of model training and hyperparameter optimization took place only on the training folds, with the hold-out test folds being used only during evaluation to provide accurate estimates of model performance. Additionally, performance estimates of predicting pCR for patients with breast cancer may be impacted by the limited data and the class imbalance between patients with pCR versus non-pCR (Table 3). Precision-recall curve metrics were reported in addition to overall accuracy and AUC to evaluate classifier performance more thoroughly in the context of such class imbalances.
CONCLUSION
The DeepSSTL approach performed fully automated, whole-body tumor segmentation on PET/CT images using limited tumor annotations and generalized across patients with 6 different cancer types imaged with 18F-FDG and PSMA-targeted radiotracers. Molecular imaging measures were automatically quantified and demonstrated prognostic value for risk stratification, survival estimation, and treatment response prediction.
ACKNOWLEDGMENT
We thank The Cancer Imaging Archive for providing data access.
KEY POINTS
QUESTION: How can we develop generalizable approaches for automated whole-body tumor quantification on PET/CT with limited manual annotations?
PERTINENT FINDINGS: Our DeepSSTL approach performed accurate tumor segmentation on the 18F-FDG and PSMA PET/CT images of 1,019 patients with 6 different cancers using incomplete annotations. The approach incorporated radiomics analysis and achieved a high tumor detection rate while minimizing false discoveries. Molecular imaging measures were automatically quantified and were predictive of risk stratification, overall survival, and treatment response.
IMPLICATIONS FOR PATIENT CARE: The developed approach reduces physician workload by providing generalizable tumor segmentation on PET/CT and automatic quantification of prognostic molecular parameters.
DISCLOSURE
Financial support was provided, in part, by National Institutes of Health grants R01CA184228, R01CA134675, P41EB024495, U01CA140204, and K99CA287045. The content of this work is solely the responsibility of the authors and does not necessarily represent the official views of the National Institutes of Health. No other potential conflict of interest relevant to this article was reported.
REFERENCES
- 1. Siegel RL, Miller KD, Wagle NS, Jemal A. Cancer statistics, 2023. CA Cancer J Clin. 2023;73:17–48. [DOI] [PubMed] [Google Scholar]
- 2. Hanna TP, King WD, Thibodeau S, et al. Mortality due to cancer treatment delay: systematic review and meta-analysis. BMJ. 2020;371:m4087. [DOI] [PMC free article] [PubMed] [Google Scholar]
- 3. Buteau JP, Martin AJ, Emmett L, et al. PSMA and FDG-PET as predictive and prognostic biomarkers in patients given [177Lu] Lu-PSMA-617 versus cabazitaxel for metastatic castration-resistant prostate cancer (TheraP): a biomarker analysis from a randomised, open-label, phase 2 trial. Lancet Oncol. 2022;23:1389–1397. [DOI] [PubMed] [Google Scholar]
- 4. Hatt M, Krizsan AK, Rahmim A, et al. Joint EANM/SNMMI guideline on radiomics in nuclear medicine. Eur J Nucl Med Mol Imaging. 2023;50:352–375. [DOI] [PMC free article] [PubMed] [Google Scholar]
- 5. Clark K, Vendt B, Smith K, et al. The Cancer Imaging Archive (TCIA): maintaining and operating a public information repository. J Digit Imaging. 2013;26:1045–1057. [DOI] [PMC free article] [PubMed] [Google Scholar]
- 6. Isensee F, Jaeger PF, Kohl SAA, Petersen J, Maier-Hein KH. nnU-Net: a self-configuring method for deep learning-based biomedical image segmentation. Nat Methods. 2021;18:203–211. [DOI] [PubMed] [Google Scholar]
- 7. Leung KH, Rowe SP, Leal JP, et al. Deep learning and radiomics framework for PSMA-RADS classification of prostate cancer on PSMA PET. EJNMMI Res. 2022;12:76. [DOI] [PMC free article] [PubMed] [Google Scholar]
- 8. Gatidis S, Hepp T, Früh M, et al. A whole-body FDG-PET/CT dataset with manually annotated tumor lesions. Sci Data. 2022;9:601. [DOI] [PMC free article] [PubMed] [Google Scholar]
- 9. Aerts HJWL, Velazquez ER, Leijenaar RTH, et al. Decoding tumour phenotype by noninvasive imaging using a quantitative radiomics approach. Nat Commun. 2014;5:4006. [DOI] [PMC free article] [PubMed] [Google Scholar]
- 10. Li X, Abramson RG, Arlinghaus LR, et al. Multiparametric magnetic resonance imaging for predicting pathological response after the first cycle of neoadjuvant chemotherapy in breast cancer. Invest Radiol. 2015;50:195–204. [DOI] [PMC free article] [PubMed] [Google Scholar]
- 11. Ashrafinia S. Quantitative Nuclear Medicine Imaging Using Advanced Image Reconstruction and Radiomics. Dissertation. The Johns Hopkins University; 2019.
- 12. Breiman L. Random forests. Mach Learn. 2001;45:5–32. [Google Scholar]
- 13. D’Amico AV, Whittington R, Malkowicz SB, et al. Biochemical outcome after radical prostatectomy, external beam radiation therapy, or interstitial radiation therapy for clinically localized prostate cancer. JAMA. 1998;280:969–974. [DOI] [PubMed] [Google Scholar]
- 14. Bland JM, Altman DG. Survival probabilities (the Kaplan-Meier method). BMJ. 1998;317:1572–1580. [DOI] [PMC free article] [PubMed] [Google Scholar]
- 15. Rowe SP, Pomper MG. Molecular imaging in oncology: current impact and future directions. CA Cancer J Clin. 2022;72:333–352. [DOI] [PMC free article] [PubMed] [Google Scholar]
- 16. Leung KH, Rowe SP, Pomper MG, Du Y. A three-stage, deep learning, ensemble approach for prognosis in patients with Parkinson’s disease. EJNMMI Res. 2021;11:52. [DOI] [PMC free article] [PubMed] [Google Scholar]
- 17. Leung KH, Marashdeh W, Wray R, et al. A physics-guided modular deep-learning based automated framework for tumor segmentation in PET. Phys Med Biol. 2020;65:245032. [DOI] [PubMed] [Google Scholar]
- 18. Leung K, Sadaghiani MS, Dalaie P, et al. A deep learning-based approach for lesion classification in 3D 18F-DCFPyL PSMA PET images of patients with prostate cancer [abstract]. J Nucl Med. 2020;61(suppl 1):527.31562225 [Google Scholar]
- 19. Leung K, Ashrafinia S, Sadaghiani MS, et al. A fully automated deep-learning based method for lesion segmentation in 18F-DCFPyL PSMA PET images of patients with prostate cancer [abstract]. J Nucl Med. 2019;60(suppl 1):399. [Google Scholar]
- 20. Leung K, Marashdeh W, Wray R, et al. A deep-learning-based fully automated segmentation approach to delineate tumors in FDG-PET images of patients with lung cancer [abstract]. J Nucl Med. 2018;59(suppl 1):323. [Google Scholar]
- 21. Leung KH, Salmanpour MR, Saberi A, et al. Using deep-learning to predict outcome of patients with Parkinson’s disease. In: 2018 IEEE Nuclear Science Symposium and Medical Imaging Conference Proceedings (NSS/MIC). IEEE; 2018:1–4.
- 22. Capobianco N, Sibille L, Chantadisai M, et al. Whole-body uptake classification and prostate cancer staging in 68Ga-PSMA-11 PET/CT using dual-tracer learning. Eur J Nucl Med Mol Imaging. 2022;49:517–526. [DOI] [PMC free article] [PubMed] [Google Scholar]
- 23. Holzschuh JC, Mix M, Ruf J, et al. Deep learning based automated delineation of the intraprostatic gross tumour volume in PSMA-PET for patients with primary prostate cancer. Radiother Oncol. 2023;188:109774. [DOI] [PMC free article] [PubMed] [Google Scholar]
- 24. Xu Y, Klyuzhin I, Harsini S, et al. Automatic segmentation of prostate cancer metastases in PSMA PET/CT images using deep neural networks with weighted batch-wise dice loss. Comput Biol Med. 2023;158:106882. [DOI] [PubMed] [Google Scholar]
- 25. Jemaa S, Fredrickson J, Carano RAD, Nielsen T, de Crespigny A, Bengtsson T. Tumor segmentation and feature extraction from whole-body FDG-PET/CT using cascaded 2D and 3D convolutional neural networks. J Digit Imaging. 2020;33:888–894. [DOI] [PMC free article] [PubMed] [Google Scholar]
- 26. Gatidis S, Früh M, Fabritius M, et al. The autoPET challenge: towards fully automated lesion segmentation in oncologic PET/CT imaging. Research Square website. https://www.researchsquare.com/article/rs-2572595/v1. Published June 14, 2023. Accessed February 9, 2024.
- 27. Shiyam Sundar LK, Yu J, Muzik O, et al. Fully automated, semantic segmentation of whole-body 18F-FDG PET/CT images based on data-centric artificial intelligence. J Nucl Med. 2022;63:1941–1948. [DOI] [PMC free article] [PubMed] [Google Scholar]
- 28. Werner RA, Hartrampf PE, Fendler WP, et al. Prostate-specific membrane antigen reporting and data system version 2.0. Eur Urol. 2023;84:491–502. [DOI] [PubMed] [Google Scholar]


