

Abstract
Background
The aim of this study was to investigate the changes of epidemic characteristics of influenza activity pre– and post–coronavirus disease 2019 (COVID-19) in Beijing, China.
Methods
Epidemiologic data were collected from the influenza surveillance system in Beijing. We compared epidemic intensity, epidemic onset and duration, and influenza transmissibility during the 2022–2023 season with pre-COVID-19 seasons from 2014 to 2020.
Results
The overall incidence rate of influenza in the 2022–2023 season was significantly higher than that of the pre-COVID-19 period, with the record-high level of epidemic intensity in Beijing. The onset and duration of the influenza epidemic period in 2022–2023 season was notably later and shorter than that of the 2014–2020 seasons. Maximum daily instantaneous reproduction number (Rt) of the 2022–2023 season (Rt = 2.31) was much higher than that of the pre-COVID-19 period (Rt = 1.49). The incidence of influenza A(H1N1) and A(H3N2) were the highest among children aged 0–4 years and 5–14 years, respectively, in the 2022–2023 season.
Conclusions
A late, intense, and short-term peak influenza activity was observed in the 2022–2023 season in Beijing. Children <15 years old were impacted the most by the interruption of influenza circulation during the COVID-19 pandemic. Maintaining continuous surveillance and developing targeted public health strategies of influenza is necessary.
Keywords: COVID-19, incidence, influenza, instantaneous reproduction number, surveillance
A late, intense, and short-term peak influenza activity was observed in the 2022–2023 season in Beijing. Children <15 years old were impacted the most by the interruption of influenza circulation during the COVID-19 pandemic.
The emergence of coronavirus disease 2019 (COVID-19) in early 2020 has resulted in stringent public health measures worldwide, such as mask-wearing, hand-washing, social distancing, universal nucleic acid testing, school closures, and restrictions on travel and mass gatherings. These measures have curbed the spread of severe acute respiratory syndrome coronavirus 2 (SARS-CoV-2) and led to a decrease in the activity of traditional respiratory infectious diseases such as influenza [1, 2]. Influenza activity was low worldwide between 2020 and 2021. However, a resurgence of influenza activity was identified in late 2021 following the gradual relaxation of COVID-19 restrictions in countries worldwide after the 2020–2021 influenza season [3]. According to data released by the World Health Organization (WHO), the global overall influenza activity in the 2022–2023 season rebounded fiercely, peaking in late 2022, and many indicators of influenza activity were above the levels seen in previous epidemics [4]. In northern China, influenza activity showed distinct seasonal patterns, typically peaking in the winter months before COVID-19 [5]. During the COVID-19 pandemic, China's “zero-COVID” strategy effectively suppressed influenza. Influenza activity during the 2020–2021 and 2021–2022 seasons was either absent or minimal compared to the periods before the COVID-19 pandemic [6, 7]. In the 2022–2023 influenza season, however, an out-of-season rebound in influenza activity was identified in China during the spring months after the relaxation of COVID-19 restriction measures in early January 2023 [8].
Beijing, the capital of China, is located in the temperate zone of northern China, and has the similar characteristics of influenza seasonality pattern of northern China [9]. During the spring months in 2023, a similar pattern of the influenza epidemic trend to that in northern China had been observed in Beijing. In this study, we aimed to quantify the changes in influenza epidemic intensity, epidemic onset and duration, and influenza transmissibility pre- and post-COVID-19 period in Beijing, and to compare the epidemiological characteristics of various influenza virus subtypes in different age groups over the 2 periods. This analysis will hopefully provide evidence to assist the optimization of medical resource allocation, vaccination strategies, and public health policies in the post-COVID-19 period.
METHODS
Influenza Surveillance Data Source
In this study, influenza-like illness (ILI) was defined as patients presenting with fever ≥38.0°C and cough or sore throat.
Influenza-like Illness Surveillance
The numbers of daily and weekly ILI consultations by age group (0–4 years, 5–14 years, 15–24 years, 25–59 years, and ≥60 years) were obtained through the Beijing Monitoring and Early Warning System for Infectious Diseases. This internet-based system is coordinated and managed by the Beijing Center for Disease Control and Prevention (BJCDC). Numbers of attendances and ILIs were entered by outpatients and emergency departments of internal medicine, fever clinics, and pediatrics of 144 secondary and tertiary sentinel hospitals in Beijing [10].
Influenza Virus Surveillance
Influenza virus surveillance data were collected from the influenza virus surveillance system of Beijing [11], which was expanded from the original 23 sentinel hospitals and 17 collaborating laboratories to 39 sentinel hospitals and 18 collaborating laboratories in February 2023. In this system, each sentinel hospital collected 10 to 20 pharyngeal swab specimens of outpatient ILI cases per week. The collected specimens were transported to collaborating laboratories for real-time reverse-transcription polymerase chain reaction testing of influenza virus subtypes/lineages. Collaborating laboratories provided BJCDC with weekly summaries of test volumes and influenza virus test results. Starting from week 39, 2015, demographic information of the subjects including birth date and sex were recorded while sampling, and was provided to BJCDC by collaborating laboratories. Thus, demographic information used for analysis in this study does not include those before week 39, 2015.
Data Collection
We defined week 27 of each year to week 26 of the following year as an influenza surveillance year in Beijing. Data of ILI surveillance and influenza virus surveillance in Beijing were collated for the period week 27, 2014 (the week ending 6 July 2014) to week 26, 2020 (the week ending 28 June 2020) and for the period week 27, 2022 (the week ending 10 July 2022) to week 26, 2023 (the week ending 2 July 2023). During an influenza surveillance year, the influenza epidemic period was regarded as an influenza season. In this study, we defined the baseline “pre-COVID-19” period as the 2014–2020 influenza seasons. As the WHO declared the COVID-19 pandemic as a Public Health Emergency of International Concern on 11 March 2020 [12], this period was selected to allow inclusion of 6 full influenza seasons of baseline data. The 2022–2023 influenza season was defined as the “post-COVID-19” period, since this period was after the zero-COVID policy was lifted around 8 January 2023 [13].
Statistical Analysis
Because influenza-like symptoms can be caused by multiple pathogens other than influenza, we multiplied the daily or weekly ILI number by the weekly influenza-positive rate to obtain the proxy measure of influenza activity (hereafter “daily/weekly ILI+”). Weekly ILI+ counts by age group were obtained by multiplying the number of weekly ILI in each age group by the weekly positive rate of influenza virus in that age group. The overall incidence rate of influenza per 100 000 population was calculated as the number of weekly ILI+ divided by the yearly population of Beijing [14] and multiplied by 100 000. Age-specified incidence was calculated as the number of weekly ILI+ by age group divided by the yearly population of different age groups and multiplied by 100 000.
To quantify the onset, duration, and intensity of influenza activity in Beijing, we used the moving epidemic method (MEM) [15, 16] to estimate epidemic threshold and 3 intensity thresholds (low, medium, and high) based on the historical weekly ILI+ data from 2014 to 2020. All weekly ILI+ data for each influenza surveillance year were included in our analysis. The week in which the weekly ILI+ value was higher than the epidemic threshold was considered the first week of the influenza epidemic for that season, and the week before the weekly ILI+ value dropped below the epidemic threshold was considered the last week. Each epidemic was classified into 1 of 4 intensity levels (low, medium, high, and very high) according to 3 intensity thresholds—which were defined as the upper limits of the 40%, 90%, and 97.5% 1-sided confidence intervals (CIs) for the geometric means of the 30 highest weekly epidemic rates in 2014–2020.
To assess the difference in influenza transmissibility between the 2 periods, we estimated the daily instantaneous reproduction number (Rt) of the 2014–2020 and 2022–2023 seasons. To reduce statistical noise from the datasets, 7-day centered moving averages of the daily ILI+ values during each influenza epidemic period were used to estimate the daily Rt of the corresponding period by using a method adapted from Cori et al [17, 18]. The serial interval was assumed to follow a gamma distribution with a mean of 2.85 days and standard deviation of 0.93 days [19].
Demographic information on ILI cases in which pharyngeal swabs were collected was entered using EpiData Version 3.1. WPS Office was used to create the datasets. Data analysis and plotting were performed using R version 4.0.3 software. Count data were interpreted as the medians, ranges, and interquartile ranges (IQRs). Only the epidemic periods of the influenza surveillance years were included in our comparative analysis. The Wilcoxon rank-sum test was used to compare 2 paired groups, and the Kruskal-Wallis test was used to compare 3 or more groups. Generalized linear model of quasi-Poisson regression was used to measure the changes in incidence rates for the general population and each age group between the 2014 and 2020 and 2022–2023 seasons using different periods (pre- or post-COVID-19) as the variable. Rate ratios (RRs) and 95% CIs were reported as the relative changes in the incidence rates between the pre-COVID-19 period and the 2020–2023 season. MEM was applied using the Moving Epidemic Method Shiny Web Application version 2.16 [20]. The EpiEstim package was used to estimate the Rt. Statistical significance was set at P < .05.
This study was approved by the institutional review board and human research ethics committee of the Beijing Center for Disease Control and Prevention.
RESULTS
General Information of Influenza Activity
During the 2014–2020 influenza seasons, a total of 2 352 153 ILI consultations were reported through the Beijing ILI surveillance system, with the annual average ILI number of 392 026. During the 2022–2023 influenza season, a total of 524 574 ILI consultations were reported.
During the 2014–2020 influenza seasons, a total of 45 174 specimens from ILI patients were collected and laboratory tested, and the average positive rate was 37.5% (16 946). Of the positive specimens, 24.3% (4117) were subtyped as influenza A(H1N1), 42.4% (7188) were influenza A(H3N2), and 33.5% (5681) were influenza B. During the 2022–2023 influenza season, a total of 8442 specimens from ILI patients were collected and laboratory tested; the average positive rate was 48.8% (4120). Of these, 47.2% (1944) were subtyped as influenza A(H1N1), 52.7% (2173) were influenza A(H3N2), and 0.1% (3) were influenza B. The characteristics of influenza viruses by subtype and by age group can be seen in Supplementary Figures 1 and 2.
Epidemic Onset and Duration
The influenza epidemic threshold of weekly ILI+ calculated by MEM was 2845.94. According to this standard, the onset weeks of epidemic periods occurred between week 47 to week 1 of the following year for 2014–2020 seasons, and the average epidemic duration of influenza was 18 weeks for the 6 seasons (range, 9–23 weeks). In the 2022–2023 season, the onset week of the epidemic period was week 8, 2023, which was notably later than that of the pre-COVID-19 period. The epidemic duration of influenza was 10 weeks in the 2022–2023 season, shorter than the average epidemic duration of the pre-COVID-19 period (Table 1). During the 2014–2020 seasons, the peak time of influenza epidemic occurred between week 51 and week 6 of the following year, with an average interval of 6 weeks (range, 5–8 weeks) from onset to peak time (Table 1). During 2022–2023, the peak time of influenza epidemic appeared in week 10, 2023, which was only 3 weeks apart from the onset week, shorter than that of the pre-COVID-19 period.
Table 1.
Time of Onset, Duration, and Peak of Influenza Epidemics, and Maximum Epidemic Intensity Levels for the Influenza Surveillance Years of 2014–2020 and 2022–2023 in Beijing, China
| Influenza Surveillance Year | Epidemic Onset (Year-Week) | Epidemic Duration (Weeks) | Maximum Peaka Time (Year-Week) | Duration From Onset to Maximum Peaka Time (Weeks) | Maximum Epidemic Intensity Level |
|---|---|---|---|---|---|
| 2014–2015 | 2014-47 | 21 | 2014-51 | 5 | Medium |
| 2015–2016 | 2016-1 | 17 | 2016-6 | 6 | Low |
| 2016–2017 | 2016-46 | 22 | 2017-1 | 8 | Low |
| 2017–2018 | 2017-48 | 15 | 2018-1 | 6 | High |
| 2018–2019 | 2018-50 | 23 | 2019-2 | 5 | High |
| 2019–2020 | 2019-49 | 9 | 2020-2 | 6 | Medium |
| 2022–2023 | 2023-8 | 10 | 2023-10 | 3 | Very high |
aMaximum value of the product of the number of weekly influenza-like illness number and weekly influenza positive rate during an influenza surveillance year.
Epidemic Intensity
During the 2022–2023 influenza season, the total number of ILI+ (308 049) was 1.87 (range, 1.09–3.28) times the annual average ILI+ number of 2014–2020 seasons (164 435 [range, 93 951–282 349]). The peak value of weekly ILI+ (77 463) was 4.25 (range, 2.06–8.31) times the average peak value of weekly ILI+ of the 2014–2020 seasons (18 226 [range, 9322–37 656]) (Figure 1A). The overall incidence rate in the 2022–2023 season was 3.35 (95% CI, 2.33–4.83) times that of the 2014–2020 seasons.
Figure 1.

Time series plot of weekly ILI+ (proxy value of influenza activity) counts for the influenza surveillance years of 2014–2020 and 2022–2023 in Beijing, China. A, Overall weekly ILI+ counts of 2 study periods. B, Weekly ILI+ counts by age group. C, Weekly ILI+ counts per 100 000 by age group. Dashed lines in (B) and (C) represent the average ILI+ count by age group of the 2014–2020 surveillance years, and solid lines represent the ILI+ count by age group of the 2022–2023 surveillance year.
The intensity thresholds of weekly ILI+ for medium, high, and very high epidemic activity by MEM were 14 543.45, 30 868.49, and 43 050.63, respectively (Supplementary Figure 3). According to this standard, the maximum epidemic intensity of the 2022–2023 season reached the very high level, while the highest epidemic intensity in 2014–2020 seasons only reached the high level (Table 1 and Figure 2).
Figure 2.

Weekly ILI+ (proxy value of influenza activity) counts and influenza epidemic intensity levels for the influenza surveillance years of 2014–2020 and 2022–2023 in Beijing, China.
Influenza Activity by Age Group
As shown in Figure 1B and 1C and Supplementary Figure 4, the changes of influenza activity before and after the COVID-19 period varied by age group. First, there were differences in the changes in epidemic intensity among age groups of the 2 study periods. As shown in Table 2, the relative increase in incidence rate was highest in the 5- to 14-year-old group (RR, 4.60 [95% CI, 3.19–6.65]), followed by the 15- to 24-year-old group (RR, 4.09 [95% CI, 2.67–6.26]), and the least in the ≥60-year-old group (RR, 1.59 [95% CI, .93–2.74]). For influenza A(H1N1) virus, the median weekly ILI+ count per 100 000 of the 2022–2023 season in each age group was significantly higher than that of the pre-COVID-19 period (Figure 3). For influenza A(H3N2), the median weekly ILI+ count per 100 000 of the 2022–2023 season in each age group except for the ≥60-year-old group was significantly higher than that of the pre-COVID-19 period (Figure 3). Second, the characteristics of the incidence rate of influenza by age group were different between the 2 study periods. During the pre-COVID-19 period, both the overall average weekly ILI+ count per 100 000 and the average weekly ILI+ count per 100 000 of influenza A(H1N1) and A(H3N2) were the highest among the 0- to 4-year-old group, and decreased with the increase of age. During the 2022–2023 season, the overall average weekly ILI+ count per 100 000 was the highest among the 5- to 14-year-old group, followed by the 0- to 4-year-old group, and lowest in the ≥60-year-old group. This result was similar to the incidence characteristics of influenza A(H3N2) by age group. For influenza A(H1N1), however, the average weekly ILI+ count per 100 000 was the highest among the 0- to 4-year-old group, followed by the 5- to 14-year-old group, and lowest in the ≥60-year-old group (Supplementary Figure 5).
Table 2.
Average Weekly Numbers of ILI+ (proxy value of influenza activity) and of ILI+ per 100 000 During the 2014–2020 and 2022–2023 Influenza Seasons in Beijing, China
| Variable | 2014–2020 Influenza Seasons | 2022–2023 Influenza Season | RR of No. of ILI+ (per 100 000) for 2022–2023 vs 2014–2020 (95% CI) | P Value | ||
|---|---|---|---|---|---|---|
| Average Weekly No. of ILI+ (Min–Max) | Average Weekly No. of ILI+ per 100 000a (Min–Max) | Average Weekly No. of ILI+ (Min–Max) |
Average Weekly No. of ILI+ per 100 000a (Min–Max) | |||
| Overall | 9220.68 (1091.44–37 655.56) | 42.12 (4.99–172.00) | 30 804.91 (3256.20–77 463.12) | 140.71 (14.87–353.82) | 3.35 (2.33–4.83) | <.001 |
| Age group, yb | ||||||
| 0–4 | 2204.07 (269.18–10 578.96) | 216.88 (26.49–1040.98) | 5241.71 (385.18–15 779.29) | 515.79 (37.90–1552.70) | 2.38 (1.57–3.64) | <.001 |
| 5–14 | 1906.30 (237.25–7672.81) | 121.01 (15.06–487.08) | 8743.77 (1026.90–21 370.30) | 555.07 (65.19–1356.62) | 4.60 (3.19–6.65) | <.001 |
| 15–24 | 1057.92 (14.78–4072.00) | 53.32 (0.74–205.24) | 4308.05 (165.51–11 911.99) | 217.13 (8.34–600.38) | 4.09 (2.67–6.26) | <.001 |
| 25–59 | 3273.80 (228.40–15 941.25) | 25.15 (1.75–122.45) | 8761.71 (505.23–22 123.67) | 67.30 (3.88–169.93) | 2.69 (1.69–4.27) | <.001 |
| ≥60 | 813.70 (20.48–3490.94) | 18.93 (0.48–81.21) | 1290.71 (139.99–3528.11) | 30.03 (3.26–82.08) | 1.59 (0.93–2.74) | .096 |
Abbreviations: CI, confidence interval; ILI+, the product of the number of weekly influenza-like illness number and weekly influenza positive rate; RR, rate ratio.
aThe total population and population by age group of Beijing used for calculations is from the seventh national population census of China.
bDue to the collection of age information on the sampling subjects for pathogen testing starting from week 39, 2015, the ILI+ data used for statistical analysis in age group do not include data prior to week 39, 2015.
Figure 3.

Weekly ILI+ (proxy value of influenza activity) counts per 100 000 comparison between pre–coronavirus disease 2019 (COVID-19) and 2022–2023 by age group for influenza A subtypes in Beijing, China. The box plots are based on weeks within epidemic duration. The central bar indicates the median weekly ILI+ counts per 100 000, and the mean is shown as red points. The lower and upper bounds of the box indicate the first and third quartiles (interquartile range [IQR]), the lower whisker extends from the first quartile to the lowest value within 1.5 × IQR of the first quartile, and the upper whisker extends from the third quartile to the highest value within 1.5 × IQR of the third quartile. P values (Wilcoxon rank-sum test) comparing median of weekly ILI+ counts per 100 000 for 2 study periods in each age group are presented at the top of each panel.
Estimated Rt of Influenza
As shown in Figure 4, both the value and the distribution of Rt of influenza appeared to be different between the 2 study periods. The maximum Rt value (2.31) of the 2022–2023 season was much higher than the average maximum Rt value (1.35 [range, 1.24–1.49]) of the pre-COVID-19 period, while the median Rt value (0.87 [IQR, 0.82–1.30]) of the 2022–2023 season was significant lower than the average median Rt value (0.98 [IQR, 0.92–1.10]) of the pre-COVID-19 period (P < .001). Time and numerical distribution of Rt value of influenza seasons can be seen in Supplementary Figures 6 and 7.
Figure 4.
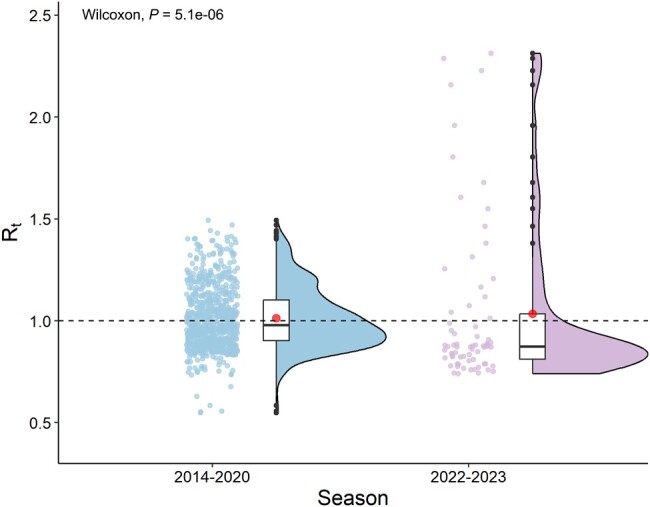
The violin plots of instantaneous reproduction number (Rt) of the 2014–2020 and 2022–2023 seasons in Beijing, China. The central bar, box, and whiskers of the box plots within the violin plots indicate the median Rt value, the interquartile range, and the minimum and maximum, respectively. The mean is shown as red points. Jitter plots indicate the distribution of Rt value. P values (Wilcoxon rank-sum test) comparing median Rt value for 2 study periods are presented at the top of each panel.
DISCUSSION
This study analyzed the changes of influenza activity in terms of the timing and intensity before and after the COVID-19 period in Beijing. The results showed that Beijing experienced an intense out-of-season epidemic in the 2022–2023 influenza season with the dominant influenza virus subtypes of A(H1N1) and A(H3N2). Age group–stratified analysis showed that the highest incidence rate was among school-aged children aged 5–14 years in the 2022–2023 season, while the highest incidence rate was among preschool children aged 0–4 years in the pre-COVID-19 period.
The out-of-season epidemic pattern of influenza during the 2022–2023 season in Beijing was typical for northern China [21]. However, this did not seem to be a global trend in terms of influenza epidemics, as the epidemic patterns varied significantly by country. Compared to other temperate countries in the Northern Hemisphere, the 2022–2023 influenza season in Beijing began much later and was more active. Surveillance reports from North American and European countries showed that the influenza activity during the 2022–2023 season peaked in late 2022, relatively earlier than it did during the pre-COVID-19 influenza seasons [22–25]. The activity levels in these countries were slightly higher than the average level before the pandemic but did not exceed the peak of the high-severity seasons. Japan and Korea, in contrast, experienced a prolonged spread of infections in the 2022–2023 season, with a record-high influenza activity in the late spring and early summer seasons [26, 27].
The variations in influenza epidemic patterns in different countries may be related to the different durations and levels of stringency of COVID-19 restrictions measures in each one. It has been shown that stricter adherence to nonpharmaceutical interventions (NPIs) or restrictions correlates with a more thorough easing of NPIs or restrictions, ultimately leading to more severe influenza rebounds [28, 29]. Beijing, following the national COVID-19 prevention and control strategy, implemented China's zero-COVID policy for about 3 years, which was longer and stricter compared to the policies of many other countries. While NPI or restriction measures suppressed COVID-19 effectively and consistently, they led to a longer interruption of the circulation of other respiratory viruses—such as the influenza virus. Low levels of long-term exposure to the influenza virus may have given rise to more susceptible individuals and caused a stronger rebound in influenza activity during the periods following the easing of COVID-19 restrictions [1, 30].
Our age-specific analysis showed a significantly higher incidence of influenza among children under the age of 14 in the 2022–2023 season with the highest incidence observed in school-aged children (5–14 years), suggesting a greater impact of the interruption of influenza circulation during the COVID-19 pandemic on children. This rebound in influenza activity among children may have been caused by a combination of multiple factors. On the one hand, the prolonged absence of influenza virus circulation can reduce a population's immunity to influenza viruses, especially among young children with few pre-COVID-19 exposures. On the other hand, school closures during the COVID-19 pandemic and the overlapping vaccination times of the COVID-19 and influenza vaccines may have led to a decline in the influenza vaccination rate among school-aged children compared to previous years. In addition, the reopening of schools and kindergartens after the relaxation of COVID-19 restrictions promoted the spread of influenza viruses among children. Furthermore, since the second semester of the 2022–2023 school year started on 13 February 2023 (the starting date of week 7) [31], coinciding with the rapidly increasing period of influenza activity, it is reasonable to presume that children may have played a dominant role in boosting the community spread of the influenza virus during its 2022–2023 epidemic wave. Studies have reported that healthy adults who work with children, or those with young children at home, are >1.5 times more likely to be exposed to influenza viruses [32–34] and that children in preschool and primary school may play important roles as driving forces of influenza epidemics in the community [35]. Müller and colleagues suggested that school-aged children might play a more critical role in the transmission network of the influenza virus than preschool-aged children [36].
By further analyzing the incidence of influenza across subtypes, we observed that the incidence of influenza A(H1N1) among children aged 0–4 years was higher than that in other age groups, both before and after the COVID-19 period. We observed that the incidence of influenza A(H3N2) was highest in children aged 5–14 years during the 2022–2023 season, rather than in children aged 0–4 years (which was the case in the pre-COVID-19 period). This may be partially explained by the findings of Ranjeva et al, which showed that protective immunity against circulating strains of influenza A viruses waned to half of its peak level 3.5–7 years following infection, and waned faster against influenza A(H3N2) than A(H1N1) [37]. In addition, the effectiveness of vaccination against influenza A(H1N1) is generally higher than that against influenza A(H3N2) [38, 39]. Therefore, the level of preexisting immunity against influenza A(H3N2) acquired through infection or vaccination may be lower than that against influenza A(H1N1) among children aged 5–14 years after the COVID-19 pandemic, resulting in a higher incidence of influenza A(H3N2) in the 5- to 14-year-old group. However, results regarding the transmissibility of influenza A(H1N1) and A(H3N2) have been inconsistent across different studies [40, 41], and the complex immune responses necessary for protection against influenza viruses are still not fully understood. Thus, further long-term surveillance and research are warranted in the future.
We estimated the Rt values for the 2014–2020 and 2022–2023 seasons, to quantitatively compare the maximum real-time transmissibility at peak times and the average transmissibility of influenza pre- and post-COVID-19 period. We observed that the estimated maximum value of Rt for the 2022–2023 season was higher than that seen in previous seasons in Beijing, whereas the median Rt value was significantly lower. Our findings quantitatively demonstrate that Beijing experienced a shorter and more intense wave of influenza epidemics during the 2022–2023 season, indicating a higher transmission potential of influenza, which suggests the need to strengthen surge capacity in the public health system in the future.
The significance of our study is that we assessed the epidemic characteristics of influenza before and after the COVID-19 period both qualitatively and quantitatively, providing comprehensive insights into the changes in influenza activity in Beijing. Our findings highlight the necessity for continuous influenza surveillance and timely assessments of influenza activity and the implementation of targeted control measures—such as improving protective measures for susceptible populations and optimizing vaccination strategies.
This study was subject to several key limitations worth noting. First, it analyzed only 1 post-COVID-19 influenza season. It is unclear whether this high-intensity spring epidemic in Beijing has sufficiently reduced the susceptible population to pre-COVID-19 levels, and how long it will take for normal winter influenza seasonality to resume. A recent modeling study predicted an increasing ILI burden over the next 3 years in both northern and southern China [42]. These findings highlight the need to prepare for potentially large influenza outbreaks in the future. Second, the study period preceding COVID-19 included the data from the 2019–2020 influenza surveillance years. To contain the COVID-19 outbreak, Beijing launched a first-level public health emergency response at the end of January 2020, which may have shortened the influenza epidemic duration and lowered the average epidemic duration in that year compared to previous ones. In addition, owing to the lack of demographic information on ILI sampled before week 39 of 2015, the results of our age-specific analysis may have been biased compared to our results for the overall population. However, the epidemiological characteristics of influenza by age group were relatively similar in each season of the pre-COVID-19 period, and our results reflect the age-specific characteristics of influenza activity in the pre-COVID-19 period. Third, our study did not analyze the epidemic intensity by different subtypes of influenza. Last, the study did not analyze the possible differences in spatial trends in influenza activity pre- and post-COVID-19 in Beijing; therefore, further exploration is warranted on this topic.
CONCLUSIONS
In conclusion, our study reported a strong rebound of influenza activity in the 2022–2023 season after the relaxation of COVID-19 restrictions in Beijing, China, characterized by an unusually late onset, much higher intensity, and shorter epidemic duration than the pre-COVID-19 period. This out-of-season epidemic pattern was typical in northern China during this season, but inconsistent with the epidemic trend internationally. Our findings suggested a greater impact of the interruption of influenza circulation during the COVID-19 pandemic on children under the age of 14, who may play a central role in boosting the spreading of influenza virus in the community in the 2022–2023 epidemic wave. Due to the uncertainty of influenza activity patterns in the post-COVID-19 era, maintaining continuous surveillance of influenza activity is very important for examining changes in periodicity and age distribution, in order to develop more targeted public health strategies such as age- and subtype-specific prevention and control measures and vaccination campaigns in the future.
Supplementary Material
Contributor Information
Li Zhang, Department of Epidemiology and Biostatistics, School of Public Health, Peking University, Beijing, China; Institute for Infectious Disease and Endemic Disease Control, Beijing Center for Disease Prevention and Control, Beijing, China.
Wei Duan, Institute for Infectious Disease and Endemic Disease Control, Beijing Center for Disease Prevention and Control, Beijing, China.
Chunna Ma, Institute for Infectious Disease and Endemic Disease Control, Beijing Center for Disease Prevention and Control, Beijing, China.
Jiaojiao Zhang, Institute for Infectious Disease and Endemic Disease Control, Beijing Center for Disease Prevention and Control, Beijing, China.
Ying Sun, Institute for Infectious Disease and Endemic Disease Control, Beijing Center for Disease Prevention and Control, Beijing, China.
Jiaxin Ma, Institute for Infectious Disease and Endemic Disease Control, Beijing Center for Disease Prevention and Control, Beijing, China.
Yingying Wang, Institute for Infectious Disease and Endemic Disease Control, Beijing Center for Disease Prevention and Control, Beijing, China.
Daitao Zhang, Institute for Infectious Disease and Endemic Disease Control, Beijing Center for Disease Prevention and Control, Beijing, China.
Quanyi Wang, Center Office, Beijing Center for Disease Prevention and Control, Beijing, China; Beijing Research Center for Respiratory Infectious Diseases, Beijing, China.
Jue Liu, Department of Epidemiology and Biostatistics, School of Public Health, Peking University, Beijing, China.
Min Liu, Department of Epidemiology and Biostatistics, School of Public Health, Peking University, Beijing, China.
Supplementary Data
Supplementary materials are available at Open Forum Infectious Diseases online. Consisting of data provided by the authors to benefit the reader, the posted materials are not copyedited and are the sole responsibility of the authors, so questions or comments should be addressed to the corresponding author.
Note
Potential conflicts of interest. All authors: No reported conflicts.
References
- 1. Qi Y, Shaman J, Pei S. Quantifying the impact of COVID-19 nonpharmaceutical interventions on influenza transmission in the United States. J Infect Dis 2021; 224:1500–8. [DOI] [PMC free article] [PubMed] [Google Scholar]
- 2. Groves HE, Piché-Renaud PP, Peci A, et al. The impact of the COVID-19 pandemic on influenza, respiratory syncytial virus, and other seasonal respiratory virus circulation in Canada: a population-based study. Lancet Reg Health Am 2021; 1:100015. [DOI] [PMC free article] [PubMed] [Google Scholar]
- 3. Our World in Data . COVID-19: stringency index. Available at: https://ourworldindata.org/explorers/coronavirus-data-explorer? uniformYAxis=0&country=USA∼ITA∼CAN∼DEU∼GBR∼FRA&hideControls=true&Interval=7-day+rolling+average&Relative+to+Population=true&Color+by+test+positivity=false&Metric=Stringency+index. Accessed 20 July 2023.
- 4. World Health Organization . Influenza update No. 411. 2022. Available at: https://www.who.int/publications/m/item/influenza-update-n-411. Accessed 21 July 2023.
- 5. Yu H, Alonso WJ, Feng L, et al. Characterization of regional influenza seasonality patterns in China and implications for vaccination strategies: spatio-temporal modeling of surveillance data. PLoS Med 2013; 10:e1001552. [DOI] [PMC free article] [PubMed] [Google Scholar]
- 6. Wang L, Guo X, Zhao N, et al. Effects of the enhanced public health intervention during the COVID-19 epidemic on respiratory and gastrointestinal infectious diseases in China. J Med Virol 2022; 94:2201–11. [DOI] [PMC free article] [PubMed] [Google Scholar]
- 7. Cao G, Guo Z, Liu J, Liu M. Change from low to out-of-season epidemics of influenza in China during the COVID-19 pandemic: a time series study. J Med Virol 2023; 95:e28888. [DOI] [PubMed] [Google Scholar]
- 8. Chinese National Influenza Center . Influenza weekly report—week 27 report. 2023. Available at: https://ivdc.chinacdc.cn/cnic/zyzx/lgzb/202307/P020230714407749442485.pdf. Accessed 20 July 2023.
- 9. Zhang L, Ma C, Duan W, et al. The role of absolute humidity in influenza transmission in Beijing, China: risk assessment and attributable fraction identification. Int J Environ Health Res 2024; 34:767–78. [DOI] [PubMed] [Google Scholar]
- 10. Yang P, Duan W, Lv M, et al. Review of an influenza surveillance system, Beijing, People's Republic of China. Emerg Infect Dis 2009; 15:1603–8. [DOI] [PMC free article] [PubMed] [Google Scholar]
- 11. Wu S, Van Asten L, Wang L, et al. Estimated incidence and number of outpatient visits for seasonal influenza in 2015–2016 in Beijing, China. Epidemiol Infect 2017; 145:3334–44. [DOI] [PMC free article] [PubMed] [Google Scholar]
- 12. Cucinotta D, Vanelli M. WHO declares COVID-19 a pandemic. Acta Biomed 2020; 91:157–60. [DOI] [PMC free article] [PubMed] [Google Scholar]
- 13. National Health Commission of the People’s Republic of China . Notification regarding the print and distribution of the protocol of managing SARS-CoV-2 infection as category B infectious diseases. The Joint Prevention and Control Mechanism of the State Council for novel coronavirus infection. 2022. Available at: http://www.nhc.gov.cn/xcs/zhengcwj/202212/e97e4c449d7a475794624b8ea12123c6.shtml. Accessed 23 July 2023.
- 14.Beijing Municipal Bureau of Statistics Survey Office of the National Bureau of Statistics in Beijing. 2020. Available at: https://nj.tjj.beijing.gov.cn/tjnj/rkpc-2020/indexch.htm. Accessed 23 July 2023.
- 15. Vega T, Lozano JE, Meerhoff T, et al. Influenza surveillance in Europe: comparing intensity levels calculated using the moving epidemic method. Influenza Other Respir Viruses 2015; 9:234–46. [DOI] [PMC free article] [PubMed] [Google Scholar]
- 16. Vega T, Lozano JE, Meerhoff T, et al. Influenza surveillance in Europe: establishing epidemic thresholds by the moving epidemic method. Influenza Other Respir Viruses 2013; 7:546–58. [DOI] [PMC free article] [PubMed] [Google Scholar]
- 17. Cori A, Ferguson NM, Fraser C, Cauchemez S. A new framework and software to estimate time-varying reproduction numbers during epidemics. Am J Epidemiol 2013; 178:1505–12. [DOI] [PMC free article] [PubMed] [Google Scholar]
- 18. Thompson RN, Stockwin JE, van Gaalen RD, et al. Improved inference of time-varying reproduction numbers during infectious disease outbreaks. Epidemics 2019; 29:100356. [DOI] [PMC free article] [PubMed] [Google Scholar]
- 19. Wallinga J, Lipsitch M. How generation intervals shape the relationship between growth rates and reproductive numbers. Proc Biol Sci 2007; 274:599–604. [DOI] [PMC free article] [PubMed] [Google Scholar]
- 20. Lozano Alonso JE. memapp: The MEM Shiny Web Application, R package version 4.1.1. 2021. Available at: https://CRAN.R-project.org/package=memapp. Accessed 25 July 2023.
- 21. Chinese National Influenza Center . China influenza weekly report as of May 11, 2023. Available at: https://ivdc.chinacdc.cn/cnic/zyzx/lgzb/202303/t20230316_264314.htm. Accessed 28 December 2023.
- 22. US Centers for Disease Control and Prevention . Influenza activity in the United States during the 2022–23 season and composition of the 2023–24 influenza vaccine. 2023. Available at: https://www.cdc.gov/flu/spotlights/2023-2024/22-23-summary-technical-report.htm. Accessed 28 December 2023.
- 23. European Centre for Disease Prevention and Control (ECDC) . Annual epidemiological report for 2023. Stockholm: ECDC; 2023. [Google Scholar]
- 24. Public Health Agency of Canada . FluWatch report: May 21, 2023 to June 17, 2023 (weeks 21 to 24). Available at: https://www.canada.ca/en/public-health/services/publications/diseases-conditions/fluwatch/2022-2023/weeks-21-24-may-21-june-17-2023.html. Accessed 26 July 2023.
- 25. UK Health Security Agency . Surveillance of influenza and other seasonal respiratory viruses in the UK, winter 2022 to 2023. 2023. Available at: https://www.gov.uk/government/statistics/annual-flu-reports/surveillance-of-influenza-and-other-seasonal-respiratory-viruses-in-the-uk-winter-2022-to-2023#conclusions Accessed 26 July 2023.
- 26. Kyodo News . Japan’s flu season yet to end due to low immunity, end of COVID rules. 2023. Available at: https://english.kyodonews.net/news/2023/05/a348052cf425-japans-flu-season-yet-to-end-due-to-low-immunity-end-of-covid-rules.html. Accessed 26 July 2023.
- 27. The Korea Times . Korea sees record-high number of flu patients for late spring. 2023. Available at: https://www.koreatimes.co.kr/www/nation/2023/06/119_352293.html. Accessed 26 July 2023.
- 28. Cohen R, Ashman M, Taha MK, et al. Pediatric Infectious Disease Group (GPIP) position paper on the immune debt of the COVID-19 pandemic in childhood, how can we fill the immunity gap? Infect Dis Now 2021; 51:418–23. [DOI] [PMC free article] [PubMed] [Google Scholar]
- 29. Han S, Zhang T, Lyu Y, et al. The incoming influenza season—China, the United Kingdom, and the United States, 2021–2022. China CDC Wkly 2021; 3:1039–45. [DOI] [PMC free article] [PubMed] [Google Scholar]
- 30. Lei H, Yang L, Yang M, et al. Quantifying the rebound of influenza epidemics after the adjustment of zero-COVID policy in China. PNAS Nexus 2023; 2:pgad152. [DOI] [PMC free article] [PubMed] [Google Scholar]
- 31. Beijing Municipal Education Commission . School calendars of all levels and types of schools for the 2022–2023 academic year. 2022. Available at: http://jw.beijing.gov.cn/xxgk/zfxxgkml/zfgkzcwj/zcqtwj/202204/t20220427_2693924.html. Accessed 28 July 2023.
- 32. Mettelman RC, Thomas PG. Human susceptibility to influenza infection and severe disease. Cold Spring Harb Perspect Med 2021; 11:a038711. [DOI] [PMC free article] [PubMed] [Google Scholar]
- 33. Huang QS, Bandaranayake D, Wood T, et al. Risk factors and attack rates of seasonal influenza infection: results of the Southern Hemisphere Influenza and Vaccine Effectiveness Research and Surveillance (SHIVERS) seroepidemiologic cohort study. J Infect Dis 2019; 219:347–57. [DOI] [PMC free article] [PubMed] [Google Scholar]
- 34. Root ED, Agustian D, Kartasasmita C, Uyeki TM, Simões EAF. Demographic and ecological risk factors for human influenza A virus infections in rural Indonesia. Influenza Other Respir Viruses 2017; 11:425–33. [DOI] [PMC free article] [PubMed] [Google Scholar]
- 35. Mimura S, Kamigaki T, Takahashi Y, et al. Role of preschool and primary school children in epidemics of influenza A in a local community in Japan during two consecutive seasons with A(H3N2) as a predominant subtype. PLoS One 2015; 10:e0125642. [DOI] [PMC free article] [PubMed] [Google Scholar]
- 36. Müller NF, Wüthrich D, Goldman N, et al. Characterising the epidemic spread of influenza A/H3N2 within a city through phylogenetics. PLoS Pathog 2020; 16:e1008984. [DOI] [PMC free article] [PubMed] [Google Scholar]
- 37. Ranjeva S, Subramanian R, Fang VJ, et al. Age-specific differences in the dynamics of protective immunity to influenza. Nat Commun 2019; 10:1660. [DOI] [PMC free article] [PubMed] [Google Scholar]
- 38. Okoli GN, Racovitan F, Abdulwahid T, Righolt CH, Mahmud SM. Variable seasonal influenza vaccine effectiveness across geographical regions, age groups and levels of vaccine antigenic similarity with circulating virus strains: a systematic review and meta-analysis of the evidence from test-negative design studies after the 2009/10 influenza pandemic. Vaccine 2021; 39:1225–40. [DOI] [PubMed] [Google Scholar]
- 39. Belongia EA, Simpson MD, King JP, et al. Variable influenza vaccine effectiveness by subtype: a systematic review and meta-analysis of test-negative design studies. Lancet Infect Dis 2016; 16:942–51. [DOI] [PubMed] [Google Scholar]
- 40. Dai H, Zhou N, Chen M, et al. Assess transmissibility of different influenza subtypes: based on a SEIABR model. Infect Genet Evol 2022; 103:105319. [DOI] [PubMed] [Google Scholar]
- 41. Park JE, Ryu Y. Transmissibility and severity of influenza virus by subtype. Infect Genet Evol 2018; 65:288–92. [DOI] [PubMed] [Google Scholar]
- 42. Liu X, Peng Y, Chen Z, et al. Impact of non-pharmaceutical interventions during COVID-19 on future influenza trends in mainland China. BMC Infect Dis 2023; 23:632. [DOI] [PMC free article] [PubMed] [Google Scholar]
Associated Data
This section collects any data citations, data availability statements, or supplementary materials included in this article.