

Abstract
Apart from their diagnostic, monitoring, or prognostic utility in clinical settings, molecular biomarkers may be instrumental in understanding the pathophysiology of psychiatric disorders, including schizophrenia. Using untargeted metabolomics, we recently identified eight cerebrospinal fluid (CSF) metabolites unique to first-episode psychosis (FEP) subjects compared to healthy controls (HC). In this study, we sought to investigate the CSF proteomic signatures associated with FEP. We employed 16-plex tandem mass tag (TMT) mass spectrometry (MS) to examine the relative protein abundance in CSF samples of 15 individuals diagnosed with FEP and 15 age-and-sex-matched healthy controls (HC). Multiple linear regression model (MLRM) identified 16 differentially abundant CSF proteins between FEP and HC at p < 0.01. Among them, the two most significant CSF proteins were collagen alpha-2 (IV) chain (COL4A2: standard mean difference [SMD] = −1.12, p = 1.64 × 10⁻⁴) and neuron-derived neurotrophic factor (NDNF: SMD = −1.03, p = 4.52 × 10⁻⁴) both of which were down-regulated in FEP subjects compared to HC. We also identified several potential CSF proteins associated with the pathophysiology and the symptom profile and severity in FEP subjects, including COL4A2, NDNF, hornerin (HRNR), contactin-6 (CNTN6), voltage-dependent calcium channel subunit alpha-2/delta-3 (CACNA2D3), tropomyosin alpha-3 chain (TPM3 and TPM4). Moreover, several protein signatures were associated with cognitive performance. Although the results need replication, our exploratory study suggests that CSF protein signatures can be used to increase the understanding of the pathophysiology of psychosis.
Keywords: First-episode psychosis, Schizophrenia, Cerebrospinal fluid, Proteomics
1. Introduction
First-episode psychosis (FEP) refers to the first occurrence of a psychotic episode, which typically includes symptoms such as hallucinations, delusions, disorganized thinking, and abnormal behavior (Kahn and Sommer, 2015). Long-term observational studies have identified significantly varying outcomes in individuals experiencing FEP (Morgan et al., 2014; Lally et al., 2017). Variable courses of illness may follow FEP, with some developing a chronic psychotic disorder such as SCZ (Drake et al., 2020), while others may have remission of symptoms or experience a less severe and episodic course.
The etiology and pathogenesis of psychosis remain a topic of ongoing research, and a comprehensive understanding has not yet been achieved. Existing knowledge strongly indicates that genetics, environmental factors (such as prenatal complications, childhood adversity, and urban upbringing), substance abuse, or neurodevelopmental abnormalities play a role in its emergence (Tsuang et al., 2004; Do et al., 2009; Brown et al, 2011; Murray et al., 2013; Fisar, 2023). The lack of reliable biomarkers leads to delays in diagnosis and complicates disease stratification, the selection of appropriate treatments, and the ability to forecast outcomes (Weickert et al., 2013). Thus, identifying biomarkers associated with FEP is critical for early diagnosis of psychotic disorders and preventing further cognitive deterioration.
Recently, we identified differences in eight metabolites in the CSF samples of individuals diagnosed with FEP compared to healthy subjects using untargeted metabolomics (Shang et al., 2022). Despite the clinical relevance of CSF in the neuropathophysiology of psychiatric disorders, only a few studies have been performed on CSF to investigate FEP (Paval et al., 2023). With recent technological advancements in proteomic analysis, CSF proteomics has been employed in various neurological and psychiatric disorders to gain insights into the underlying pathophysiology and to identify potential biomarkers (Baloyianni and Tsangaris, 2009; English et al., 2011; Focking et al., 2015; Comes et al., 2018).
In this study, we utilized 16-plex tandem mass tag (TMT) labeling to perform global proteomic analyses on CSF samples collected from FEP and healthy controls (HC) to identify protein biomarkers associated with FEP and the severity of psychosis symptoms.
2. Methods
2.1. Study subjects and enrollment
This study has been approved by the Stockholm Regional Ethics Committee (Dnr 2010/879-31/1) at Karolinska Institutet, Karolinska University Hospital, Stockholm, Sweden. The recruitment for study subjects began in January 2011. FEP and HC subjects were recruited from within the Karolinska Schizophrenia Project (KaSP) that recruits at four psychiatric clinics in Stockholm City Council in Stockholm, Sweden (Psykiatri Nordväst, Norra Stockholms Psykiatri, Södra Stockholms Psykiatri, and PRIMA Vuxenpsykiatri). The project was conducted according to the Declaration of Helsinki; all participants have given written informed consent before any study procedures.
At enrollment, FEP patients were diagnosed by a board-certified psychiatrist or a psychiatrist in training to have fulfilled the Diagnostic and Statistical Manual of Mental Disorders, fourth edition (DSM-IV) criteria for SCZ, schizophreniform psychosis, psychosis not otherwise specified, or a brief psychotic episode. Exclusion criteria included neurological or severe somatic illnesses, major brain abnormalities (confirmed by magnetic resonance imaging [MRI]), co-existing neurodevelopmental abnormalities (e.g., autism spectrum disorder), and illegal substance abuse history or recent use of illegal substances confirmed by a urine test. HC subjects were recruited by advertisements and were deemed healthy based on medical history, clinical examinations, routine laboratory blood and urine tests, and brain MRIs. HC subjects underwent a similar psychiatric evaluation as the FEP subjects. Exclusion criteria included previous and current psychiatric illnesses, psychotic illness in first-degree relatives, and previous or recent use of illegal substances, including cannabis, evaluated by the Alcohol Use Disorders Identification Test (AUDIT) and the Drug Use Disorders Identification Test (DUDIT). No control subjects were on medications at the time of the study. Psychotic symptoms in patients were evaluated using the Positive and Negative Syndrome Scale for Schizophrenia (PANSS) and the Global Assessment of Functioning (GAF) scale. PANSS and GAF scores were obtained based on a clinical interview, including reports from the family. The Mini-International Neuropsychiatric Interview (MINI) was used to exclude previous or current psychiatric illnesses in the HC subjects.
For this study, we selected CSF samples from 15 FEP and 15 HC subjects matched by age and sex (Table 1). As we published recently (Shang et al., 2022), among 25 FEP and 21 HC subjects who had CSF samples available for proteomics, we carefully selected 16 subjects for each group to match age, sex, and history of medication. Another reason was to avoid varying number of samples run in 16-plex tandem mass tag (TMT) mass spectrometry (MS) experiment, hence, limiting our sample size to 16. Subsequently, we ran 16-plex TMT labeled MS experiments for 16 FEP subjects and 16 HC subjects. Due to limited number of channels per run, samples were separated into two batches for processing, with balanced numbers of subjects from each subject group. A HC sample and a FEP sample were excluded from analysis due to exceptionally low protein levels, resulting in 15 samples for each group. Among 15 FEP subjects, eight FEP subjects had received same psychotropic medication olanzapine before CSF sampling, with one of them also treated with haloperidol. The rest of the FEP subjects had not used any antipsychotic treatment before CSF sampling and were considered antipsychotic naïve. No subjects were on antidepressants before CSF sampling.
Table 1.
Subject demographics and clinical characteristics.
| HC | FEP | p-value | |
|---|---|---|---|
| n | 15 | 15 | - |
| Age (years); mean (SD) | 26.5 (6.3) | 27.5 (6.6) | 0.675 |
| Sex (males); n (%) | 8 (53.3%) | 7 (46.7%) | 1.000 |
| Body mass index; mean (SD) | 22.9 (2.5) | 22.3 (3.0) | 0.512 |
| Nicotine use; n (%) | 1 (6.3%) | 3 (18.8%) | 0.600 |
| Duration of Untreated Psychosis (months); median (range) | - | 12 (1 – 48) | - |
| Antipsychotics; n (%) | - | 8 (53.3%) | - |
| Olanzapine | - | 8 (53.3%) † | - |
| Haloperidol | - | 1 (6.7%) † | - |
| Antidepressants; n (%) | - | 0 (0.0%) | - |
HC, healthy control subjects; FEP, first-episode psychosis subjects.
One subject took both olanzapine and haloperidol.
p-values for the difference in sex and nicotine use were calculated with the Fisher’s exact test.
2.2. Cerebrospinal fluid (CSF) collection
CSF sampling was performed using standard lumbar puncture protocols. Briefly, a disposable atraumatic spinal needle (22G Sprotte, Geisingen, Germany) was inserted into the subdural space at the level of L4-5 interspinous ligament with all individuals in the right decubitus position. CSF (18 mL) was allowed to drip into a polypropylene test tube, protected from light. CSF samples were gently inverted before centrifugation at 3500 rpm for 10 min at 4°C (Sigma 5810R, Eppendorf, Hamburg, Germany) to separate cells and supernatant. The supernatant from all subjects was aliquoted and frozen at −80 °C within 1 h of sampling.
2.3. CSF proteomic analysis
Mayo Clinic Proteomics Core performed 16-plex tandem mass tag (TMT) labeling with liquid chromatography-tandem mass spectrometry. CSF samples were divided into two batches; one included 16 samples (8 FEP and 8 HC subjects), and the other included 14 samples (7 FEP and 7 HC subjects).
2.3.1. CSF sample processing
The protein concentration for each CSF sample was determined using the Pierce BCA protein assay kit, and the volumes corresponding to 200 μg were transferred to 1.5 mL tubes and dried on a spinning vacuum concentrator. The proteins were solubilized in 8 M urea/50 mM Tris pH 8.2 with intermittent sonication and vortexing until solutions were clear, then reduced with 10 mM TCEP at 60°C for 20 min, followed by alkylation with 5 mM iodoacetamide at room temperature in the dark for 30 min. An additional 500 μL of 50 mM Tris pH 8.2 was added to dilute the urea to 0.8 M, and 7 μg of Promega trypsin was added and incubated at 37°C overnight. The digest mixture was acidified using 10% trifluoroacetic acid (TFA) and desalted using the Agilent Bravo C18 cartridges, and the eluted peptides were lyophilized.
2.3.2. Tandem Mass Tag (TMT) labeling of CSF peptides
The dried peptides were solubilized in 100 μL of 100 mM triethylammonium bicarbonate (TEAB), pH 8.5, and each sample was mixed with 500 μg of a unique TMTpro reagent (Thermo Scientific) solubilized in 20 μL of acetonitrile. After incubation for 1 h at room temperature, the reactions were quenched with 5 μL of 5% hydroxylamine, and a 2 μL aliquot from each sample was pooled and analyzed by tandem mass spectrometry to verify the TMTpro labeling efficiency was greater than 98%. The samples were then pooled by volume to match the reporter ion intensities from each sample channel. The final mix was acidified with 10% TFA and diluted to 4 mL in 0.1% TFA/5% acetonitrile. The mix was desalted to remove excess TMTpro reagents by solid phase extraction with a Waters Sep Pak Plus C18 cartridge, and the eluted TMTpro-labeled peptides were lyophilized.
2.3.3. Basic pH high-performance liquid chromatography (HPLC) fractionation
To reduce the sample complexity, we used the dried peptide mixture solubilized in 500 μL 10 mM ammonium formate, pH 8.5, and separated into 96 fractions using a Dionex Ultimate 3000 RS HPLC system with a Waters XBridge BEH C18 4.6 mm x 250 mm column. The system was set up with 10 mM ammonium formate, pH 8.5 in water for the A solvent, and 10 mM ammonium formate, pH 8.5/90% acetonitrile for the B solvent. The separation gradient was 5%B to 60%B over 60 min, followed by a 2-min jump to 80%B while maintaining a constant flow rate of 0.5 mL/min. The 96 fractions were concatenated into 24 fractions and lyophilized.
2.3.4. NanoLC-tandem mass spectrometry data acquisition
The TMTpro labeled peptide fractions were analyzed by nanoLC-tandem mass spectrometry using a Thermo Scientific Orbitrap Lumos mass spectrometer coupled to a Thermo Ultimate 3000 RSLCnano HLPC system with 0.1% formic acid in 98% water/2% acetonitrile for the A solvent and 0.1% formic acid in 80% acetonitrile/10% isopropanol/10% water for the B solvent. Each fraction was solubilized in 0.1% formic acid and pumped onto a PepMap 300 μm x 5 mm trap (ThermoScientific) with 0.1% formic acid/0.05%TFA at an 8 μL/min flow rate. The trap was placed in line with a 75 μm x 50 cm EasySpray C18 column, and the peptides were separated with a gradient of 5%B to 30%B over 86 min, then a jump to 80%B over 15 min at a flow rate of 300 nL/min. The Orbitrap Lumos was set for data-dependent acquisition with a 3 sec cycle time. The MS1 survey scan range was from 350-1700 m/z (mass/charge) at resolution 120,000 (at 200 m/z), and the AGC was set to allow up to 2 x10⁶ ions with a 50 ms maximum ion inject time. Ions with positive charge state from 2-6 were sequentially selected for high energy collisional dissociation (HCD) fragmentation MS/MS scans at resolution 50,000 with a normalized collision energy (NCE) setting of 35 eV and the isolation width set to 0.7 m/z. The MS2 AGC setting was 200% (2 x10⁵ ions), and the max ion injection time was set at 120 ms. The dynamic exclusion feature was used to prevent ions selected for MS2 and any ions within an m/z of 7 ppm from being selected for fragmentation for 30 sec.
2.3.5. Protein identification and TMTpro quantitation
The mass spectrometry raw data files were searched with Andromeda against the SwissProt human database (ver. 2020_06) in MaxQuant (ver1.6.7), set up for MS2 reporter ion quantification with TMTpro 16plex isobaric labels. Parameters were set for full trypsin specificity with oxidized Met, and N-term protein acetylation allowed as variable modifications and carbamidomethyl cysteine as a fixed modification. Mass tolerances were set at 4.5 ppm for MS1 and 20 ppm for MS2, with the protein identification criteria requiring a one-peptide minimum filtered at a 1% false discovery rate (FDR) at the peptide and protein levels. Protein TMT quantitation was performed using an in-house R-script to calculate fold-change and p-values. Reporter ion channel correction factors were applied to PSMs and filtered to exclude peptides exceeding the threshold maximum of 50% isolation interference. Sample groups missing 50% of values were removed for comparisons with no imputation applied. Sample normalization was by median subtraction and t-test comparisons with protein level log2 ratios. Data files are available in the PRIDE repository ID number PXD044369.
2.3.6. Data normalization
The mass spectrometer randomly chooses MS2 scans for every peptide. Sampling intensities depend on the peptide concentration at the time of MS2 sequencing. Therefore, we employed an internal reference scaling (IRS) method (Wilmarth, 2019) to normalize data from the two experimental batches (Fig. S1). In this method, reporter ion intensities of proteins between various TMT experiments were normalized using shared, pooled internal standards. Also, this method prevented the calculation of relative intensity metrics like ratios or percentages inside each TMT experiment and permitted the preservation of individual intensity-scale readings. Reference values for each protein were created by averaging the triplicate summed reporter ion readings for each protein in the common pool channels for each TMT experiment. Following the geometric mean calculation of the three reference values for each protein in each TMT experiment, scaling factors were determined for each protein to convert its reference value to the geometric mean value. The sum of reporter ion intensities for each protein in the remaining experimental samples in each TMT experiment was then adjusted using these scaling parameters.
2.4. Statistical analysis
Subject demographics and clinical characteristics were compared between subject groups by Student’s t-test (for continuous variables) and Fisher’s exact test (for categorical variables) using SPSS Statistics 25 (IBM, Armonk, NY, USA). We performed hierarchical clustering by Ward’s method to examine whether the top proteins differing between subject groups at p < 0.01 might be associated with age, sex, and/or antipsychotic use (in the FEP group only). ClustVis (Metsalu and Vilo, 2015) was used with Euclidean distance as the measure of dissimilarity and k = 2 clusters for unsupervised clustering.
Age, sex, body mass index (BMI), and use of antipsychotics were considered potential confounders to affect the difference of the investigated CSF proteins between FEP and HC subjects. As such, we used multiple linear regression models (MLRMs) in the 'stats' package in R (version 4.0.3) to control for these covariates when testing for the association between protein abundance and FEP. Specifically, protein abundance was set as the dependent variable, whereas the study group (FEP vs. HC), with covariates age, sex, BMI, and/or use of antipsychotics, were considered as independent variables. Among all covariates that could compose the MLRM, only those whose coefficients passed a statistical significance threshold (p < 0.05) were considered significantly associated with protein abundance. This same approach involving MLRMs was used to identify CSF proteins associated with the PANSS total score, the GAF symptom score, and the GAF function score. Multiple hypothesis correction was not applied for this analysis in addition to the covariate adjustment because of the exploratory nature of the study.
3. Results
3.1. Subject demographics and clinical characteristics
Table 1 summarizes the demographics and clinical characteristics of the study subjects. There was no significant difference in age (p = 0.675) or sex (p = 1.000) between the FEP and HC groups. No significant between-group associations were found with body mass index (BMI; p = 0.512) nor with the frequency of subjects using nicotine (p = 0.600). The range of untreated psychosis duration widely varied among FEP subjects from 1 to 48 months with a median of 12 months.
3.2. CSF proteome differences between FEP and HC
Fig. 1A shows the number of proteins identified in the two batches. After data merging and normalization, a total of 1888 proteins were detected, of which 197 proteins were found in only one of the two batches, and 1691 proteins were detected in both batches. We excluded 24 un-named proteins and 17 keratin proteins, leaving 1650 proteins for further consideration in our downstream analyses (Table S1). A heatmap of the top differentially abundant proteins between FEP and HC at p < 0.01 is shown in Fig. 1B. The relative intensities of these proteins did not appear to be clustered by sex (both subject groups) or by antipsychotics use (FEP group only), suggesting that these factors did not drive the between-group differences.
Fig. 1.

Overview of the proteomic differences in the cerebrospinal fluid of first-episode psychosis (FEP) and healthy control (HC) subjects. (A) The numbers of proteins that were initially detected in the proteomic analysis and those that were finally included in the between-group analysis after considering detection in both experimental batches and exclusion criteria. (B) Heatmap of the top differentially abundant proteins between FEP and HC subjects at p < 0.01. The dendrogram shows hierarchical clustering based on Euclidean distance. z-score of relative protein abundances is shown. Note that no apparent clustering is observed by sex in both groups and by antipsychotic use among FEP subjects. Abbreviations: COL4A2: Collagen alpha-2 (IV) chain; NDNF: Neuron derived neurotrophic factor; GALNT10: Polypeptide N-acetylgalactosaminyltransferase 10; HRNR: Hornerin; CNTN6: Contactin-6; DSP: Desmoplakin; CNDP1: Beta-Ala-His dipeptidase; TIMP4: Metalloproteinase inhibitor 4; BTD: Biotinidase; NETO1: Neuropilin and tolloid-like protein 1; SEMA3G: Semaphorin-3G; CACNA2D3: Voltage-dependent calcium channel subunit alpha-2/delta-3; TPM3, TPM4: Tropomyosin alpha-3 chain; COL23A1: Collagen alpha-1 (XXIII) chain; IGHV2-70: Immunoglobulin heavy variable 2-70; HEPH: Hephaestin.
Based on our statistical approach with linear regression modeling, we found 16 proteins differentially abundant between groups at p < 0.01, as shown in Fig. 2. Ten proteins were of higher abundance in FEP than HC subjects, and six were of lower abundance. These include collagen alpha-2 (IV) chain (COL4A2; standardized mean difference [SMD] = −1.123, p = 1.64 × 10⁻⁴), neuron-derived neurotrophic factor (NDNF; SMD = −1.026, p = 1.31 × 10⁻⁴), hornerin (HRNR; SMD = 0.922, p = 1.31 × 10⁻³), contactin-6 (CNTN6; SMD = −0.911, p = 1.55 × 10⁻³), voltage-dependent calcium channel subunit alpha-2/delta-3 (CACNA2D3; SMD = 0.739, p = 7.88 × 10⁻³), tropomyosin alpha-3 chain (TPM3 and TPM4; SMD = 0.726, p = 8.94 × 10⁻³).
Fig. 2.

Box plots of top differentially abundant proteins between first-episode psychosis (FEP) and healthy control (HC) subjects after adjusting for covariates (age, sex, body mass index, and antipsychotic use) at p < 0.01. Blue boxes represent HC, while red boxes represent FEP subjects. Each box’s lower and upper ends represent the 25th and 75th percentiles, respectively; the horizontal line within each box represents the median; the upper and lower whiskers indicate the 75th percentile + 1.5*Interquartile range (IQR) and the 25th percentile - 1.5*IQR, respectively. The Y-axis represents batch-normalized protein intensities in arbitrary units (a.u.). Abbreviations: COL4A2: Collagen alpha-2 (IV) chain; NDNF: Neuron derived neurotrophic factor; GALNT10: Polypeptide N-acetylgalactosaminyltransferase 10; HRNR: Hornerin; CNTN6: Contactin-6; DSP: Desmoplakin; CNDP1: Beta-Ala-His dipeptidase; TIMP4: Metalloproteinase inhibitor 4; BTD: Biotinidase; NETO1: Neuropilin and tolloid-like protein 1; SEMA3G: Semaphorin-3G; CACNA2D3: Voltage-dependent calcium channel subunit alpha-2/delta-3; TPM3, TPM4: Tropomyosin alpha-3 chain; COL23A1: Collagen alpha-1 (XXIII) chain; IGHV2-70: Immunoglobulin heavy variable 2-70; HEPH: Hephaestin.
In total, we found 72 proteins to be differentially abundant between subject groups at p < 0.05 (Table S1); of which 35 were upregulated, and 37 were downregulated in FEP subjects compared to HC. It may also be noted that when not adjusting for potential confounders, 84 proteins were found to be differentially abundant between subject groups at p < 0.05 (Table S1). This means that there are some confounding effects caused by other covariates besides class label, such as the use of antipsychotics, the p-value for reelin (RELN) changed from p = 8.26 × 10⁻³ to p = 8.73 × 10⁻² (Table S1).
3.3. Proteins associated with psychosis symptom severity assessments
Fig. 3 shows the correlations between protein abundance, symptom profiling, and severity in FEP (PANSS total score, GAF symptoms score, and GAF function score) in FEP subjects. The figure shows only the top six proteins for each score; see Table S2 for the complete list. PANSS total score was correlated with 60 proteins at p < 0.05 (linear regression modeling). When finding correlation between baseline PANSS total scores and the identified CSF proteins in all FEP subjects, COL4A2 had the strongest correlation (Spearman’s ρ = 0.76, p = 5.61 × 10⁻⁴), which also showed between-group differences at p < 0.01 (Fig. 3A). GAF symptom and GAF function scores were significantly correlated with 34 and 96 proteins (p < 0.05, linear regression modeling), respectively. Notably, neudesin neurotrophic factor (NENF) and transforming growth factor beta-1 proprotein (TGFB1) were positively correlated with both GAF symptoms scores (NENF: Spearman’s ρ = 0.60, p = 1.24 × 10⁻³; TGFB1: Spearman’s ρ = 0.54, p = 5.63 × 10⁻³) and GAF functioning scores (NENF: Spearman’s ρ = 0.20, p = 1.24 × 10⁻³; TGFB1: Spearman’s ρ = 0.86, p = 5.63 × 10⁻³; Fig. 3B and 3C). On the other hand, DCC netrin 1 receptor (DCC) was negatively correlated with both GAF symptoms score (Spearman’s ρ = −0.57, p = 8.52 × 10⁻³; Fig. 3B) and GAF function score (Spearman’s ρ = −0.36, p = 9.88 × 10⁻⁶; Fig. 3C).
Fig. 3.
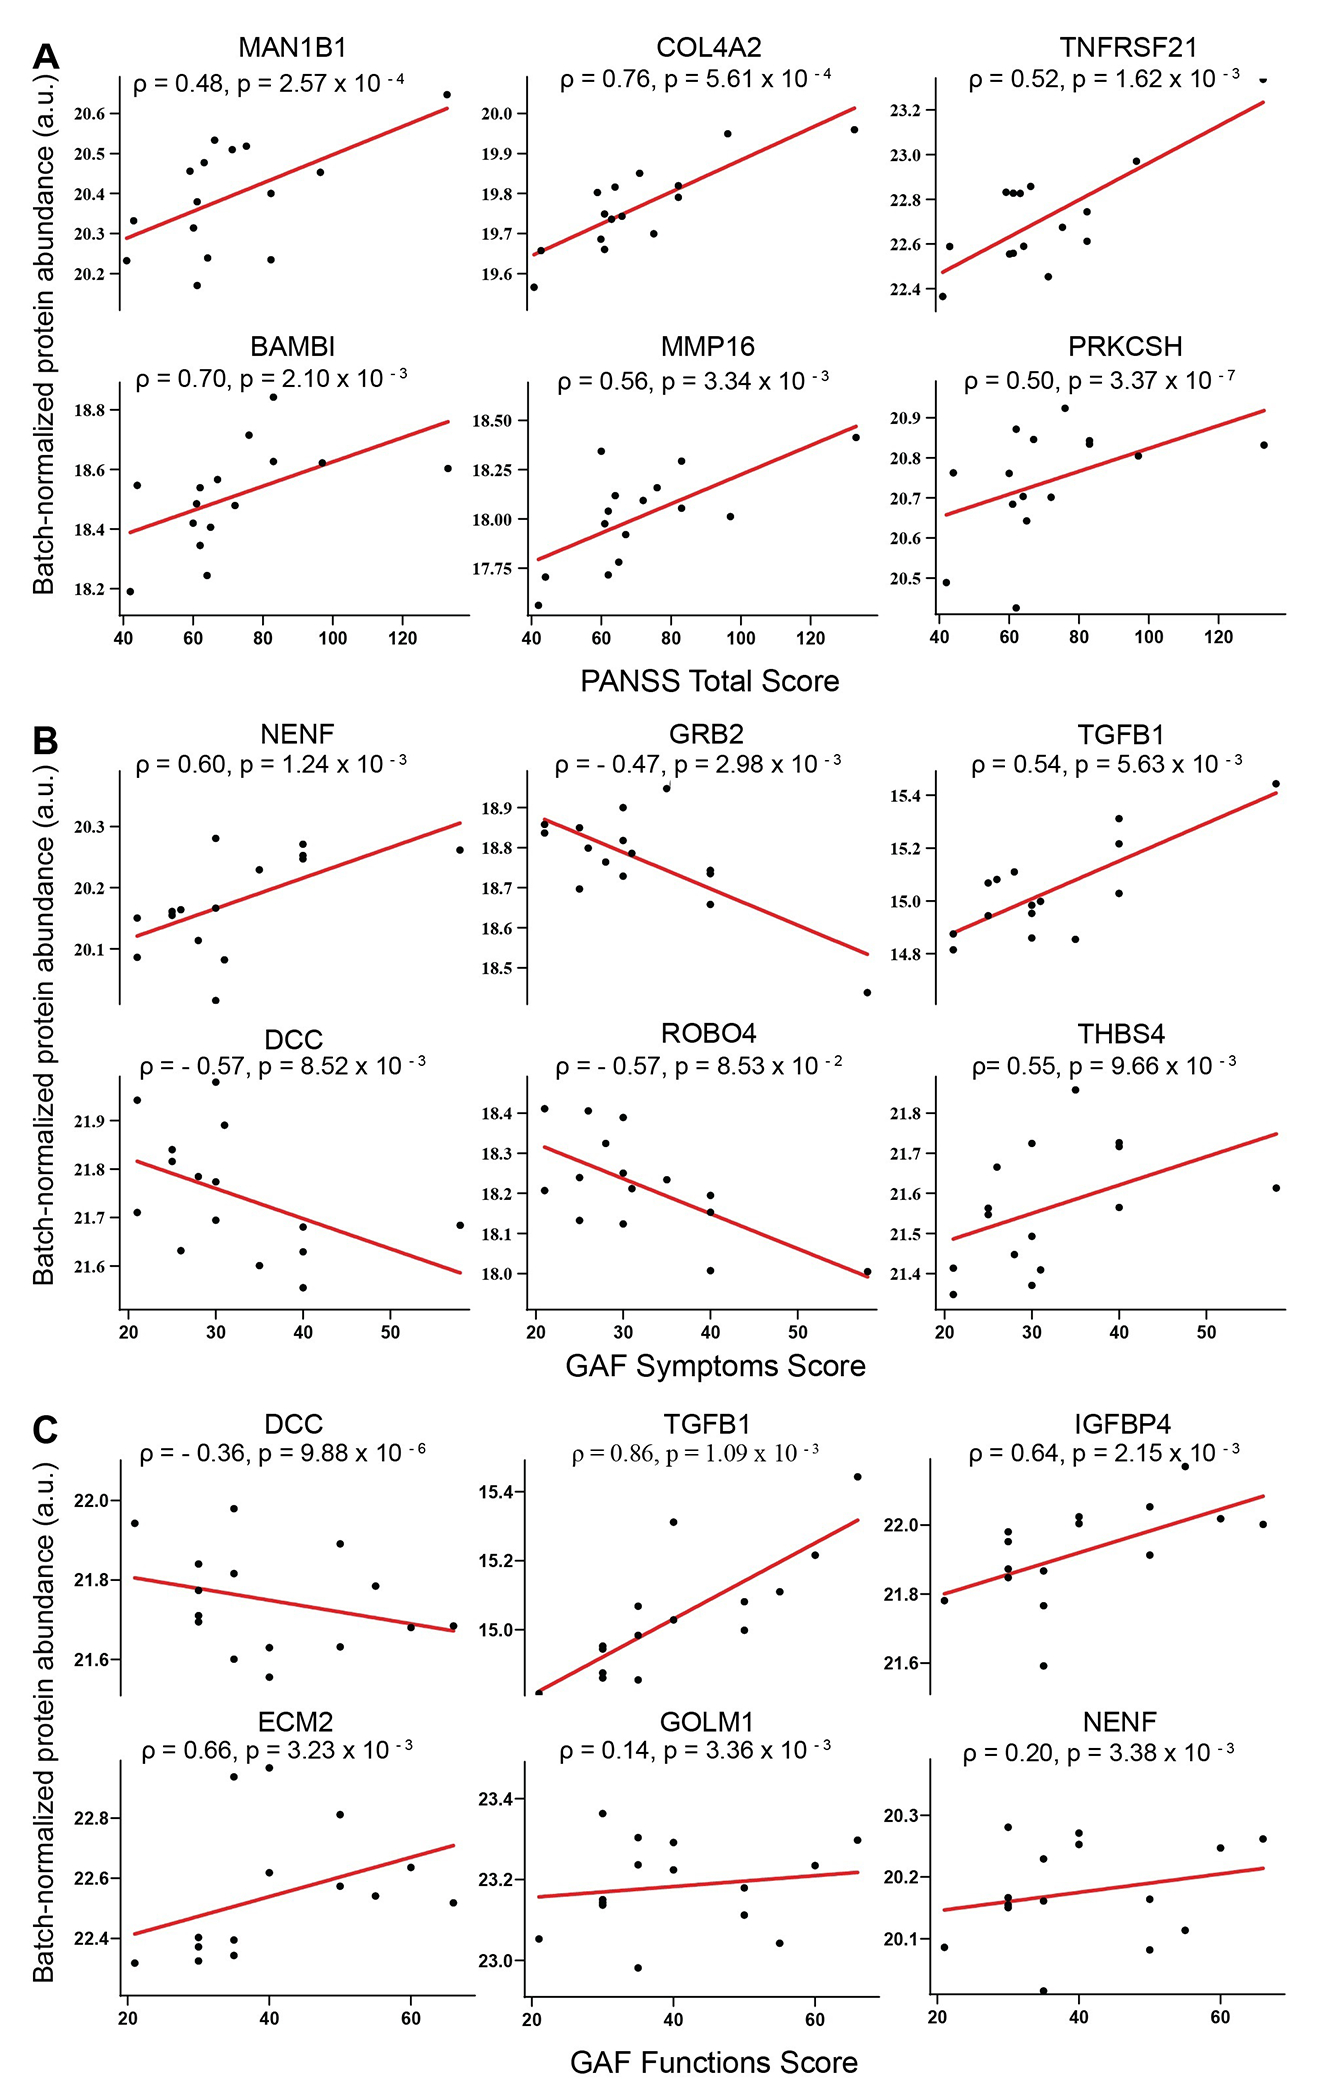
Scatter plots of the correlation between protein intensities (batch-normalized and in arbitrary unit) and psychosis symptoms measurements (A: Positive and Negative Syndrome Scale for Schizophrenia [PANSS]; B: Global Assessment of Function (GAF) symptom score; C: GAF function scores) in first-episode psychosis subjects. Each graph includes the Spearman’s correlation coefficient (ρ) and p-value of the correlation. Abbreviations: MAN1B1: Endoplasmic reticulum mannosyl-oligosaccharide 1,2-alpha-mannosidase; COL4A2: Collagen alpha-2 (IV) chain; TNFRSF21: Tumor necrosis factor receptor superfamily member 21; BAMBI: BMP and activin membrane-bound inhibitor homolog; MMP16: Matrix metalloproteinase-16; PRKCSH: Glucosidase 2 subunit beta; NENF: Neudesin neurotrophic factor; GRB2: Growth factor receptor-bound protein 2; TGFB1: Transforming growth factor beta-1 proprotein; DCC: DCC Netrin-1 receptor; ROBO4: Roundabout homolog 4; THBS4: Thrombospondin-4; IGFBP4: Insulin-like growth factor-binding protein 4; ECM2: Isoform 2 of Extracellular matrix protein 2; GOLM1: Isoform 2 of Golgi membrane protein 1.
4. Discussion
In this study, we used TMT-based mass spectrometry proteomic analysis to identify CSF proteins associated with FEP and symptom profiles in FEP. We identified potential FEP-associated proteins, such as COL4A2 and NDNF, known to be involved in cerebrovascular integrity and neurodevelopment, respectively. Additionally, we found proteins associated with neuroinflammatory response and neurodevelopment, such as TGFB1, DSP, and NENF, correlated with clinical symptoms and functioning scales in FEP subjects. Notably, COL4A2 is associated with FEP and correlated with PANSS total score in FEP subjects.
Among the top proteins that differed between groups was COL4A2, the alpha-2 chain of type IV collagen, a main component of the basement membranes of blood vessels and soft organs (Khoshnoodi et al., 2008). COL4A2 has been associated with familial cerebrovascular disease (Verbeek et al., 2012), intracerebral hemorrhage, and small vessel ischemic stroke (Chung et al., 2019; Jeanne et al., 2012), suggesting COL4A2’s role in maintaining cerebrovascular integrity (Xu et al., 2019). Cerebral microvasculature anomaly has been implicated in SCZ pathophysiology (Katsel et al., 2017), and stroke can induce various neuropsychiatric conditions, including psychosis (Stangeland et al., 2018). Additionally, altered cerebral blood flow has been associated with FEP (Kindler et al., 2018) as well as with psychotic symptoms (Owega et al., 1998), cognitive task performance (Kekin et al., 2018), and antipsychotic treatment (Brewer et al., 2007) in FEP patients. In this study, we observed a lower level of COL4A2 in the CSF of FEP subjects compared to HC and a positive correlation between COL4A2 and levels and PANSS total score in FEP subjects, which parallels the previously reported positive association between cerebral blood flow and psychotic symptoms in FEP patients (Owega et al., 1998). Therefore, our findings suggest that a reduced COL4A2 level in the brain may underlie the pathophysiology of FEP and the severity of SCZ symptoms due to deficits in cerebrovascular integrity and functioning.
NDNF was another top protein found to vary significantly between groups. NDNF is a neurotrophic factor expressed exclusively in neurons and was found to promote neuron migration, growth, survival, and neurite outgrowth (Kuang et al., 2010). In the developing cerebral cortex, NDNF is expressed in transient neurons and may be essential for cell survival critical for neuronal migration and differentiation (Kuang et al., 2010). Thus, dysregulated NDNF levels in the central nervous system may contribute to the morphological abnormalities in cortical regions observed in FEP patients (Chang et al., 2016; Gong et al., 2016; Radua et al., 2012). NDNF is also expressed in the adult cerebral cortex, hippocampus, olfactory bulb, and cerebellum (Kuang et al., 2010). It is a marker of GABAergic interneurons located in Layer 1 of the neocortex; these neurons are present in various sensory processing cortices, including visual, auditory, somatosensory, and prefrontal cortex (Abs et al., 2018; Cohen-Kashi Malina et al., 2021) and receive long-range inputs from different primary cortices, association cortices, thalamus, and hypothalamus (Cohen-Kashi Malina et al., 2021). NDNF also involves olfactory axonal projection to the olfactory bulb (Messina et al., 2020). Since deficits in sensory processing have been implicated in hallucinations (Javitt and Freedman, 2015), our observation of a lower NDNF level in the CSF of FEP subjects may imply deficits in the development and maintenance of brain structures involved in sensory processing, thereby posing vulnerability to specific psychosis symptoms such as hallucinations.
We identified some proteins (e.g., TGFB1, DCC, and NENF) in the CSF of FEP subjects to be correlated with GAF symptoms and function scores. TGFB1 is a crucial regulator of inflammatory responses, including orchestrating phenotypic changes of various brain cell types in response to brain injury (Luo, 2022; Rustenhoven et al., 2016; Taylor et al., 2017). In SCZ patients, higher peripheral blood TGFB1 levels were found (Frydecka et al., 2015; Pan et al., 2022) and were associated with more severe symptoms and cognitive disturbances (Amoli et al., 2019; Pan et al., 2022). DCC is a netrin receptor that plays a pivotal role in the development, organization, and plasticity of the mesocorticolimbic dopaminergic circuitry (Flores et al., 2005; Grant et al., 2007; Grant et al., 2009) and in the guidance of GABAergic neuron migrations in the cerebral cortex (Yamagishi et al., 2020). It has been implicated in various psychiatric disorders, including SCZ and mood disorders (Vosberg et al., 2020; Wu et al., 2020). Less is known about the relationship between NENF and psychosis-related disorders. NENF is a secreted neurotrophic factor that promotes neural cell proliferation and neuronal differential in embryonic neural development (Kimura et al., 2006) but also shows neurotrophic actions in adult hippocampus (Novais et al., 2018). It is involved in the regulation of food intake (Byerly et al., 2013), anxiety-like behaviors (Novais et al., 2013), and sympathetic activity (Ohta et al., 2015). The correlation of these proteins with symptom severity and functioning scales in FEP subjects underscores the significance of neuroinflammatory response and neurodevelopment in the severity and outcomes of FEP illness.
A few limitations need to be noted. Firstly, given the small sample size of this study and the large number of comparisons, the results should be regarded as exploratory and in need of replication with a larger sample. Secondly, the top findings need to be validated by targeted quantitative methods since the proteomic method used in this study relies on protein identity prediction and does not provide absolute protein abundance. Lastly, since FEP subjects were recruited in a naturalistic manner, some of our FEP subjects were enrolled in the study when they had already begun pharmacotherapeutic treatment.
To conclude, we identified some potential CSF proteins that may be associated with FEP and/or correlated with psychosis symptom severity, which provided insights into the pathophysiology of FEP and novel treatment strategies for psychosis. Nonetheless, these findings require independent replication with larger samples and validation with targeted protein analyses.
Supplementary Material
Acknowledgments
We thank all participants for their valuable contributions to this study. We also thank Maria Lee, Minna Juntura, Henrik Gregemark, Joachim Eckerström, Maria Adolfsson, Fredrik Piehl, and Martin Szabo for their tremendous efforts in recruiting, caring for research participants, and maintaining the clinical database. The helpfulness of the staff at the participating psychiatric units in Stockholm (Prima Vuxenpsykiatri, Psykiatri Nordväst and Norra Stockholms Psykiatri) is also gratefully acknowledged. We also thank the Mayo Clinic Proteomics Core for providing expert guidance and conducting the proteomics experiments.
Funding
This work was supported by the Samuel C. Johnson Genomics of Addiction Program at the Mayo Clinic, the Ulm Foundation, the National Institute on Alcohol Abuse and Alcoholism (AA028968 and AA029258), and the National Institute on Aging (AG072898), the Swedish Research Council (GE 2019- 01452, SE2017-00875), The KI-AstraZeneca Joint Research Program (SE), Torsten Söderbergs Stiftelse (SE), the Swedish Brain Foundation (SE, GE, CMS), Petrus och Augusta Hedlunds Stiftelse (SE), Märta Lundqvists Stiftelse (SE), Åhlén-stiftelsen (GE), the regional agreement on medical training and clinical research between Stockholm County Council (ALF FoUI-2974821 (SE)), (ALF: FoUI-962837 (CMS)), and, the Karolinska Institutet (KID) (SE and CMS).
Footnotes
Declaration of competing interest
All authors declare that the research was conducted without commercial or financial relationships that could be construed as a potential conflict of interest.
References
- Abs E, Poorthuis RB, Apelblat D, Muhammad K, Pardi MB, Enke L, Kushinsky D, Pu DL, Eizinger MF, Conzelmann KK, Spiegel I, Letzkus JJ, 2018. Learning-Related Plasticity in Dendrite-Targeting Layer 1 Interneurons. Neuron 100(3), 684–699.e686. [DOI] [PMC free article] [PubMed] [Google Scholar]
- Amoli MM, Khatami F, Arzaghi SM, Enayati S, Nejatisafa AA, 2019. Over-expression of TGF-beta1 gene in medication free Schizophrenia. Psychoneuroendocrinology 99, 265–270. [DOI] [PubMed] [Google Scholar]
- Baloyianni N, Tsangaris GT, 2009. The audacity of proteomics: a chance to overcome current challenges in schizophrenia research. Expert Rev Proteomics 6. [DOI] [PubMed] [Google Scholar]
- Brewer WJ, Yucel M, Harrison BJ, McGorry PD, Olver J, Egan GF, Velakoulis D, Pantelis C, 2007. Increased prefrontal cerebral blood flow in first-episode schizophrenia following treatment: longitudinal positron emission tomography study. Aust N Z J Psychiatry 41(2), 129–135. [DOI] [PubMed] [Google Scholar]
- Brown AS, 2011. The environment and susceptibility to schizophrenia. Prog Neurobiol 93(1), 23–58. [DOI] [PMC free article] [PubMed] [Google Scholar]
- Byerly MS, Swanson RD, Semsarzadeh NN, McCulloh PS, Kwon K, Aja S, Moran TH, Wong GW, Blackshaw S, 2013. Identification of hypothalamic neuron-derived neurotrophic factor as a novel factor modulating appetite. Am J Physiol Regul Integr Comp Physiol 304(12), R1085–1095. [DOI] [PMC free article] [PubMed] [Google Scholar]
- Chang M, Womer FY, Bai C, Zhou Q, Wei S, Jiang X, Geng H, Zhou Y, Tang Y, Wang F, 2016. Voxel-Based Morphometry in Individuals at Genetic High Risk for Schizophrenia and Patients with Schizophrenia during Their First Episode of Psychosis. PLoS One 11(10), e0163749. [DOI] [PMC free article] [PubMed] [Google Scholar]
- Chung J, Marini S, Pera J, Norrving B, Jimenez-Conde J, Roquer J, Fernandez-Cadenas I, Tirschwell DL, Selim M, Brown DL, Silliman SL, Worrall BB, Meschia JF, Demel S, Greenberg SM, Slowik A, Lindgren A, Schmidt R, Traylor M, Sargurupremraj M, Tiedt S, Malik R, Debette S, Dichgans M, Langefeld CD, Woo D, Rosand J, Anderson CD, 2019. Genome-wide association study of cerebral small vessel disease reveals established and novel loci. Brain 142(10), 3176–3189. [DOI] [PMC free article] [PubMed] [Google Scholar]
- Cohen-Kashi Malina K, Tsivourakis E, Kushinsky D, Apelblat D, Shtiglitz S, Zohar E, Sokoletsky M, Tasaka GI, Mizrahi A, Lampl I, Spiegel I, 2021. NDNF interneurons in layer 1 gain-modulate whole cortical columns according to an animal's behavioral state. Neuron 109(13), 2150–2164 e2155. [DOI] [PubMed] [Google Scholar]
- Comes AL, Papiol S, Mueller T, Geyer PE, Mann M, Schulze TG, 2018. Proteomics for blood biomarker exploration of severe mental illness: pitfalls of the past and potential for the future. Transl Psychiatry 8(1), 160. [DOI] [PMC free article] [PubMed] [Google Scholar]
- Do KQ, Cabungcal JH, Frank A, Steullet P, Cuenod M, 2009. Redox dysregulation, neurodevelopment, and schizophrenia. Curr Opin Neurobiol 19. [DOI] [PubMed] [Google Scholar]
- Drake RJ, Husain N, Marshall M, Lewis SW, Tomenson B, Chaudhry IB, Everard L, Singh S, Freemantle N, Fowler D, Jones PB, Amos T, Sharma V, Green CD, Fisher H, Murray RM, Wykes T, Buchan I, Birchwood M, 2020. Effect of delaying treatment of first-episode psychosis on symptoms and social outcomes: a longitudinal analysis and modelling study. Lancet Psychiatry 7(7), 602–610. [DOI] [PMC free article] [PubMed] [Google Scholar]
- English JA, Pennington K, Dunn MJ, ouch DR, 2011. The neuroproteomics of schizophrenia. Biol Psychiatry 69. [DOI] [PubMed] [Google Scholar]
- Fisar Z, 2023. Biological hypotheses, risk factors, and biomarkers of schizophrenia. Prog Neuropsychopharmacol Biol Psychiatry 120, 110626. [DOI] [PubMed] [Google Scholar]
- Flores C, Manitt C, Rodaros D, Thompson KM, Rajabi H, Luk KC, Tritsch NX, Sadikot AF, Stewart J, Kennedy TE, 2005. Netrin receptor deficient mice exhibit functional reorganization of dopaminergic systems and do not sensitize to amphetamine. Mol Psychiatry 10(6), 606–612. [DOI] [PubMed] [Google Scholar]
- Focking M, Lopez LM, English JA, Dicker P, Wolff A, Brindley E, Wynne K, Cagney G, Cotter DR, 2015. Proteomic and genomic evidence implicates the postsynaptic density in schizophrenia. Mol Psychiatry 20(4), 424–432. [DOI] [PubMed] [Google Scholar]
- Frydecka D, Misiak B, Pawlak-Adamska E, Karabon L, Tomkiewicz A, Sedlaczek P, Kiejna A, Beszlej JA, 2015. Sex differences in TGFB-beta signaling with respect to age of onset and cognitive functioning in schizophrenia. Neuropsychiatr Dis Treat 11, 575–584. [DOI] [PMC free article] [PubMed] [Google Scholar]
- Gong Q, Lui S, Sweeney JA, 2016. A Selective Review of Cerebral Abnormalities in Patients With First-Episode Schizophrenia Before and After Treatment. Am J Psychiatry 173(3), 232–243. [DOI] [PubMed] [Google Scholar]
- Grant A, Hoops D, Labelle-Dumais C, Prevost M, Rajabi H, Kolb B, Stewart J, Arvanitogiannis A, Flores C, 2007. Netrin-1 receptor-deficient mice show enhanced mesocortical dopamine transmission and blunted behavioural responses to amphetamine. Eur J Neurosci 26(11), 3215–3228. [DOI] [PubMed] [Google Scholar]
- Grant A, Speed Z, Labelle-Dumais C, Flores C, 2009. Post-pubertal emergence of a dopamine phenotype in netrin-1 receptor-deficient mice. Eur J Neurosci 30(7), 1318–1328. [DOI] [PubMed] [Google Scholar]
- Javitt DC, Freedman R, 2015. Sensory processing dysfunction in the personal experience and neuronal machinery of schizophrenia. Am J Psychiatry 172(1), 17–31. [DOI] [PMC free article] [PubMed] [Google Scholar]
- Jeanne M, Labelle-Dumais C, Jorgensen J, Kauffman WB, Mancini GM, Favor J, Valant V, Greenberg SM, Rosand J, Gould DB, 2012. COL4A2 mutations impair COL4A1 and COL4A2 secretion and cause hemorrhagic stroke. Am J Hum Genet 90(1), 91–101. [DOI] [PMC free article] [PubMed] [Google Scholar]
- Kahn RS, Sommer IE, 2015. The neurobiology and treatment of first-episode schizophrenia. Mol Psychiatry 20(1), 84–97. [DOI] [PMC free article] [PubMed] [Google Scholar]
- Katsel P, Roussos P, Pletnikov M, Haroutunian V, 2017. Microvascular anomaly conditions in psychiatric disease. Schizophrenia – angiogenesis connection. Neurosci Biobehav Rev 77, 327–339. [DOI] [PMC free article] [PubMed] [Google Scholar]
- Kekin I, Bosnjak D, Makaric P, Bajic Z, Rossini Gajsak L, Malojcic B, Boban M, Rojnic Kuzman M, 2018. Significantly lower right middle cerebral artery blood flow velocity in the first episode of psychosis during neurocognitive testing. Psychiatr Danub 30(2), 172–182. [DOI] [PubMed] [Google Scholar]
- Khoshnoodi J, Pedchenko V, Hudson BG, 2008. Mammalian collagen IV. Microsc Res Tech 71(5), 357–370. [DOI] [PMC free article] [PubMed] [Google Scholar]
- Kimura I, Konishi M, Miyake A, Fujimoto M, Itoh N, 2006. Neudesin, a secreted factor, promotes neural cell proliferation and neuronal differentiation in mouse neural precursor cells. J Neurosci Res 83(8), 1415–1424. [DOI] [PubMed] [Google Scholar]
- Kindler J, Schultze-Lutter F, Hauf M, Dierks T, Federspiel A, Walther S, Schimmelmann BG, Hubl D, 2018. Increased Striatal and Reduced Prefrontal Cerebral Blood Flow in Clinical High Risk for Psychosis. Schizophr Bull 44(1), 182–192. [DOI] [PMC free article] [PubMed] [Google Scholar]
- Kuang XL, Zhao XM, Xu HF, Shi YY, Deng JB, Sun GT, 2010. Spatio-temporal expression of a novel neuron-derived neurotrophic factor (NDNF) in mouse brains during development. BMC Neurosci 11, 137. [DOI] [PMC free article] [PubMed] [Google Scholar]
- Lally J, Ajnakina O, Stubbs B, Cullinane M, Murphy KC, Gaughran F, Murray RM, 2017. Remission and recovery from first-episode psychosis in adults: systematic review and meta-analysis of long-term outcome studies. Br J Psychiatry 211(6), 350–358. [DOI] [PubMed] [Google Scholar]
- Luo J, 2022. TGF-β as a Key Modulator of Astrocyte Reactivity: Disease Relevance and Therapeutic Implications. Biomedicines 10(5). [DOI] [PMC free article] [PubMed] [Google Scholar]
- Messina A, Pulli K, Santini S, Acierno J, Kansakoski J, Cassatella D, Xu C, Casoni F, Malone SA, Ternier G, Conte D, Sidis Y, Tommiska J, Vaaralahti K, Dwyer A, Gothilf Y, Merlo GR, Santoni F, Niederlander NJ, Giacobini P, Raivio T, Pitteloud N, 2020. Neuron-Derived Neurotrophic Factor Is Mutated in Congenital Hypogonadotropic Hypogonadism. Am J Hum Genet 106(1), 58–70. [DOI] [PMC free article] [PubMed] [Google Scholar]
- Metsalu T, Vilo J, 2015. ClustVis: a web tool for visualizing clustering of multivariate data using Principal Component Analysis and heatmap. Nucleic Acids Res 43(W1), W566–570. [DOI] [PMC free article] [PubMed] [Google Scholar]
- Morgan C, Lappin J, Heslin M, Donoghue K, Lomas B, Reininghaus U, Onyejiaka A, Croudace T, Jones PB, Murray RM, Fearon P, Doody GA, Dazzan P, 2014. Reappraising the long-term course and outcome of psychotic disorders: the AESOP-10 study. Psychol Med 44(13), 2713–2726. [DOI] [PMC free article] [PubMed] [Google Scholar]
- Murray RM, Bhavsar V, Tripoli G, Howes O, 2017. 30 Years on: How the Neurodevelopmental Hypothesis of Schizophrenia Morphed Into the Developmental Risk Factor Model of Psychosis. Schizophr Bull 43(6), 1190–1196. [DOI] [PMC free article] [PubMed] [Google Scholar]
- Novais A, Ferreira AC, Marques F, Pego JM, Cerqueira JJ, David-Pereira A, Campos FL, Dalla C, Kokras N, Sousa N, Palha JA, Sousa JC, 2013. Neudesin is involved in anxiety behavior: structural and neurochemical correlates. Front Behav Neurosci 7, 119. [DOI] [PMC free article] [PubMed] [Google Scholar]
- Novais A, Silva A, Ferreira AC, Falcao AM, Sousa N, Palha JA, Marques F, Sousa JC, 2018. Adult Hippocampal Neurogenesis Modulation by the Membrane-Associated Progesterone Receptor Family Member Neudesin. Front Cell Neurosci 12, 463. [DOI] [PMC free article] [PubMed] [Google Scholar]
- Ohta H, Konishi M, Kobayashi Y, Kashio A, Mochiyama T, Matsumura S, Inoue K, Fushiki T, Nakao K, Kimura I, Itoh N, 2015. Deletion of the Neurotrophic Factor neudesin Prevents Diet-induced Obesity by Increased Sympathetic Activity. Sci Rep 5, 10049. [DOI] [PMC free article] [PubMed] [Google Scholar]
- Owega A, Klingelhofer J, Sabri O, Kunert HJ, Albers M, Sass H, 1998. Cerebral blood flow velocity in acute schizophrenic patients. A transcranial Doppler ultrasonography study. Stroke 29(6), 1149–1154. [DOI] [PubMed] [Google Scholar]
- Pan S, Zhou Y, Yan L, Xuan F, Tong J, Li Y, Huang J, Feng W, Chen S, Cui Y, Yang F, Tan S, Wang Z, Tian B, Hong LE, Tan YL, Tian L, 2022. TGF-beta1 is associated with deficits in cognition and cerebral cortical thickness in first-episode schizophrenia. J Psychiatry Neurosci 47(2), E86–E98. [DOI] [PMC free article] [PubMed] [Google Scholar]
- Paval D, Gherghel-Paval N, Capatina OO, Stan A, Miclutia IV, Gine-Serven E, 2023. The Importance of Cerebrospinal Fluid Investigation in First-episode Psychosis. Yale J Biol Med 96(1), 125–126. [DOI] [PMC free article] [PubMed] [Google Scholar]
- Radua J, Borgwardt S, Crescini A, Mataix-Cols D, Meyer-Lindenberg A, McGuire PK, Fusar-Poli P, 2012. Multimodal meta-analysis of structural and functional brain changes in first episode psychosis and the effects of antipsychotic medication. Neurosci Biobehav Rev 36(10), 2325–2333. [DOI] [PubMed] [Google Scholar]
- Rustenhoven J, Aalderink M, Scotter EL, Oldfield RL, Bergin PS, Mee EW, Graham ES, Faull RL, Curtis MA, Park TI, Dragunow M, 2016. TGF-beta1 regulates human brain pericyte inflammatory processes involved in neurovasculature function. J Neuroinflammation 13, 37. [DOI] [PMC free article] [PubMed] [Google Scholar]
- Shang P, Ho AM, Tufvesson-Alm M, Lindberg DR, Grant CW, Orhan F, Eren F, Bhat M, Engberg G, Schwieler L, Fatouros-Bergman H, Imbeault S, Iverson RM, Dasari S, Piehl F, Cervenka S, Sellgren CM, Erhardt S, Choi DS, 2022. Identification of cerebrospinal fluid and serum metabolomic biomarkers in first episode psychosis patients. Transl Psychiatry 12(1), 229. [DOI] [PMC free article] [PubMed] [Google Scholar]
- Stangeland H, Orgeta V, Bell V, 2018. Poststroke psychosis: a systematic review. J Neurol Neurosurg Psychiatry 89(8), 879–885. [DOI] [PMC free article] [PubMed] [Google Scholar]
- Taylor RA, Chang CF, Goods BA, Hammond MD, Mac Grory B, Ai Y, Steinschneider AF, Renfroe SC, Askenase MH, McCullough LD, Kasner SE, Mullen MT, Hafler DA, Love JC, Sansing LH, 2017. TGF-beta1 modulates microglial phenotype and promotes recovery after intracerebral hemorrhage. J Clin Invest 127(1), 280–292. [DOI] [PMC free article] [PubMed] [Google Scholar]
- Tsuang MT, Bar JL, Stone WS, Faraone SV, 2004. Gene-environment interactions in mental disorders. World Psychiatry 3(2), 73–83. [PMC free article] [PubMed] [Google Scholar]
- Verbeek E, Meuwissen ME, Verheijen FW, Govaert PP, Licht DJ, Kuo DS, Poulton CJ, Schot R, Lequin MH, Dudink J, Halley DJ, de Coo RI, den Hollander JC, Oegema R, Gould DB, Mancini GM, 2012. COL4A2 mutation associated with familial porencephaly and small-vessel disease. Eur J Hum Genet 20(8), 844–851. [DOI] [PMC free article] [PubMed] [Google Scholar]
- Vosberg DE, Leyton M, Flores C, 2020. The Netrin-1/DCC guidance system: dopamine pathway maturation and psychiatric disorders emerging in adolescence. Mol Psychiatry 25(2), 297–307. [DOI] [PMC free article] [PubMed] [Google Scholar]
- Weickert CS, Weickert TW, Pillai A, Buckley PF, 2013. Biomarkers in schizophrenia: a brief conceptual consideration. Dis Markers 35(1), 3–9. [DOI] [PMC free article] [PubMed] [Google Scholar]
- Wilmarth P, 2019. Thorough Testing of Internal Reference Scaling (IRS). https://pwilmart.github.io/TMT_analysis_examples/IRS_validation.html#ref4. (Accessed October 13, 2022). [Google Scholar]
- Wu Y, Cao H, Baranova A, Huang H, Li S, Cai L, Rao S, Dai M, Xie M, Dou Y, Hao Q, Zhu L, Zhang X, Yao Y, Zhang F, Xu M, Wang Q, 2020. Multi-trait analysis for genome-wide association study of five psychiatric disorders. Transl Psychiatry 10(1), 209. [DOI] [PMC free article] [PubMed] [Google Scholar]
- Xu L, Nirwane A, Yao Y, 2019. Basement membrane and blood-brain barrier. Stroke Vasc Neurol 4(2), 78–82. [DOI] [PMC free article] [PubMed] [Google Scholar]
- Yamagishi S, Bando Y, Sato K, 2020. Involvement of Netrins and Their Receptors in Neuronal Migration in the Cerebral Cortex. Front Cell Dev Biol 8, 590009. [DOI] [PMC free article] [PubMed] [Google Scholar]
Associated Data
This section collects any data citations, data availability statements, or supplementary materials included in this article.