

A confiscated package of street drugs was highly crystalline and was found to consist of two very different species accidentally of sizes convenient for X-ray diffraction, namely, 1,2-diphenyl-2-(pyrrolidin-1-yl)ethanone hydrochloride or ‘α-D2PV’ and the sugar myo-inositol.
Keywords: crystal structure, cathinones, bath salts, racemic drugs, sugars, inositol, asymmetric units, molecular overlays, novel psychoactive substances, π–π interactions, hydrogen bonding
Abstract
A confiscated package of street drugs was characterized by the usual mass spectral (MS) and FT–IR analyses. The confiscated powder material was highly crystalline and was found to consist of two very different species, accidentally of sizes convenient for X-ray diffraction. Thus, one each was selected and redundant complete sets of data were collected at 100 K using Cu Kα radiation. The selected crystals contained: (a) 1,2-diphenyl-2-(pyrrolidin-1-yl)ethanone hydrochloride hemihydrate or 1-(2-oxo-1,2-diphenylethyl)pyrrolidin-1-ium chloride hemihydrate, C18H20NO+·Cl−·0.5H2O, (I), a synthetic cathinone called ‘α-D2PV’, and (b) the sugar myo-inositol, C6H12O6, (II), probably the only instance in which the drug and its diluent have been fully characterized from a single confiscated sample. Moreover, the structural details of both are rather attractive showing: (i) interesting hydrogen bonding observed in pairwise interactions by the drug molecules, mediated by the chloride counter-anions and the waters of crystallization, and (ii) π–π interactions in the case of the phenyl rings of the drug which are of two different types, namely, π–π stacking and edge-to-π. Finally, the inositol crystallizes with Z′ = 2 and the resulting diastereoisomers were examined by overlay techniques.
Introduction: useful historical notes and commentaries
In 2021, as part of a law enforcement investigation, an off-white crystalline powder was submitted for analysis. This submission contained two components: α-pyrrolidino-2-phenylacetophenone (called α-D2PV), which is an N-pyrrolidinyl substituent of natural cathinone, and myo-inositol, a common sugar. The sample was initially identified using GC–MS and the structures of both materials were confirmed by single-crystal X-ray diffraction.
α-D2PV, (I), belongs to a class of stimulants, ‘synthetic cathinones’, that are simple modifications of the chemical structure of cathinone. Cathinone is a naturally occurring chemical found in the khat plant (Catha edulis), commonly grown and used in East Africa (Kalix, 1992 ▸). Cathinone and several derivatives have been scheduled by the DEA as controlled substances, leading to the syntheses of new synthetic cathinone compounds (often referred to as ‘bath salts’) which were developed to produce similar psychotropic and stimulant effects as ‘legal highs’ (Zawilska & Wojcieszak, 2013 ▸), and to circumvent the ‘controlled substances’ list. In this instance, α-D2PV is obtained by the substitution of a pyrrole ring in place of the amine group and a phenyl group on the α-C atom (Scheme 1).

Very little pharmacological information is available beyond reports on recreational drug-use websites. Due to the fast development of new designer drugs, we find it important to provide analytical data on as many new addictive compound(s) as become available to assist in law enforcement and toxicological investigations, which serve as an addition to a growing list of new psychotropic compounds; researchers at the University of Silesia have been adding to this list by making recent contributions (Rojkiewicz et al., 2020 ▸; Kuś et al., 2017 ▸, 2019 ▸).
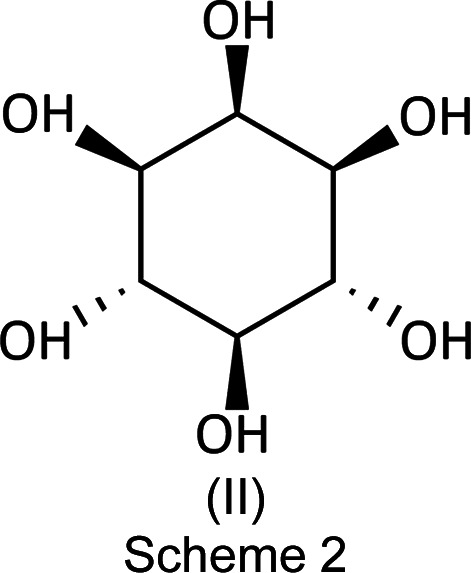
Inositol has an interesting history as a natural product because it is produced by many plants, such as citrus, beans, corn, sesame, etc., and from glucose by the human body. Interestingly, the substance is not optically active because of the symmetrical hydroxylation of the six aliphatic C atoms of the cyclohexane central ring. For an interesting description of its history and early crystallographic background, we recommend the papers by Rabinovich & Kraut (1964 ▸) [Cambridge Structural Database (CSD; Groom et al., 2016 ▸) refcode: MYINOL] and Rebecca et al. (2012 ▸) (MYINOL02). Scheme 2 shows myo-inositol, (II).
Experimental (methods and materials)
Sample preparation
The compound of interest was initially received as part of a law enforcement investigation of suspected controlled dangerous substances. A portion of approximately 5 mg was dissolved in 1 ml of LC–MS grade methanol supplied by Fisher Chemical (Palo Alto, CA, USA) for GC–EI–MS (gas chromatography–electron ionization–mass spectrometry) analysis. A small portion of the sample material was ground and analyzed by ATR–FT–IR (attenuated total reflectance–Fourier transform–infrared spectroscopy) without further sample preparation. A separate portion of the drug material was examined microscopically and two suitable single crystals were selected without further preparation for the X-ray diffraction experiment. Both crystals had distinctly different morphologies: the one that would prove to be the title synthetic cathinone, (I), was a colourless prism; the second, a common illicit drug diluent, the sugar inositol, (II), was a colourless parallelepiped. Additionally, a reference standard of the drug compound was purchased from Cayman Chemical (Ann Arbor, Michigan, USA) for comparison and confirmation.
Mass spectral analysis of (I)
The mass spectral analysis of (I) were performed using GC–EI–MS on the law-enforcement-seized sample.
A Thermo Scientific Trace 1310 Gas Chromatograph ISQ 7000 Mass Spectrometer [single quadrupole GC–EI–MS, utilizing a Restek Rtx-5MS (5% diphenyl–95% methyl cross-bonded polysiloxane) 30 m × 0.25 mm ID × 0.25 µm film column (catalogue No. 12623)] was used as part of the general drug analytical scheme of the forensic laboratory. The GC and MS parameters can be found in Table 1 ▸ and the GC spectrum of α-D2PV, (I), is shown in Fig. 1 ▸. The mass spectral fragmentation pattern for α-D2PV, (I), is shown in Fig. 2 ▸.
Table 1. Mass spectrometry parameters for the analysis of α-D2PV, (I).
| Instrumental method for seized drug analysis | ||
|---|---|---|
| Instrument | Thermo Scientific TRACE 1310 GC – ISQ-LT | |
| Injection mode | splitless | splitless time 1.0 min |
| GC column | Restek RTX-5Sil MS, 30 m × 0.25 mm × 0.25 µm | |
| Carrier gas He (99.999%) | Flow 1.0 ml min−1, constant flow | |
| Injector temperature: | 220 °C | |
| Temperature program | 65 °C, 2 min | |
| 30 °C min−1 to 150 °C | ||
| 30 °C min−1 to 300 °C | ||
| 10 min hold | ||
| Transfer line temperature | 280 °C | |
| Total analysis time | 22.83 min | |
| TriPlus RSH autosampler | Injection volume 1 µl | |
| ISQ-LT MS ionization mode EI | 70 eV | |
| Ion source temperature | 200 °C | |
| Full scan | 45–500 m/z | |
Figure 1.

GC spectrum of α-D2PV, (I). The main sample peak at 11.03 min represents the synthetic cathinone α-D2PV. The small peaks at 11.20 min represent the thermal degradation of α-D2PV in the GC injection port (see Discussion section).
Figure 2.

Mass spectral fragmentation of α-D2PV, (I).
Cathinone fragmentation patterns are dominated by α-cleavage at both the amine and the carbonyl groups. The ions produced by the EI fragmentation of α-D2PV are consistent with previously described EI–MS fragmentation of α-pyrrolidinophenone synthetic cathinones (Zuba, 2012 ▸; Matsuta et al., 2014 ▸; Qian et al., 2017 ▸; Davidson et al., 2020 ▸). In the case of α-D2PV, the fragmentation produced the expected base 1-benzylidenepyrrolidinium ion at m/z 160 and the benzoylium ion at m/z 105 (Fig. 2 ▸). The proposed fragmentation mechanism (Fig. 3 ▸) is based on the extensive work of Davidson et al. (2020 ▸). Subsequent fragmentation of the 1-benzylidenepyrrolidinium ion yields a tropylium ion at 91 m/z and the cyclopenta-1,3-diene-1-ylium ion at 65 m/z; subsequent fragmentation of the benzoylium produces a phenylium ion at 77 m/z and the cyclobutadien-4-ylium ion at 51 m/z. Fig. 3 ▸ shows a proposed fragmentation mechanism of α-D2PV, (I), including the possible ions involved.
Figure 3.

The proposed major mass spectra fragmentation ions of α-D2PV, (I).
Direct analysis of the seized drug material (I) by ATR–FT–IR
The IR spectrum (Fig. 4 ▸) was obtained with a Nicolet iS50 FT–IR spectrometer (Thermo Scientific), using attenuated total reflectance (ATR), and the spectrum was collected in the wavenumber range 4000–400 cm−1.
Figure 4.

FT–IR spectrum of α-D2PV, (I).
X-ray data collection, structure solutions, and refinements of α-D2PV, (I), and inositol, (II)
Crystals of (I) and (II) were secured to a micromount fiber loop using Paratone-N oil. The crystal dimensions, as well as the pertinent crystal information for both compounds, are given in Table 2 ▸. The SCXRD data for both materials were collected at 100 K on a Rigaku XtaLAB Synergy-S Dual Source diffractometer with a PhotonJet Cu-microfocus source (λ = 1.54178 Å) and a HyPix-6000HE hybrid photon counting (HPC) detector. To ensure completeness and desired redundancy, data collection strategies were calculated using CrysAlis PRO (Rigaku OD, 2022 ▸). Subsequent data processing was also performed in CrysAlis PRO. Using the SCALE3 ABSPACK scaling algorithm (Rigaku OD, 2022 ▸), empirical and numerical (Gaussian) absorption corrections were applied to the data (faces were determined using face-indexing in CrysAlis PRO). The structures were solved via intrinsic phasing methods using SHELXT in OLEX2 (Dolomanov et al., 2009 ▸) and refined by full-matrix least-squares techniques against F 2 (SHELXL; Sheldrick, 2015a ▸), first in the OLEX2 (Dolomanov et al., 2009 ▸) graphical user interface, and later using SHELXTL (Sheldrick, 2015b ▸).
Table 2. Experimental details.
Experiments were carried out at 100 K with Cu Kα radiation using a Rigaku XtaLAB Synergy Dualflex diffractometer with a HyPix detector. H atoms were treated by a mixture of independent and constrained refinement.
| (I) | (II) | |
|---|---|---|
| Crystal data | ||
| Chemical formula | 2C18H20NO+·2Cl−·H2O | C6H12O6 |
| M r | 621.62 | 180.16 |
| Crystal system, space group | Monoclinic, C2/c | Monoclinic, P21/n |
| a, b, c (Å) | 13.8926 (1), 11.9663 (1), 19.3872 (1) | 6.61708 (6), 12.0474 (1), 18.88721 (19) |
| β (°) | 100.384 (1) | 93.9791 (8) |
| V (Å3) | 3170.20 (4) | 1502.04 (2) |
| Z | 4 | 8 |
| μ (mm−1) | 2.15 | 1.26 |
| Crystal size (mm) | 0.27 × 0.20 × 0.11 | 0.22 × 0.10 × 0.08 |
| Data collection | ||
| Absorption correction | Multi-scan (CrysAlis PRO; Rigaku OD, 2022 ▸) | Gaussian (CrysAlis PRO; Rigaku OD, 2022 ▸) |
| T min, T max | 0.808, 1.000 | 0.607, 1.000 |
| No. of measured, independent and observed [I > 2σ(I)] reflections | 58892, 3260, 3089 | 55215, 3168, 2697 |
| R int | 0.043 | 0.064 |
| (sin θ/λ)max (Å−1) | 0.630 | 0.631 |
| Refinement | ||
| R[F 2 > 2σ(F 2)], wR(F 2), S | 0.031, 0.082, 1.09 | 0.038, 0.110, 1.06 |
| No. of reflections | 3260 | 3168 |
| No. of parameters | 203 | 253 |
| Δρmax, Δρmin (e Å−3) | 0.26, −0.21 | 0.25, −0.26 |
All H atoms were placed either according to their electron-density Q-peaks or were attached via the riding model in idealized positions. Data for both (I) and (II) are given in Table 2 ▸. Molecular overlay diagrams were generated using Mercury (Macrae et al., 2020 ▸) and DIAMOND (Putz & Brandenburg, 2019 ▸).
Description of the structures
The seized crystals contain two species (easily isolated under the microscope): a colourless prism was the synthetic cathinone (I) and a colourless parallelepiped was myo-inositol (II). Fig. 5 ▸ shows the cationic amine, the chloride counter-anion, and the water of crystallization all held together by hydrogen bonds. The hydrogen bonds of the chloride anions to the protons of the ammonium N atom are important for the packing, as illustrated in Figs. 6 ▸ and 7 ▸. A molecular diagram for (I) is given in the supporting information.
Figure 5.

The molecular structure of α-D2PV, (I). The ammonium cations are linked to one another by hydrogen bonds to Cl⋯H2O⋯Cl fragments as displayed above. This view is intended primarily to show the stereochemistry of the cationic drug; however, there are additional bonding interactions linking the elements of the lattice tightly (see Figs. 5 ▸ and 6 ▸).
Figure 6.

There are layers of cathinone cations above and below what is presented. These are not shown to avoid clutter. Generic atoms labels without symmetry codes have been used.
Figure 7.

This figure intends to show that the lattice is held together by a multitude of hydrogen bonds of the usual N—H⋯O, O—H⋯O, and Cl⋯H types, but that, in addition, there are large numbers of meaningful hydrogen-bond contacts shorter than 2.9 Å that help stabilize the lattice given their size and numbers. Generic atoms labels without symmetry codes have been used.
The overall packing is difficult to display in a single view because of its complex three-dimensional character. Fig. 6 ▸ shows additional features of the packing, which is also deceptive because it gives the impression that the cations are only linked exclusively in pairs by the Cl⋯H2O⋯Cl fragments. That such is not the case is clearly shown below.
Next, Fig. 7 ▸ shows the hydrogen bonding between the quarternary amine group of the drug, the chloride counter-anion, the water of hydration, and then the chloride of the next molecule.
There are important π–π interactions (see Fig. 8 ▸) between the phenyl rings of adjacent cations that cannot simultaneously be displayed in the figures described above.
Figure 8.

A view of the π–π interactions between the arene rings of adjacent cations in (I). Generic atoms labels without symmetry codes have been used.
The π–π interactions in this crystal are very substantial; the C—C distances between the rings range from 3.6600 (17) to 3.6985 (17) Å. These belong to the short type as discussed by Janiak (2000 ▸), whose paper gives a critical account on π–π stacking in metal complexes with aromatic nitrogen-containing ligands. The ring centroids here are 3.684 Å apart, and the angle between the normal to the planes of the two phenyl rings is 108.9°.
It is interesting to note that there is another interaction between the aromatic moieties in this structure, namely, that the cations depicted in Fig. 8 ▸ also contain a face-to-edge contact depicted in Fig. 9 ▸. Note that atoms C9 and C10 (H atoms omitted for clarity) interact closely with those of C14 [4.3277 (18) Å] and C15 [4.690 (2) Å] (symmetry code: x +
 , y +
, z). Thus, the entire lattice becomes very tightly bound.
, y +
, z). Thus, the entire lattice becomes very tightly bound.
Figure 9.

Pairs, similar to those in Fig. 7 ▸, interact as shown here. Generic atoms labels without symmetry codes have been used.
The sugar inositol, (II) – the diluent
The sugar inositol, (II), crystallizes with two molecules in the asymmetric unit (Z′ = 2), depicted in Fig. 10 ▸. A molecular diagram for (II) is given in the supporting information.
Figure 10.

The two molecules of inositol, (II), in the asymmetric unit are shown with the numbering system necessary to describe the overlay diagram shown in Fig. 10 ▸.
It is clear that the pair are related by a ‘near inversion’ noncrystallographic center located between the O2/O12 and O3/O7 pairs.
It is notable that the heavy-atom skeleton (C and O) matches so exactly that one can hardly discern the fact that there are two independent molecules superimposed on one another here. The most notable differences are in the cases of H4 with H7 and H1 with H10. A list of the O—H⋯O hydrogen-bond distances for (II) is given in Table 3 ▸. This superposition diagram (overlay, Fig. 11 ▸) was generated by Mercury (Groom et al., 2016 ▸) and DIAMOND (Putz & Brandenburg, 2019 ▸).
Table 3. Hydrogen-bond geometry (Å, °) for (II) .
| D—H⋯A | D—H | H⋯A | D⋯A | D—H⋯A |
|---|---|---|---|---|
| O1—H1⋯O3i | 0.831 (19) | 1.85 (2) | 2.6771 (14) | 175.1 (17) |
| O2—H2⋯O6ii | 0.854 (19) | 1.779 (19) | 2.6274 (13) | 171.4 (17) |
| O3—H3⋯O12 | 0.853 (19) | 1.885 (19) | 2.7229 (14) | 167.3 (17) |
| O4—H4⋯O10iii | 0.842 (19) | 2.071 (19) | 2.8461 (14) | 152.9 (16) |
| O5—H5⋯O1iv | 0.859 (19) | 1.922 (19) | 2.7797 (13) | 176.8 (17) |
| O6—H6⋯O4i | 0.852 (19) | 1.79 (2) | 2.6403 (14) | 171.8 (17) |
| O7—H7⋯O2 | 0.854 (19) | 1.861 (19) | 2.6915 (14) | 163.8 (16) |
| O8—H8⋯O1ii | 0.869 (19) | 1.979 (19) | 2.7943 (14) | 155.6 (16) |
| O9—H9⋯O10v | 0.850 (19) | 1.934 (19) | 2.7767 (14) | 171.3 (17) |
| O10—H10⋯O8vi | 0.871 (19) | 1.865 (19) | 2.7228 (14) | 167.5 (16) |
| O11—H11⋯O7vi | 0.804 (19) | 1.838 (19) | 2.6382 (14) | 173.8 (18) |
| O12—H12⋯O11iii | 0.829 (19) | 1.843 (19) | 2.6671 (14) | 172.3 (17) |
Symmetry codes: (i)
 ; (ii)
 ; (iii)
 ; (iv)
 ; (v)
; (v)
 ; (vi)
 .
.
Figure 11.

Overlay diagram of the two molecules of inositol (II).
Inositol is not chiral, which may appear as odd at first, since we are accustomed to the fact that the most common sugars we deal with are so. However, this is a misconception inasmuch as there are many nonchiral sugars, as can be found in standard sources. Myo-inositol is an interesting sugar present in the brain, as well as other tissues, where it mediates cell transduction in response to certain hormones and neurotransmitters. It is active in processes such as growth and osmoregulation. Thus, it was of more than passing interest in finding it present in a confiscated packet of street drugs where it was obviously being used as a diluent to maximize profits of the dealers. Usually, the diluents are powdered milk or other common materials, not a more sophisticated material such as myo-isositol.
Space group and unit-cell constant determination (see Table 2 ▸) revealed that these crystals are monoclinic (space group P21/n) and whose unit-cell constants exactly matched those of CSD refcode MYINOL02 (Rebecca et al., 2012 ▸); these two are identical having been determined at 100 K and refined to basically the same R factors. But, a most important issue is that ours is the only documented sample of a street drug diluent obtained from a police seizure, whereas MYINOL02 was obtained from an extract of Asian Dragon Fruit. Thus, the current structure must be characterized in its totality in order to be used as a reference standard for future legal proceedings.
These sugar molecules are linked by a very elaborate set of three-dimensional hydrogen bonds that are illustrated in Fig. 12 ▸.
Figure 12.

The intricate hydrogen bonding in (II) is quite powerful. The numerical data are presented in Table 3 ▸.
Discussion
Gas chromatography
In the GC–EI–MS analysis of the drug compound α-D2PV, (I), an additional peak was observed at retention time 11.20 min, 0.17 min after the compound of interest at 11.03 min. This peak is routinely observed in cathinone samples due to thermal degradation occurring in the injection port. In a study of 18 cathinones, including pyrrolidino examples, Kerrigan et al. (2016 ▸) described the oxidative degradation causing the loss of two H atoms, yielding the 2 Da mass shift in both the molecular ion and the base peak that was observed in the mass spectrum of the additional peak in this compound.
π–π bonding between the drug molecules
The criterion for meaningful contacts between aromatic fragments labeled ‘π–π interactions’ in the report by Janiak (2000 ▸) suggests that, given the experimental data available (see Figs. 7 ▸ and 8 ▸, and relevant commentary therein), the range of 3.3–3.8 Å is very reasonable indeed. Using that as an acceptable gauge, our cationic drug molecules have powerful π–π interactions, which play a very obvious role in stabilizing the lattice herein described, being 3.6600 (17)–3.6985 (17) Å for all six carbon pairs.
Conclusions
We were fortunate to obtain a confiscated packet of street drugs containing both the opiate and its diluent. They were completely characterized by a variety of analytical methods described above, including a full structural determination of both of its crystalline contents since, helpfully, both were present as high-quality X-ray analysis specimens.
Supplementary Material
Crystal structure: contains datablock(s) I, II, global. DOI: 10.1107/S2053229624000561/eq3015sup1.cif
Structure factors: contains datablock(s) I. DOI: 10.1107/S2053229624000561/eq3015Isup2.hkl
Structure factors: contains datablock(s) II. DOI: 10.1107/S2053229624000561/eq3015IIsup3.hkl
Supporting information file. DOI: 10.1107/S2053229624000561/eq3015Isup4.cml
Supporting information file. DOI: 10.1107/S2053229624000561/eq3015IIsup5.cml
Additional figures. DOI: 10.1107/S2053229624000561/eq3015sup6.pdf
Acknowledgments
The X-ray diffractometer used in these studies was purchased with support from the NSF and Rutgers University. We thank the Ocean County Sheriff’s Department for continued support and initial identification of the compound. We thank Mr Robert Rauf for the MS data and analysis. The authors have declared that no competing interests exist. Author contributions: Matthew Wood and Robert Rauf did the separations and the MS measurements. Roger Lalancette collected the X-ray data. Ivan Bernal, Roger Lalancette and Matthew Wood wrote the manuscript.
Funding Statement
Funding for this research was provided by: National Science Foundation (grant No. 2018753).
References
- Davidson, J. T., Sasiene, S. J., Abiedalla, Y., DeRuiter, J., Clark, C. R. & Jackson, G. P. (2020). Int. J. Mass Spectrom. 453, 116343.
- Dolomanov, O. V., Bourhis, L. J., Gildea, R. J., Howard, J. A. K. & Puschmann, H. (2009). J. Appl. Cryst. 42, 339–341.
- Groom, C. R., Bruno, I. J., Lightfoot, M. P. & Ward, S. C. (2016). Acta Cryst. B72, 171–179. [DOI] [PMC free article] [PubMed]
- Janiak, C. (2000). J. Chem. Soc. Dalton Trans. pp. 3885–3896.
- Kalix, P. (1992). Pharmacol. Toxicol. 70, 77–86. [DOI] [PubMed]
- Kerrigan, S., Savage, M., Cavazos, C. & Bella, P. (2016). J. Anal. Toxicol. 40, 1–11. [DOI] [PubMed]
- Kuś, P., Kusz, J., Książek, M., Pieprzyca, E. & Roikiewicz, M. (2017). Forensic Toxicol. 35, 114–124. [DOI] [PMC free article] [PubMed]
- Kuś, P., Rojkiewicz, M., Kusz, J., Książek, M. & Sochanik, A. (2019). Forensic Toxicol. 37, 456–464. [DOI] [PMC free article] [PubMed]
- Macrae, C. F., Sovago, I., Cottrell, S. J., Galek, P. T. A., McCabe, P., Pidcock, E., Platings, M., Shields, G. P., Stevens, J. S., Towler, M. & Wood, P. A. (2020). J. Appl. Cryst. 53, 226–235. [DOI] [PMC free article] [PubMed]
- Matsuta, S., Katagi, M., Nishioka, H., Kamata, H., Sasaki, K., Shima, N., Kamata, T., Miki, A., Tatsuno, M., Zaitsu, K., Tsuboi, K., Tsuchihashi, H. & Suzuki, K. (2014). Jpn J. Forensic. Sci. Tech. 19, 77–89.
- Putz, H. & Brandenburg, K. (2019). DIAMOND. Crystal Impact GbR, Bonn, Germany.
- Qian, Z., Jia, W., Li, T., Hua, Z. & Liu, C. (2017). Drug Test. Anal. 9, 778–787. [DOI] [PubMed]
- Rabinovich, I. N. & Kraut, J. (1964). Acta Cryst. 17, 159–168.
- Rebecca, O. P. S., Boyce, A. N. & Somasundram, C. (2012). Molecules, 17, 4583–4594. [DOI] [PMC free article] [PubMed]
- Rigaku OD (2022). CrysAlis PRO. Rigaku Oxford Diffraction Ltd, Yarnton, Oxfordshire, England.
- Rojkiewicz, M., Kuś, P., Kusz, J., Książek, M. & Sochanik, A. (2020). Forensic Toxicol. 38, 481–489.
- Sheldrick, G. M. (2015a). Acta Cryst. C71, 3–8.
- Sheldrick, G. M. (2015b). Acta Cryst. A71, 3–8.
- Zawilska, J. B. & Wojcieszak, J. (2013). Forensic Sci. Int. 231, 42–53. [DOI] [PubMed]
- Zuba, D. (2012). TrAC Trends Anal. Chem. 32, 15–30.
Associated Data
This section collects any data citations, data availability statements, or supplementary materials included in this article.
Supplementary Materials
Crystal structure: contains datablock(s) I, II, global. DOI: 10.1107/S2053229624000561/eq3015sup1.cif
Structure factors: contains datablock(s) I. DOI: 10.1107/S2053229624000561/eq3015Isup2.hkl
Structure factors: contains datablock(s) II. DOI: 10.1107/S2053229624000561/eq3015IIsup3.hkl
Supporting information file. DOI: 10.1107/S2053229624000561/eq3015Isup4.cml
Supporting information file. DOI: 10.1107/S2053229624000561/eq3015IIsup5.cml
Additional figures. DOI: 10.1107/S2053229624000561/eq3015sup6.pdf