

Abstract
Objectives:
To present a routine contrast-enhanced chest CT protocol with a split-bolus injection technique achieving combined early- and delayed phase images with a single aquisition, and to compare this technique with a conventional early-phase single-bolus chest CT protocol we formerly used at our institution, in terms of attenuation of great thoracic vessels, pleura, included hepatic and portal venous enhancement, contrast-related artifacts, and image quality.
Methods:
A total of 202 patients, who underwent routine contrast-enhanced chest CT examination aquired with either conventional early-phase single-bolus technique (group A,n = 102) or biphasic split-bolus protocol (group B,n = 100), were retrospectively included. Attenuation measurements were made by two radiologists independently on mediastinal window settings using a circular ROI at the following sites: main pulmonary artery (PA) at its bifurcation level, thoracal aorta (TA) at the level of MPA bifurcation,portal vein (PV) at porta hepatis, left and right hepatic lobe, and if present, thickened pleura (>2 mm) at the level with the most intense enhancement. Respective normalized enhancement values were also calculated. Contrast-related artifacts were graded and qualitative evaluation of mediastinal lymph nodes was performed by both reviewers independently. Background noise was measured and contrast-to-noise ratios (CNRs) of the liver and TA were calculated.
Results:
While enhancement of thoracic vessels and normalised MPA enhancement did not differ significantly between both groups (p > 0.05), enhancement and normalised enhancement of pleura, liver parenchyma and PV was significantly greater in group B (p < 0.001). Perivenous artifacts limiting evaluation were less frequent in group B than in A and mediastinal lymph nodes were judged to be evaluated worse in group A than in group B with an excellent agreement between both observers. No significant difference was detected in CNRTA (p = 0.633), whereas CNR liver was higher in group B (p < 0.001).
Conclusion:
Our split-bolus chest CT injection protocol enables simultaneous enhancement for both vascular structures and soft tissues, and thus, might raise diagnostic confidence without the need of multiple acquisitions.
Advances in knowledge:
We think that this CT protocol might also be a promising alternative in lung cancer staging, where combined contrast-enhanced CT of the chest and abdomen is indicated. We therefore suggest to further evaluate its diagnostic utility in this setting, in particular in comparison with a late delayed chest-upper abdominal CT imaging protocol.
Introduction
Chest CT injection protocols vary depending on the clinical indication and anatomic structure to be examined. Whereas an early delay is required for the assessment of mediastinal vessels, a late delay scan is performed for a better enhancement of normal soft tissues (e.g., chest wall and pleura), any thoracic masses and the partly included upper abdominal structures, particularly the liver.
Depending on the clinical context, an adequate opacification of both the vessels and soft tissues might be desirable. This may be possible through multiple acquisitions, albeit with the expense of increased radiation dose to the patient.
Therefore, several studies suggested the use of split – bolus injection techniques, whereby the volume of contrast medium is split into two or three boluses and imaging is performed in a single scan. 1–3
However, to our knowledge, most of the previous research involved studies that have primarily focused on vascular imaging, 2–5 and thus, whether the routine chest CT can be improved by a split-bolus injection is obscure.
The aim of this study is to compare a split-bolus technique with the conventional single-bolus early-phase chest CT protocol previously utilised at our instution in terms of (a) attenuation of major mediastinal vessels, pleura, and upper abdominal structures, (b) contrast-to-noise ratio (CNR) and (c) contrast-related perivenous artifacts.
Methods and materials
This study was approved by the institutional review board and was performed according to the regulations of the local ethics committee for retrospective studies.
Study population
The Radiology Information System/Picture Archiving and Communication System (RIS/PACS; Centricity 5.0 RIS-i, GE Healthcare, Milwaukee, WI, USA) of the institution was used to identify patients who underwent chest CT imaging performed with a conventional early-phase protocol from October to November 2011 and with a biphasic split-bolus protocol from October to November 2020.
Inclusion criterion of this study was the availability of chest CT images in our institutional RIS/PACS acquired with either a conventional early-phase single-bolus injection technique formerly used at our institution or a biphasic split-bolus injection protocol we routinely perform since December 2011.
Patients were excluded if any device-related technical problem during contrast injection was stated by the performing radiologic technician (N = 5) .
Liver attenuation measurements from patients with clearly prominent diffuse hepatic steatosis were excluded from liver analysis by consensus of the two readers.
CT protocols
CT examinations were performed using a conventional single-bolus injection protocol (conventional group) on an 8-dedector row CT scanner (General Electric Healthcare Light Speed Ultra, Milwaukee, Wisconsin, USA) or a biphasic split-bolus contrast injection protocol (split bolus group) on a 16-dedector row CT scanner (GE BrightSpeed S, Milwaukee, Wisconsin, USA).
The acquisition parameters are listed in Table 1. Patients were imaged in the supine position with the arms above the head in a cephalocaudad direction. Scan range extented from the lung apices to the adrenal glands.
Table 1.
Computed Tomography Image Acquisition Parameters
| Parameters | GE
LightSpeed Ultra, (Milwaukee, Wisconsin, USA) |
GE
BrightSpeed S (Milwaukee, Wisconsin, USA) |
|---|---|---|
| Detector row | 8 | 16 |
| Reconstruction interval (mm) | 1.7 | 0.8 |
| Detector collimation (mm) | 1.25 | 0.5 |
| Reconstructed section thickness (mm) | 2.5 | 2.5 |
| Pitch | 1.675 | 0.83 |
| Tubevoltage (kvP) | 120 | 120 |
| Milliamperage setting | Automatic | Automatic |
| Reconstruction algorithm | Standard | Standard |
In the conventional group (group A), 0.8 mL/kg (min-max; 50–100 ml) was administered using a single-barrel power injector (Vistron CT, Medrad, USA) at a rate of 2–3 mL/sec. Fixed delay time was 22 s after the start of the injection.
In the split-bolus group (group B), a total of 100-ml contrast agent was split into an initial bolus of 70 ml and a second bolus of 30 ml injected at a rate of 2–3 mL/s using a dual-barrel power injector (Imaxeon, AU). Saline flushes were administered after each contrast bolus at the same injection rate. Imaging was performed at a fixed delay time of 60 or 70 s after the start of the initial injection.
The injection protocols for the split-bolus group are detailed in Figure 1.
Figure 1.

Computed Tomography Injection Protocol in the Split-Bolus Group
Intravenous contrast agent utilised was Iohexol 350 mg ml−1 (Omnipaque, GE Healthcare, Princeton, NJ). Injections were made through an 18–20 G cannula via an antecubital vein in both groups.
CT image analysis
All images were reviewed on a GE Centricity 2.0 PACS Workstation (GE Healthcare, WI, USA) independently by two radiologists (MK, DKO) with ≥7 years of experience in chest CT interpretation.
Attenuation measurements were made on mediastinal window settings (window level 40–50 HU, window width 400–500 HU) independently by both readers using a circular ROI in the main pulmonary artery (MPA) at its bifurcation level, thoracic aorta (TA) at the level of MPA bifurcation, portal vein (PV) at porta hepatis, segments 2 and 8 of the liver and, if present, thickened pleura (≥2 mm) at the level with the most intense enhancement. The reviewers used a ROI with two-thirds the diameter of the measured vessel paying attention to avoid vessel walls. When measuring pleural attenuation, pleural calcifications were avoided.
Hepatic attenuation was measured by placing a ~ 3 cm² ROI by avoiding vessels, and if present, focal steatosis and any lesions. The measurements of segments 2 and 8 were averaged for liver attenuation.
In addition, normalised enhancement values were calculated for the pulmonary artery, pleura and liver by dividing each of them by the attenuation value of the thoracic aorta.
To calculate the contrast-to-noise ratio (CNR), attenuation of subscapularis muscle was measured for both sides at the level of the fifth thoracic vertebra avoiding inclusion of fat and mean value was taken (ROIm). For background noise, a ~1 cm² ROI was drawn in three different locations in the anterior subcutaneous fat of each patient and the mean of the three standard deviations (SD) was calculated.
The calculation of CNR for both TA and liver was according to the following equation: (ROI value in TA or liver minus ROIm) divided by the background noise.
Additionally, perivenous artifacts at the level of subclavian and axillary veins on the side-of injection and bilateral brachiocephalic veins (level I) or superior vena cava (SVC) (level II) were graded independently by both observers as follows: 1, no artefact; 2, artifact not obscuring neighboured structures; 3, artifact limiting evaluation of adjacent structures.
Similarly, mediastinal lymph nodes (levels 2R, 2L and 4R) were assessed and compared between both groups by both readers according to the following scale: 1, excellent; lymph node margins clearly defined; 2, good, adjacent contrast-related artifact present but evaluation of lymph node not limited; 3, evaluation of lymph node and subsequent measurements limited.
Statistical analysis
All statistical analyses were performed using SPSS for Windows v. 11.5 (SPSS Inc, Chicago, IL, USA). Kolmogorov-Smirnov test was used to assess the assumption of normality. Normally distributed continuous variables were expressed as mean ± standard deviation while the continuous variables that do not have normal distribution were expressed as median (minimum-maximum). Also, categorical variables were summarized as counts (n) and percentages (%). For enhancement and normalized enhancement values, the differences between groups were tested using Student’s t test/Mann-Whitney U Test. Comparisons of artifacts between groups were performed using Pearson Chi-Square/Fisher Exact Test. Intraclass Correlation Coefficient (ICC) for density values and weighted κ coefficient for artifacts were used for interrater agreement. Density values measured by the the principal observer and artifact grading results by both observers were presented. A two-sided p-value < 0.05 was considered statistically significant.
Results
Patient characteristics
A total of 102 patients in group A and 100 patients in group B with one CT examination per patient were included in our study. Ninety-four patients were male (47 in group A and 47 in group B). The mean age was 53.6 ± 10.2 in group A and 55.6 ± 12.1 in group B. There was no significant difference between both groups regarding gender (p = 0.896) or age (p = 0.075).
Pleural thickening/lesions were present in 32 (31.4%) patients in group A and 23 (23%) patients in the group B. Pleural thickening/lesions were considered to be benign due to CT imaging features and comparison with follow-up examinations in 24 (75%) patients of group A and 20 (86.6%) patients of group B.
Hepatic steatosis was present in 39 patients (18 (17.6%) in group A, 21 (21.0%) in group B).
Chest CT indications are summarised in Table 2. The most common clinical indications were suspicion/staging/follow-up of lung cancer, in 54 (52.9%) patients of group A and 50 (50.0%) patients of group B.
Table 2.
Indications for Computed Tomography Imaging in Conventional and Split-bolus groups
| Indication | Conventional Group N (%) |
Split-Bolus Group N (%) |
|---|---|---|
| Lung cancer | 54 (52.9) | 50 (50.0) |
| Clinical/radiologic suspicion | 22 (21.6) | 22 (22.0) |
| Staging/Follow-up | 32 (31.4) | 28 (28.0) |
| Malignant mesothelioma | 4 (0.04) | 2 (2.0) |
| Clinical/radiologic suspicion | 3 (0.03) | 2 (2.0) |
| Follow-up | 1 (0.01) | - |
| Other primary malignancies | ||
| Follow-up | 15 (0.15) | 32 (32.0) |
| Tuberculosis | 4 (0.04) | 1 (1.0) |
| Sarcoidosis | 2 (0.02) | 4 (4.0) |
| Thymoma | 4 (0.04) | 0 |
| Bacterial/fungal infection | 1 (0.01) | 2 (2.0) |
| Miscellaneous | 18 (17.6) | 9 (9.0) |
CT image analysis
There was no statistically significant difference in attenuation of TA, MPA and normalized MPA between both groups (p = 0.97, 0.241, 0.257, respectively).
TA attenuation values less than 150 HU were obtained in 2 (0.02%) patients of group A and 5 patients (5%) of group B. MPA attenuation below 150 HU was measured in 37 (36.3%) patients in group A and in 32 (32%) patients in group B. In group A, out of the 37 patients with MPA attenuation less than 150 HU, attenuation of TA was ≥150 HU in 35 patients, and ≥200 HU in 30 patients. In group B, out of 32 patients with MPA attenuation less than 150 HU, attenuation of TA was ≥150 HU in 28 patients, and ≥200 HU in 21 patients.
In the subset of 163 patients without diffuse steatosis (84 in group A, 79 in group B), liver attenuation was significantly higher in group B compared to group A (median liver attenuation (min-max): 106.5 (85.5–137.5) HU in group B vs 71 (61–102.5) HU in group A) (p < 0.001) (Figures 2 and 3).
Figure 2.
27-year-old female patient with thymoma. Routine chest CT imaging obtained with the conventional early-phase protocol. Axial image shows hepatic enhancement consistent with arterial phase.
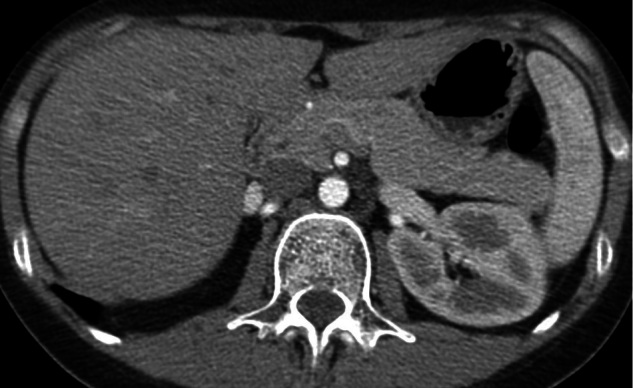
Figure 3.

47-year-old female patient with suspicion of lung malignancy. Routine chest CT imaging obtained with the split-bolus protocol. Axial image shows hepatic enhancement consistent with portal venous phase.
PV attenuation was also significantly greater in group B (163.3 ± 29.2 HU) than in group A (90.3 ± 24.6 HU) (p < 0.001).
In patients with pleural thickening/lesions (32 in group A, 23 in group B), pleural attenuation was significantly higher in group B than in group A (median pleural attenuation (min-max): 76.0 (48.0–112.0) HU in group B vs 51.5 (27–80) HU in group A) (p < 0.001) .
Normalized liver, PV and pleural enhancement values were also significantly higher in group B than in A (p < 0.001, respectively).
While CNRLiver was significantly greater in group B than in group A (p < 0.001), CNRTA did not differ significantly between both groups (p = 0.633).
Interreader agreement was good to excellent, except for noise measurement, which revealed a moderate reliability (ICC value: 0.724 (95%: 0.651–0.783)).
CT image analysis results and corresponding ICC values are detailed in Table 3.
Table 3.
Quantitative Analysis Results in Conventional and Split-Bolus Groups
| Parameter | Conventional Group | Split-Bolus Group | P | ICC (95% CI) |
||||||||
|---|---|---|---|---|---|---|---|---|---|---|---|---|
| N | Mean | SD | Median | Min-Max | N | Mean | SD | Median | Min-Max | |||
| Thoracic aorta attenuation (HU) | 102 | 238.1 | 40.0 | 238 | 137–378 | 100 | 237.8 | 53.6 | 244.5 | 127–369 | 0.97 b | 0.982 (0.977–0.986) |
| Pulmonary artery attenuation (HU) | 102 | 180.7 | 65.9 | 175 | 74–407 | 100 | 167.5 | 42.4 | 160.5 | 93–386 | 0.241 a | 0.988 (0.984–0.991) |
| Normalised Pulmonary artery attenuation | 102 | 0.78 | 0.28 | 0.76 | 0.30–1.59 | 100 | 0.74 | 0.24 | 0.69 | 0.36–1.61 | 0.257 a | |
| Portal vein attenuation (HU) | 102 | 90.3 | 24.6 | 89.0 | 45–179 | 100 | 126.4 | 45.4 | 158.5 | 105–233 | <0.001 b | 0.990 (0.986–0.992) |
| Normalised portal vein attenuation | 102 | 0.39 | 0.12 | 0.36 | 0.19–0.80 | 100 | 0.72 | 0.20 | 0.65 | 0.41–1.20 | <0.001 a | |
| Liver
attenuation (Average of left+right lobe) (HU) |
84 | 71.8 | 6.6 | 71.0 | 61–102.5 | 79 | 108.2 | 11.4 | 106.5 | 85.5–137.5 | <0.001 a | 0.992 (0.989–0.994) |
| Normalised liver attenuation | 84 | 0.31 | 0.06 | 0.30 | 0.19–0.51 | 79 | 0.48 | 0.12 | 0.45 | 0.27–0.83 | <0.001 a | |
| Left liver lobe attenuation (HU) | 84 | 73.6 | 7.8 | 73.0 | 60.0–102.0 | 79 | 109.6 | 11.6 | 108.0 | 87.0–144.0 | <0.001 a | 0.968 (0.956–0.976) |
| Right liver lobe attenuation (HU) | 84 | 70.1 | 6.4 | 69 | 59.0–103.0 | 79 | 105.0 | 13.4 | 102.5 | 84.0–138.0 | <0.001 a | 0.974 (0.964–0.981) |
| Pleura (HU) | 32 | 50.6 | 13.8 | 51.5 | 27–80 | 23 | 79.0 | 16.6 | 76 | 48–112 | <0.001 b | 0.918 (0.863–0.952) |
| Normalised Pleura | 32 | 0.22 | 0.07 | 0.23 | 0.10–0.37 | 23 | 0.33 | 0.008 | 0.32 | 0.20–0.50 | <0.001 b | |
| Noise (HU) | 102 | 10.8 | 0.81 | 11 | 9–13 | 100 | 11.05 | 1.0 | 11 | 9–14 | 0.117 a | 0.724 (0.651–0.783) |
| Hepatic contrast-to-noise ratio | 84 | 0.77 | 0.64 | 0.69 | −0.50–3.04 | 79 | 4.05 | 0.98 | 4.0 | 2.14–7.56 | <0.001 a | 0.975 (0.966–0.942) |
| Contrast-to-noise ratio of the thoracic aorta | 102 | 16.20 | 3.81 | 16.1 | 7.27–28.64 | 100 | 15.9 | 5.28 | 15.52 | 5.73–32.56 | 0.663 a | 0.955 (0.941–0.966) |
Mann - Whitney U test.
Student’s t test.
Contrast-related perivenous artifacts were significantly less severe in group B than in group A at both levels with an excellent agreement between both observers (Table 4, Figures 4 and 5). Mediastinal lymph node evaluation was judged to be significantly worse in group A than in group B by both readers (Table 5).
Table 4.
Perivenous Contrast-Related Artifacts in Conventional and Split-Bolus group
| Grade | Conventional group N = 102 (%) |
Split-bolus group N = 100 |
P | κ (95% CI) |
|---|---|---|---|---|
| Axillary artifact | <0.001 | 0.890 (0.825–0.955) | ||
| Reader 1 | ||||
| 1 | 0 | 9 (9.0) | ||
| 2 | 3 (2.9) | 51 (51.0) | ||
| 3 | 99 (97.1) | 40 (40.0) | ||
| Reader 2 | <0.001 | |||
| 1 | 0 | 9 (9.0) | ||
| 2 | 1 (1.0) | 42 (42.0) | ||
| 3 | 101 (99.0) | 49 (49.0) | ||
| Caval artifact | <0.001 | 0.896 (0.849–0.942) | ||
| Reader 1 | ||||
| 1 | 4 (3.9) | 42 (42.0) | ||
| 2 | 22 (21.6) | 51 (51.0) | ||
| 3 | 76 (74.5) | 7 (7.0) | ||
| Reader 2 | <0.001 | |||
| 1 | 2 (2.0) | 49 (49.0) | ||
| 2 | 17 (16.7) | 44 (44.0) | ||
| 3 | 83 (81.4) | 7 (7.0) | ||
Figure 4.

(a–b) 60 year old male patient with lung cancer. Routine chest CT imaging obtained with the conventional early-phase protocol for follow-up. Note contrast-related perivenous artifacts in axial image (a) and coronal reformatted image (b) in the right brachiocephalic vein and superior vena cava limiting evaluation of perivenous structures, in particular at the right infraclavicular level.
Figure 5.

(a–b) 61 year old female patient with endometrium cancer. Routine chest CT imaging obtained with the biphasic split-bolus protocol for evaluation of metastasis. Axial image (a) and coronal reformatted image (b) without any contrast-related perivenous artifacts.
Table 5.
Qualitative Mediastinal Lymph Node Assessment in Conventional and Split-Bolus Groups
| Grade | Conventional group N = 102 (%) |
Split-bolus group N = 100 |
P | κ (95% CI) |
|---|---|---|---|---|
| 2R Lymph Nodes | <0.001 | 0.944 (0.912–0.976) | ||
| Reader 1 | ||||
| 1 | 10 (9.8) | 76 (76) | ||
| 2 | 23 (22.5) | 14 (14) | ||
| 3 | 69 (67.6) | 10 (10) | ||
| Reader 2 | <0.001 | |||
| 1 | 12 (11.8) | 75 (75) | ||
| 2 | 17 (16.7) | 15 (15) | ||
| 3 | 73 (71.6) | 10 (10) | ||
| 2L Lymph Nodes | <0.001 | 0.906 (0.842–0.971) | ||
| Reader 1 | ||||
| 1 | 71 (69.6) | 91 (91.0) | ||
| 2 | 24 (23.5) | 6 (6.0) | ||
| 3 | 7 (6.9) | 3 (3.0) | ||
| Reader2 | <0.001 | |||
| 1 | 67 (65.7) | 90 (90.0) | ||
| 2 | 29 (28.4) | 7 (7.0) | ||
| 3 | 6 (5.9) | 3 (3.0) | ||
| 4R Lymph Nodes | <0.001 | 0.942 (0.909–0.976) | ||
| Reader 1 | ||||
| 1 | 9 (8.8) | 67 (67.0) | ||
| 2 | 24 (23.5) | 25 (25.0) | ||
| 3 | 69 (67.6) | 8 (8.0) | ||
| Reader2 | <0.001 | |||
| 1 | 8 (7.8) | 65 (65.0) | ||
| 2 | 19 (18.6) | 27 (27.0) | ||
| 3 | 75 (73.5) | 8 (8.0) | ||
Discussion
To the best of our knowledge, this is the first study to systematically compare a routine, single-bolus early-phase chest CT protocol with simultaneous early- and delayed phase CT imaging using split-bolus contrast injection with a special focus on pleural and hepatic enhancement.
Soft tissue structures including the pleura, liver parenchyma and portal vein enhanced to a better degree with the split bolus technique, while enhancement of the mediastinal vessels did not differ significantly between both groups.
This study revealed significantly higher mean pleural enhancement in the split bolus group compared to the single bolus group. This finding emphasises the results of previous studies, which suggest that pleura is enhancing with a late delay. 6,7 Pleural attenuation values observed in the split-bolus group are comparable to these studies imaging the pleura in a delayed phase. Previous studies found that since there is a lack of pleural enhancement during the early phase, pleural thickening or lesions might not be detected, especially when accompanied by effusion. 8
It is well known that most liver lesions are hypovascular and can be more confidently depicted in portal venous than in arterial phase. 9 A higher enhancement of the liver in the split bolus technique may potentially enable the detection of more hypovascular lesions including metastases of a lung cancer. 10 Non-enhanced normal liver attenuation ranges from 50 to 70 HU and an adequate hepatic enhancement has been acknowledged as more than 50 HU, resulting in liver attenuation values of at least 100–120 HU for appropriate imaging. 11,12 Post-contrast liver attenuation which reached that range with our split bolus technique can thus be considered as sufficient for optimal hepatic evaluation.
With regard to an adequate mediastinal vessel enhancement, Bae et al indicated that attenuation of at least 150 HU is considered to be sufficient in routine chest imaging. 13 In our study, this was achieved in the majority of examinations with both protocols without any siginificant difference between both groups, although the volume of contrast medium which contributes more to mediastinal vascular enhancement was smaller in the split-bolus group (30 ml) than in the single bolus group. This might be due to the effect of re-circulation of the first contrast bolus and the use of a saline chaser in the split-bolus group. 14
In approximately one-third of patients in both groups, main pulmonary artery attenuation was below 150 HU. In 94.6 and 87.5% of these patients in split-bolus group and control group, respectively, aortic attenuation was above 150 HU. We believe the lesser pulmonary arterial as compared to aortic enhancement may result from dilution with unenhanced blood flow emanating from inferior vena cava, which was previously shown to be due to deep breathing at the beginning of scanning. 15,16
In our study, indication for contrast-enhanced chest CT was lung cancer suspicion, staging or follow-up in roughly half of the patients in both groups. We suggest that split bolus technique might also be considered for use in lung cancer staging, where combined contrast-enhanced CT of the chest and abdomen is indicated. Actually, commonly used lung cancer staging protocols involve a single-delayed acquisition of the chest and abdomen or separate acquisitions of the chest in an early phase and abdomen in the portal venous phase. 8,17 Garcia-Garrigos et al 8 compared both protocols in lung cancer patients and in conclusion suggested a delayed single scan. They found artifacts originating from dense contrast material in the superior vena cava obscuring the perivenous mediastinal structures such as lymph nodes in the early-phase chest CT. On the other hand, if the mediastinal vessels are not opacified sufficiently, this may also hinder the discrimination between lymph nodes and vessels and evaluation of the relationship of masses with major vessels. Moreover, perivenous contrast-related artifacts might also raise the local absorbed radiation dose since higher iodine concentrations are known to be associated with a higher radiation dose, most likely due to an increased photoelectric absorption. 18,19 To diminish contrast-related artifacts, previous studies suggested reducing contrast dose and using a saline push after contrast injection. 8,20,21 Our findings show reduced contrast-related artifacts in the split bolus technique, probably owing to both the scan timing and use of a saline chaser.
In addition, since our split-bolus protocol revealed an adequate simultaneous enhancement for both thoracic and upper ubdominal structures with a single acquisition its potential benefitial effect in terms of reducing effective radiation dose is obvious when compared to routine multiphasic imaging.
Our study has a number of limitations. First, the main limitation of our study was that total contrast volume differed between groups with a larger total volume in the split-bolus group. We aimed to achieve a biphasic image through splitting the contrast volume into an initial 70 ml allowing a sufficient hepatic and pleural enhancement and a second 30 ml bolus to obtain an adequate arterial phase. In the control group images were aquired after an early scan delay (22 s) with a conventional continuous injection of 50–100 ml contrast volume for arterial enhancement. The administration of a fixed amount of 100 ml contrast volume in each patient of the split-bolus group is in concordance with previous studies using the split-bolus protocol for chest CT imaging. 1,3
We tried to overcome this limitation in terms of comparability and calculated normalized enhancement values by dividing the respective attenuation values through thoracal aortic enhancement and compared these between both groups. Further studies might assess, if sufficient simultaneous enhancement of mediastinal vessels and soft tissues, in particular, the included liver parenchyma can be achieved with body-weight-adjusted split-bolus protocols resulting in smaller contrast boluses. Second, this was a retrospective study using different CT scanners with different row sizes. This is due to the fact that since the split-bolus chest CT protocol was introduced in our institution the conventional early phase technique is no longer used. However, examinations were performed with CT scanners using the same reconstruction algorithm, kilovoltage and milliamperage setting. Additionally, we calculated CNRs of the TA and liver to evaluate consistency of results and image quality. Third, saline chaser was not used in the conventional group and thus the effects of using a saline chaser and splitting the contrast volume in two boluses with a second smaller contrast bolus immediately before scan initiation could not be evaluated independently from each other, particularly in terms of reducing perivenous artifacts. This should be further investigated with a study design comparing a conventional with a split-bolus protocol in which both include a saline chaser.
Fourth, diagnostic accuracy of the split-bolus and conventional single bolus techniques with regard to detection or staging of chest malignancies was not assessed. We recommend that this should be the focus of future studies when comparing these two techniques.
In conclusion, split-bolus chest CT injection protocol enables simultaneous enhancement for both vascular structures and soft tissues, and thus, might raise diagnostic confidence without the need of multiple acquisitions. We think, that this CT protocol is also a promising alternative in lung cancer staging. We therefore suggest to further evaluate its diagnostic utility in this setting, in particular in comparison with a late delayed chest-upper abdominal CT imaging protocol.
Footnotes
Ethical approval: The authors obtain an institutional review approval for the study in this paper.
Contributor Information
Melahat Kul, Email: melahatkul@yahoo.com, Department of Radiology, School of Medicine, Ankara University, Ankara, Turkey .
Diğdem Kuru Öz, Department of Radiology, School of Medicine, Ankara University, Ankara, Turkey .
Ayşegül Gürsoy Coruh, Email: draysegulgursoy@gmail.com, Department of Radiology, School of Medicine, Ankara University, Ankara, Turkey .
Funda Özalp Ateş, Email: funda.ozalp@gmail.com, Department of Biostatistics, School of Medicine, Manisa Celal Bayar University, Manisa, Turkey .
Başak Gülpınar, Email: basak.gulpinar@yahoo.com, Department of Radiology, School of Medicine, Ankara University, Ankara, Turkey .
Çağlar Uzun, Email: cuzun77@yahoo.com, Department of Radiology, School of Medicine, Ankara University, Ankara, Turkey .
K.Çetin Atasoy, Email: catasoy@kuh.ku.edu.tr, Department of Radiology, School of Medicine, Koç University, İstanbul, Turkey .
REFERENCES
- 1. Pretorius PC . Experiences of using a single post-contrast ct scan of the chest after biphasic contrast injection . S Afr j Radiol 2012. ; 16: 56 – 60 . doi: 10.4102/sajr.v16i2.307 [DOI] [Google Scholar]
- 2. Halpern EJ . Triple-rule-out ct angiography for evaluation of acute chest pain and possible acute coronary syndrome . Radiology 2009. ; 252: 332 – 45 . doi: 10.1148/radiol.2522082335 [DOI] [PubMed] [Google Scholar]
- 3. Meena P, Bhalla AS, Goyal A, Sharma R, Kumar A, et al. . Single-phase split-bolus dual energy computed tomography angiography for evaluation of hemoptysis: a novel application . J Thorac Imaging 2018. ; 33: 366 – 76 . doi: 10.1097/RTI.0000000000000337 [DOI] [PubMed] [Google Scholar]
- 4. Zein-El-Dine S, Bou Akl I, Mohamad M, Chmaisse A, Chahwan S, et al. . Split-bolus contrast injection protocol enhances the visualization of the thoracic vasculature and reduced radiation dose during chest ct . Br J Radiol 2018. ; 91( 1092 ): 20180509 . doi: 10.1259/bjr.20180509 [DOI] [PMC free article] [PubMed] [Google Scholar]
- 5. Scialpi M, Rebonato A, Cagini L, Brunese L, Piscioli I, et al. . Split-bolus single-pass multidetector-row ct protocol for diagnosis of acute pulmonary embolism . Iran J Radiol 2016. ; 13: e19844 . doi: 10.5812/iranjradiol.19844 [DOI] [PMC free article] [PubMed] [Google Scholar]
- 6. Raj V, Kirke R, Bankart MJ, Entwisle JJ . Multidetector ct imaging of pleura: comparison of two contrast infusion protocols . Br J Radiol 2011. ; 84: 796 – 99 . doi: 10.1259/bjr/55980445 [DOI] [PMC free article] [PubMed] [Google Scholar]
- 7. Arenas-Jiménez JJ, García-Garrigós E, Escudero-Fresneda C, Sirera-Matilla M, García-Pastor I, et al. . Early and delayed phases of contrast-enhanced ct for evaluating patients with malignant pleural effusion. results of pairwise comparison by multiple observers . Br J Radiol 2018. ; 91( 1089 ): 20180254 . doi: 10.1259/bjr.20180254 [DOI] [PMC free article] [PubMed] [Google Scholar]
- 8. García-Garrigós E, Arenas-Jiménez JJ, Sánchez-Payá J . Best protocol for combined contrast-enhanced thoracic and abdominal ct for lung cancer: a single-institution randomized crossover clinical trial . AJR Am J Roentgenol 2018. ; 210: 1226 – 34 . doi: 10.2214/AJR.17.19185 [DOI] [PubMed] [Google Scholar]
- 9. Baron RL . Understanding and optimizing use of contrast material for ct of the liver . AJR Am J Roentgenol 1994. ; 163: 323 – 31 . doi: 10.2214/ajr.163.2.8037023 [DOI] [PubMed] [Google Scholar]
- 10. Rengo M, Caruso D, De Cecco CN, Lucchesi P, Bellini D, et al. . High concentration (400 mgi/ml) versus low concentration (320 mgi/ml) iodinated contrast media in multi detector computed tomography of the liver: a randomized, single centre, non-inferiority study . Eur J Radiol 2012. ; 81: 3096 – 3101 . doi: 10.1016/j.ejrad.2012.05.017 [DOI] [PubMed] [Google Scholar]
- 11. Tisch C, Brencicova E, Schwendener N, Lombardo P, Jackowski C, et al. . Hounsfield unit values of liver pathologies in unenhanced post-mortem computed tomography . Int J Legal Med 2019. ; 133: 1861 – 67 . doi: 10.1007/s00414-019-02016-1 [DOI] [PubMed] [Google Scholar]
- 12. Heiken JP, Brink JA, McClennan BL, Sagel SS, Crowe TM, et al. . Dynamic incremental ct: effect of volume and concentration of contrast material and patient weight on hepatic enhancement . Radiology 1995. ; 195: 353 – 57 . doi: 10.1148/radiology.195.2.7724752 [DOI] [PubMed] [Google Scholar]
- 13. Bae KT . Optimization of contrast enhancement in thoracic mdct . Radiol Clin North Am 2010. ; 48: 9 – 29 . doi: 10.1016/j.rcl.2009.08.012 [DOI] [PubMed] [Google Scholar]
- 14. Saade C, Bourne R, Wilkinson M, Brennan P . Contrast medium administration and parameters affecting bolus geometry in multidetector computed tomography angiography: an overview . J Med Imaging Radiat Sci 2011. ; 42: 113 – 17 . doi: 10.1016/j.jmir.2011.05.002 [DOI] [PubMed] [Google Scholar]
- 15. Ozawa Y, Hara M, Shibamoto Y . The frequency of insufficient contrast enhancement of the pulmonary artery in routine contrast-enhanced chest ct and its improvement with an increased injection rate: a prospective study . J Thorac Imaging 2011. ; 26: 42 – 47 . doi: 10.1097/RTI.0b013e3181ced07a [DOI] [PubMed] [Google Scholar]
- 16. Bae K, Jeon KN, Cho SB, Park SE, Moon JI, et al. . Improved opacification of a suboptimally enhanced pulmonary artery in chest ct: experience using a dual-layer detector spectral ct . AJR Am J Roentgenol 2018. ; 210: 734 – 41 . doi: 10.2214/AJR.17.18537 [DOI] [PubMed] [Google Scholar]
- 17. García Garrigós E, Arenas Jiménez JJ, Sánchez Payá J, Sirera Matilla M, Gayete Cara À . Computed tomography protocols used in staging bronchopulmonary carcinoma: results of a national survey . Radiologia 2016. ; 58: 460 – 67 . doi: 10.1016/j.rx.2016.06.005 [DOI] [PubMed] [Google Scholar]
- 18. Sahbaee P, Abadi E, Segars WP, Marin D, Nelson RC, et al. . The effect of contrast material on radiation dose at ct: part ii. a systematic evaluation across 58 patient models . Radiology 2017. ; 283: 749 – 57 . doi: 10.1148/radiol.2017152852 [DOI] [PMC free article] [PubMed] [Google Scholar]
- 19. Amato E, Salamone I, Naso S, Bottari A, Gaeta M, et al. . Can contrast media increase organ doses in ct examinations? a clinical study . AJR Am J Roentgenol 2013. ; 200: 1288 – 93 . doi: 10.2214/AJR.12.8958 [DOI] [PubMed] [Google Scholar]
- 20. Hopper KD, Mosher TJ, Kasales CJ, TenHave TR, Tully DA, et al. . Thoracic spiral ct: delivery of contrast material pushed with injectable saline solution in a power injector . Radiology 1997. ; 205: 269 – 71 . doi: 10.1148/radiology.205.1.9314997 [DOI] [PubMed] [Google Scholar]
- 21. Haage P, Schmitz-Rode T, Hübner D, Piroth W, Günther RW . Reduction of contrast material dose and artifacts by a saline flush using a double power injector in helical ct of the thorax . AJR Am J Roentgenol 2000. ; 174: 1049 – 53 . doi: 10.2214/ajr.174.4.1741049 [DOI] [PubMed] [Google Scholar]