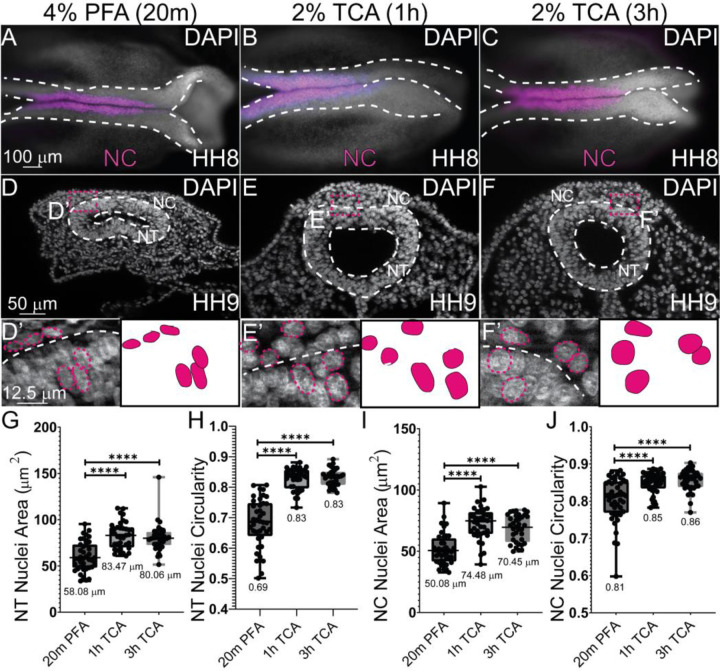
Figure 1. TCA fixation alters nuclear area and circularity.
(A-C) Wholemount chicken embryos staged HH8–9 after IHC for NC marker (SOX9) and DAPI staining (cranial region, anterior to the right). Embryos were fixed in (A, D, D’) 4% PFA for 20m (B, E, E’), 2% TCA for 1h (C, F, F’), and 2% TCA for 3h. (D-F) Transverse cryosections from HH9 embryos. (D’-F’) Zoomed in regions from (D-F) with NT outlined in white dashed lines and select nuclei in pink dashed lines. (G) The area of the NT nuclei are significantly different between PFA and the two TCA treatment incubations. The mean NT nuclei area for the PFA treated is 58.08 μm2 (n=40), 1h TCA is 83.47 μm2 (n=36), and 3h TCA is 80.06 μm2 (n=36), P ≤ 0.0001. (H) NT nuclei circularity was measured, and significant differences were observed between PFA with a mean of 0.89 (n=40) and 1h TCA with a mean of 0.83 (n=36) and 3h TCA treatment with a mean of 0.83 (n=36), P ≤ 0.0001. (I) NC cell nuclei area was measured and PFA nuclei had significantly less area, with a mean of 50.08 μm2(n=40), 1h TCA with 74.48 μm2 (n=36), and 3h TCA with a mean of 70.45 μm2 (n=36) P ≤ 0.0001. (J) NC cell nuclei circularity differed PFA and the 1hr and 3hr TCA fixation. The mean circularity for PFA NC nuclei circularity was at 0.81, the mean for 1hr TCA was 0.85, and the mean for 3h TCA is 0.86, n=36, P ≤ 0.0001. One-way ANOVA with the Mann-Whitney test was used to determine the significance. The scale bar for the wholemount images is 100 μm, the transverse sections is 50 μm, and the high magnification transverse section is 12.5 μm.

