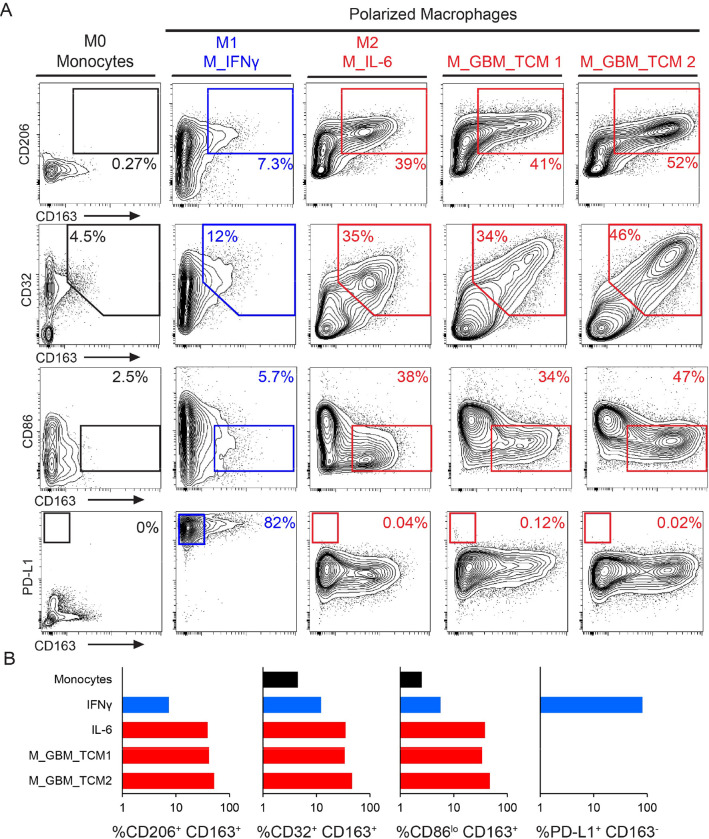
Figure 1 – M_GBM_TCM are similar to an M2 phenotype and distinct from other M2 macrophages, including M_IL-6.
A) 2D contour plots show expression of signature surface proteins CD163, CD206, CD86, and PD-L1 for each condition. Cells were either unstimulated monocytes, macrophages stimulated with IFNγ (a control for M1-like macrophages), macrophages stimulated with IL-6 (a control for M2-like macrophages), or macrophages stimulated with primary tumor conditioned media collected after 3 days of ex vivo culture (sample ID: TCM1, TCM2). B) Bar graphs display the percentage of cells included in indicated gates across conditions.

