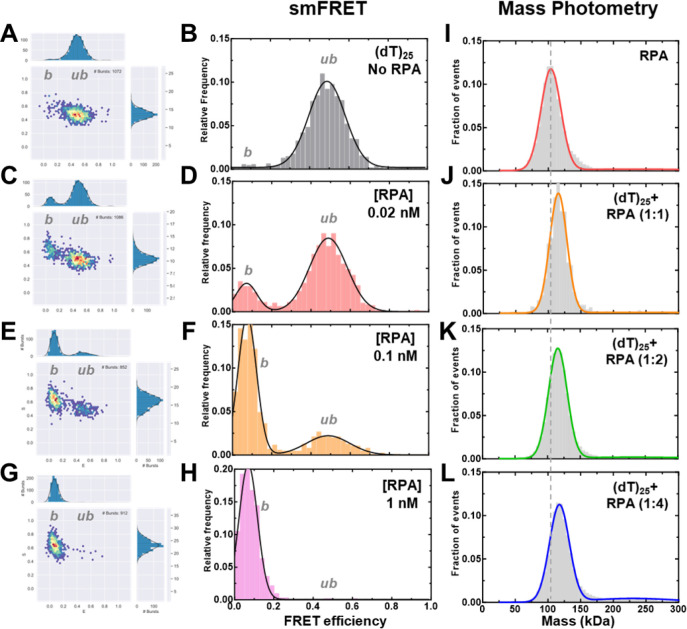
Figure 3. Concentration dependence of RPA-ssDNA complexes.
A-H) FRET analysis of (dT)25 ssDNA bound to increasing concentrations of RPA show a shift from the unbound to bound complex. As RPA concentrations are increased, a complete shift to the bound population is observed. I-L) Mass photometry analysis of RPA and RPA-(dT)25 complexes show formation of predominantly single RPA bound (dT)25 complexes.

