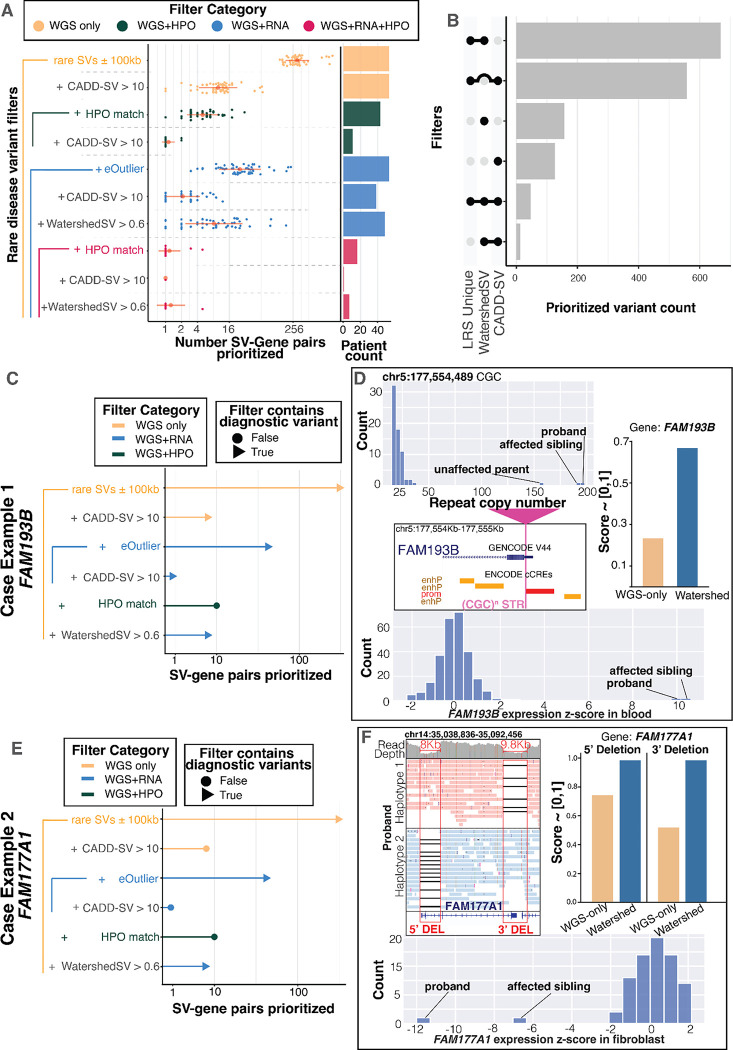
Figure 5. Watershed-SV prioritizes symptom-relevant functional rare SVs from UDN LRS dataset.
A Swarmplot for number of gene-SV pairs prioritized per individuals in the UDN LRS dataset under different set of combined filters. There are 4 filter categories: WGS-only filters, WGS + HPO filters, WGS + RNA filters, and WGS + RNA + HPO filters, in increasing level of stringency due to increasing types of filters jointly applied; red dot represent the mean number of gene-SV pairs across individuals, red horizontal line represent standard deviation; x-axis is in log2 scale; the bar plot on the right shows number of samples with significant prioritizations. B Upset plot depicting number of gene-SV pairs prioritized by Watershed-SV (posterior > 0.6), CADD-SV (score > 10), and whether the SV is uniquely identified using LRS. C and E Case example 1, rare TREs shared by both siblings, and case example 2, rare compound heterozygous deletions in siblings. Lollipop plot shows which set of filter includes the candidate diagnostic gene-SV pair (Triangle) and which does not (Circle), height of the lollipop represents number of gene-SV pairs prioritized in log2 scale. D Panels depict the TR copy numbers of the siblings and unaffected parent with less-expanded allele. The TRE loci is in 5’ UTR of FAM193B. Both Watershed-SV and CADD-SV can prioritize this but not WGS-only model. Both siblings have extremely high overexpression z-scores. F Panels depict the compound heterozygous deletions phased onto both alleles for FAM177A1, causing LOF of gene and thereby underexpression outliers. Only Watershed-SV succeeded at prioritizing both variants.

