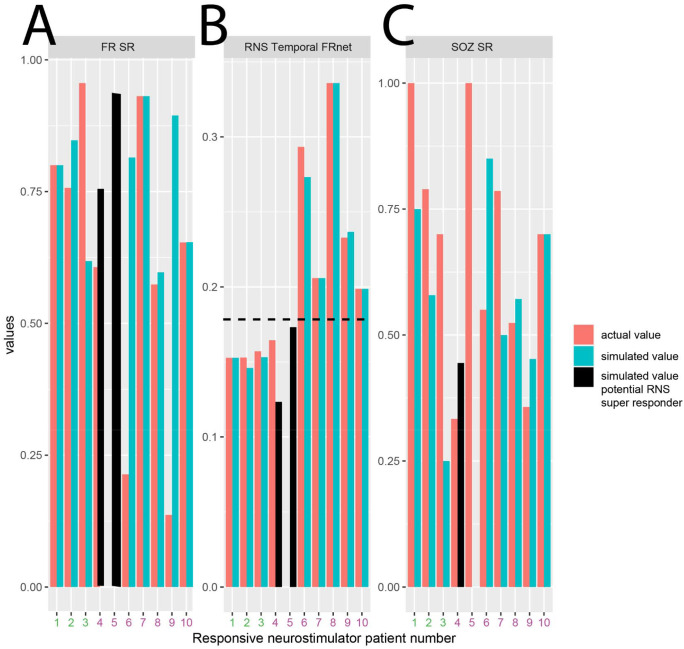
Figure 7: Simulated responsive neurostimulator lead placement and metrics that may predict RNS seizure outcome response.
The actual fast ripple stimulation ratio (A, FR SR), RNS temporal FR net (B), and seizure onset zone stimulation ratio (C, SOZ SR) are shown as orange bars for the ten patients in the RNS cohort. Patients 1–3 (patient id#: 3915,3394,468, see Table 2) had a clinical super response (>90% seizure reduction). Patients 4–10 had an intermediate responder outcome. The actual RNS temporal FR net values were significantly lower in patients 1–3 compared to patients 4–10 (Kruskal-Wallis Chi-sq 5.4, p=0.02, n=18). The simulated FR SR, RNS temporal FRnet, and SOZ SR, shown in cyan bars, are derived from superposition of the virtual RNS stimulation contacts to contiguous pre-surgical stereo EEG contacts with highest FR rate. In patients 4–5 (patient id#: 478, 4163, black bars, see Table 2) the RNS temporal FR net decreased (B, horizontal hatched line), and the FR SR increased (A). In patient 4, but not in patient 5, the virtual stimulation contacts were more proximal to the SOZ than the actual stimulation contacts (C). This simulation suggests that measuring the SOZ SR, FR SR, RNS temporal FRnet associated with virtual RNS placement may increase the odds of super responder outcome.

