Abstract
Objectives:
The objective of this study was to develop a radiomics nomogram for predicting the meningioma grade based on enhanced T 1 weighted imaging (T 1WI) images.
Methods:
188 patients with meningioma were analyzed retrospectively. There were 94 high-grade meningioma to form high-grade group and 94 low-grade meningioma were selected randomly to form low-grade group. Clinical data and MRI features were analyzed and compared. The clinical model was built by using the significant variables. The least absolute shrinkage and selection operator regression was used to select the most valuable radiomics feature. The radiomics signature was built and the Rad-score was calculated. The radiomics nomogram was developed by the significant variables of the clinical factors and Rad-score. The calibration curve and the Hosmer–Lemeshow test were used to evaluate the radiomics nomogram. Different models were compared by Delong test and decision curve analysis curve.
Results:
The sex, size and surrounding invasion were used to build clinical model. The area under the receiver operator characteristic curve (AUC) of clinical model was 0.870 (95% CI: 0.782–0.959). Nine features were used to construct the radiomics signature. The AUC of the radiomics signature was 0.885 (95% CI: 0.802–0.968). The AUC of radiomics nomogram was 0.952 (95% CI: 0.904–1). The AUC of radiomics nomogram was higher than that of clinical model and radiomics signature with a significant difference (p<0.05). The decision curve analysis curve showed that the radiomics nomogram had a larger net benefit than the clinical model and radiomics signature.
Conclusion:
The radiomics nomogram based on enhanced T1 weighted imaging images for predicting the meningioma grade showed high predictive value and might contribute to the diagnosis and treatment of meningioma.
Advances in knowledge:
1. We first constructed a radiomic nomogram to predict the meningioma grade.
2. We compared the results of the clinical model, radiomics signature and radiomics nomogram.
Introduction
Meningiomas are the most common intracranial tumors in adults. Approximately, 33.8% of all intracranial tumors are meningiomas. 1,2 They are classified into three grades (Grade I, II and III) according to the 2016 World Health Organization (WHO) criteria. 3 Grade I are low-grade tumors, while grades II and III are high-grade tumors. Different grades represent different biological behaviors of tumors. 4–6 High-grade tumors have more aggressive biological behavior, a tendency to recur, and a worse prognosis than low-grade tumors. As a result, the treatment strategies are different for high- and low-grade tumors. It is essential to perform early surgical resection for high-grade tumors. 4 However, other therapies can be selected for high-grade tumors that cannot be completely removed by surgery, including cytotoxic chemotherapy, hormone therapy and targeted therapy. 7 Long-term follow-up or stereotactic radiotherapy is a better choice for low-grade tumors. 8 Thus, accurate pre-operative prediction of the tumor grade is important to develop treatment strategies and improve the prognosis.
Previous studies have used conventional MRI to predict the meningioma grade, including factors such as the shape, size, location, indistinct tumor–brain interface, tumor necrosis, and heterogeneous tumor enhancement. 9–12 However, these imaging features are qualitative and subjective, which has led to controversial conclusions in some studies. Radiomics can predict outcomes by modeling based on high-throughput extraction of texture parameters from images. 13–15 As a new method, it can predict the meningioma grade quantitatively and objectively.
Recently, some studies have successfully used radiomics to predict the meningioma grade and obtained satisfactory results. 16–19 The area under the receiver operating characteristic curve (AUC) in these studies was relatively high. However, most of these studies were merely based on texture analysis. Radiomics with many different statistical features is preferable. In addition, the number of high-grade meningiomas included in previous radiomics studies is small. 20–23
In this study, we developed a radiomics nomogram that incorporates radiomics signatures and clinical factors to predict the meningioma grade with a larger sample size of high-grade meningioma (n = 94) based on enhanced T 1 weighted (T 1WI) images. The tumor boundary were more clearly displayed in enhanced T 1WI images than other sequences because most meningiomas strengthened obviously in enhanced T 1WI images. This made it easier and more accurate to draw ROI in enhanced T 1WI images. Otherwise, previous study had shown that a model constructed by enhanced T 1WI images to classify meningioma grade was more effective than T 1WI and T 2WI images. 24 Considering the above factors, we used enhanced T 1WI images to develop the radiomics nomogram.
Methods and materials
Patients
This retrospective study was approved by our institutional review board, and the requirement for informed consent was waived. The patients who underwent meningioma resection surgery from January 1, 2014, to June 31, 2021 were analyzed. The inclusion criteria were as follows: (1) patients underwent enhanced T 1 weighted examination before surgery; (2) patients did not receive any treatment before MRI examination and surgery; and (3) there was a pathological diagnosis of meningioma and a clear grade after surgery. The exclusion criteria were as follows: (1) there were severe artifacts on MRI images, and the image quality was not satisfactory for analysis; and (2) there was no clear pathological diagnosis or grade. Clinical information, including age and sex, was recorded.
94 patients were diagnosed with high-grade meningioma and met the inclusion criteria. 68 patients were WHO II, and 26 cases were WHO III. These 94 cases formed the high-grade group. More than 1000 cases were diagnosed with low-grade meningioma. The number of low-grade tumors was far greater than that of high-grade tumors. 94 cases of low-grade meningioma were selected randomly to match the high-grade meningioma to avoid statistical bias. They formed the low-grade group. Finally, there were 188 cases in our study.
MRI examination and MRI features analysis
The MRI parameters were as follows: TR: 1800 ms; TE: 10 ms; slice thickness: 5 mm; FOV: 25 cm. Enhanced T 1WI images were obtained after administering 0.1 ml/kg Gd-DTPA.
Two radiologists with 10 and 20 years of neurological imaging experience analyzed all of the images. The two readers who were blinded to the pathological data analyzed the following MRI features by consensus: size (the maximum diameter of the tumor on the axial MRI image); indistinct margins (indistinct tumor margin with brain parenchyma); surrounding invasion (the tumor invaded the surrounding structures, including the brain parenchyma, venous sinus, bone and so on); dural tail (peritumoral dural thickening and enhancement); and peritumoral edema in the brain.
Construction of the clinical model
Univariate analysis was used to compare the differences in the clinical data and MRI features between the two groups. A multiple logistic regression analysis was used to build the clinical factor model by using the significant variables from the univariate analysis as inputs. Odds ratios (ORs) as estimates of relative risk with 95% confidence intervals (CIs) were calculated for each independent factor.
Radiomics feature extraction
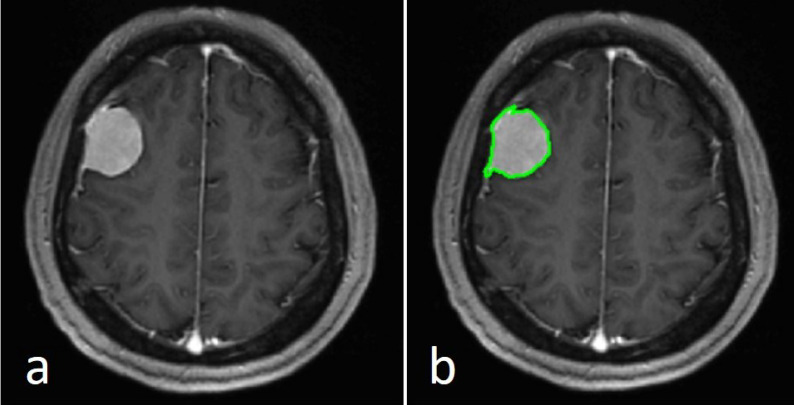
We selected one axial image in the largest cross-sectional area in axis-enhanced T 1WI and exported the selected image to a Digital Imaging and Communications in Medicine (DICOM) file from the picture archiving and communications system (PACS) workstation (GE). The selected image was uploaded to IBEX software (http://bit.ly/IBEX), and the region of interest (ROI) was drawn manually as close as possible to the tumor edge. The ROI included the whole tumor(Figure 1). The radiomics features included eight categories: Gradient Orient Histogram, Gray Level Co-occurence Matrix25, Gray Level Run Length Matrix25, Intensity Direct, Intensity Histogram, Intensity Histogram Gauss Fit, Neighbor Intensity Difference25, and Shape.
Figure 1.
The axial image in the largest cross-sectional area of a WHO I grade meningioma image in a 53-year-old female patient (a). A region of interest (green contour) was drawn within the border of the tumor (b). WHO, World Health Organization
The intraclass correlation coefficient (ICC) was used to evaluate the stability of the radiomics features. 20 cases of meningioma (10 low-grade meningiomas and 10 high-grade meningiomas) were chosen randomly. Two radiologists independently drew ROIs of 20 cases. The ICC was calculated based on a single rater, absolute agreement, two-way random-effects model. The ICC value of each radiomics feature was calculated, and only radiomics features showing high stability (ICC≥0.8) were selected for future analysis.
Construction of the radiomics signature
Least absolute shrinkage and selection operator (LASSO) regression was used to reduce the dimensions of the radiomics features, and the most valuable radiomics feature was selected. The selected features were used to build a radiomics signature. We applied a linear combination of selected features weighted by their respective LASSO coefficient to calculate a radiomics score (Rad-score) for each patient. We calculated the Rad-score using the following formula: Rad-score = −0.2306×90Percentile + 0.4497×0.4InformationMeasureCorr2+0.1569×0ShortRunHighGrayLevelEmpha + 0.2254×Kurtosis.1–0.1764 × Skewness.2+0.2738×HistArea-0.3595 × Convex−0.3798×Roundness−1.4265×SurfaceAreaDensity.
Development of a radiomics nomogram and assessment of the different models
The significant variables of the clinical factors and Rad-score were used to develop a radiomics nomogram. The calibration curve was used to assess the calibration of the nomogram. The goodness-of-fit of the nomogram was evaluated by the Hosmer–Lemeshow test. The area under the receiver operator characteristic (ROC) curve (AUC) and Delong test were applied to evaluate the diagnostic performance of the clinical model, radiomics signature and radiomics nomogram for predicting the meningioma grade. Decision curve analysis (DCA) was performed to evaluate the clinical usefulness of the radiomics nomogram by calculating the net benefits at different threshold probabilities.
Statistical analysis
R statistical software (https://www.r-project.org/) was used for statistical analysis. The “irr” package was used to calculate the ICC. The “lars” package was used to perform the LASSO regression. The “pROC” package was used to draw the ROC curve. The “rms” package was used to draw the radiomics nomogram. The “rmda” package was used to draw the DCA curve. p<0.05 was considered statistically significant.
Results
Clinical factors of the patients and construction of the clinical model
The clinical factors are shown in Table 1. There was a significant difference in sex, size, indistinct margins, surrounding invasion, dural tail and peritumoral edema between the two groups (p < 0.05), while there was no significant difference in age between the two groups (p > 0.05). The results of the multiple logistic regression analysis are shown in Table 2. Sex (p = 0.0073), size (p = 0.0001), and surrounding invasion (p = 0.0168) were independent predictors in the clinical model. Tumors in males (OR = 2.904, 95% CI = 1.347–6.439), with larger sizes (OR = 1.767, 95% CI = 1.340–2.395), or with surrounding invasion (OR = 3.211, 95% CI = 1.275–8.792) were more likely to be high-grade meningiomas.
Table 1.
Clinical characteristics
| Low grade group | High grade group | p | |
|---|---|---|---|
| Sex(Male: Female) | 17:77 | 44:50 | 0.0000259 |
| Age(years) | 54.16 ± 10.10 | 56.28 ± 12.56 | 0.207 |
| Size(cm) | 3.315 ± 1.450 | 5.016 ± 1.716 | 9.97E-12 |
| Indistinct margins(present/absent) | 3/91 | 19/75 | 0.000283 |
| Surrounding invasion(present/absent) | 8/86 | 33/61 | 0.0000100 |
| Dural tail(present/absent) | 76/18 | 58/36 | 0.00372 |
| Peritumoral edema(present/absent) | 36/58 | 68/26 | 2.67E-06 |
Table 2.
The results of the multiple logistic regression analysis of clinical factors
| p | OR | 95% CI | |
|---|---|---|---|
| Sex | 0.0073 | 2.904 | 1.347–6.439 |
| Age | 0.1942 | 1.022 | 0.989–1.055 |
| Size | 0.0001 | 1.767 | 1.340–2.395 |
| Indistinct margins | 0.6007 | 1.461 | 0.384–7.181 |
| Surrounding invasion | 0.0168 | 3.211 | 1.275–8.792 |
| Dural tail | 0.2832 | 0.641 | 0.283–1.447 |
| Peritumoral edema | 0.7559 | 1.142 | 0.485–2.606 |
CI, confidence interval; OR, odds ratio.
Radiomics feature extraction, selection and radiomics signature construction
There were 756 radiomics features in each ROI and 642 features (84.9%) showed high stability (ICC≥0.8). We selected the nine most valuable features by LASSO regression. These nine features were used to construct the radiomics signature. There was a significant difference in Rad-score between the two groups (p<0.05).
Construction of the radiomics nomogram and evaluation of the different models
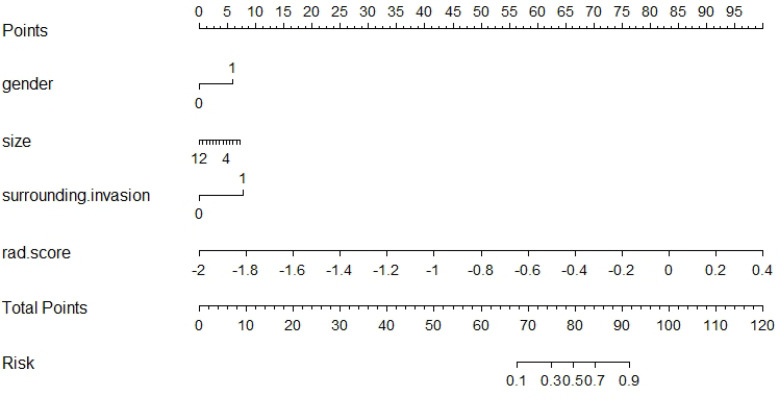
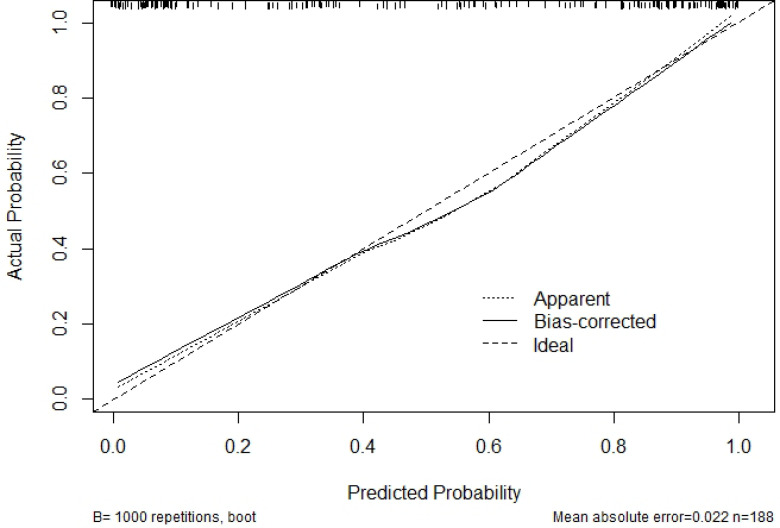
Sex, size, surrounding invasion and Rad-score were used to construct the radiomics nomogram (Figure 2). The calibration curve of the nomogram is shown in Figure 3. Actual probability represents the actual meningioma grade and predicted probability represents the predicted meningioma grade by the radiomics nomogram. The ideal line means the ideal result that predicted probability is equal to actual probability. The apparent line represents the entire cohort (n = 188). The bias-corrected line is bias-corrected by bootstrapping (B = 1000 repetitions), indicating observed nomogram performance. The bias-corrected line represents the result of radiomics nomogram. The closer the bias-corrected line approaches the ideal line, the better the predictive efficacy of the nomogram is. Good calibration was shown in the calibration curve and Hosmer–Lemeshow test (p = 0.6632).
Figure 2.
The radiomics nomogram combines the sex, size, surrounding invasion and Rad-score.
Figure 3.
The calibration curve of the radiomics nomogram show good calibration. The 45° straight line represents the perfect match between the actual and predicted probabilities. The closer the line approaches the ideal prediction line, the better the predictive efficacy of the nomogram is
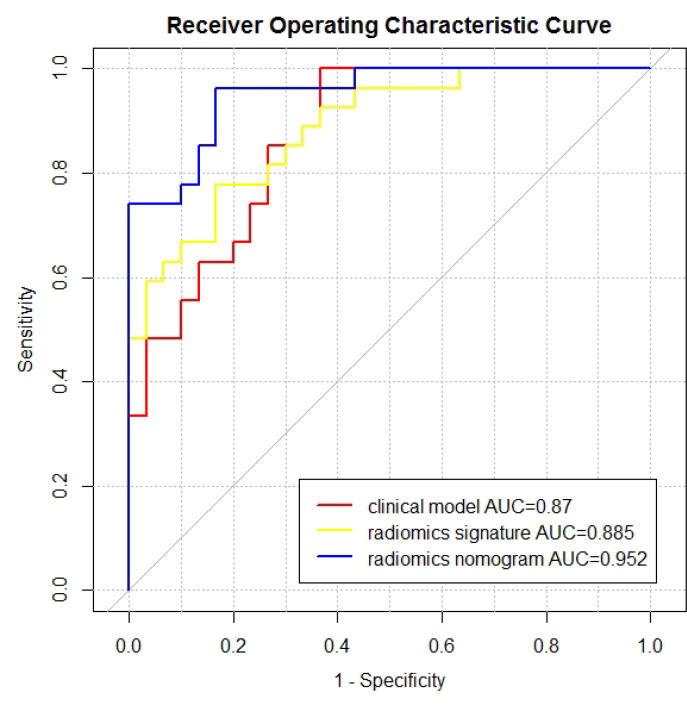
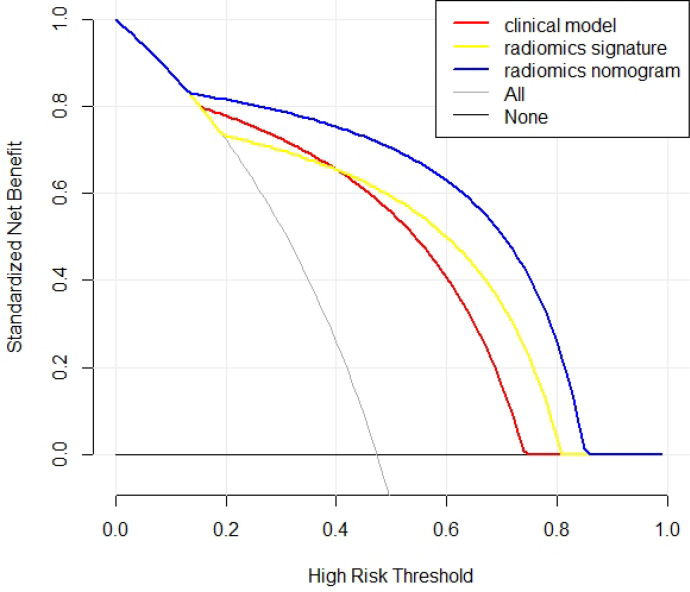
The results of the clinical model, radiomics signature and radiomics nomogram are shown in the Table 3. ROC curves are shown in the Figure 4. The AUC of the radiomics nomogram (0.952, 95% CI = 0.904–1) was higher than that of the clinical model and radiomics signature. The result of Delong’s test is shown in the Table 4. There was no significant difference between the AUCs of the clinical model and the radiomics signature (p = 0.701). There was a significant difference between the AUCs of the clinical model and the radiomics nomogram (p = 0.042). There was a significant difference between the AUCs of the radiomics signature and the radiomics nomogram (p = 0.022). The DCA is shown in the Figure 5. The radiomics nomogram had a larger net benefit across the range of the threshold probability than the clinical model and the radiomics signature.
Table 3.
The results of different models
| Accuracy | Sensitivity | Specificity | AUC | 95% CI | |
|---|---|---|---|---|---|
| Clinical model | 0.79 | 0.85 | 0.73 | 0.87 | 0.782–0.959 |
| Radiomics signature | 0.81 | 0.78 | 0.83 | 0.885 | 0.802–0.968 |
| Radiomics nomogram | 0.86 | 0.85 | 0.87 | 0.952 | 0.904–1.000 |
AUC, area under the receiver operator characteristic curve; CI, confidence interval.
Figure 4.
The ROC curves and AUC values of the clinical model, radiomics signature and radiomics nomogram. AUC, area under the ROC curve; ROC, receiver operating characteristic.
Table 4.
The results of DeLong test between every two models
| Clinical model | Radiomics signature | Radiomics nomogram | ||
|---|---|---|---|---|
| Clinical model | – | −0.3846 | −2.031 | Z |
| 0.7005 | 0.04226 | p | ||
| Radiomics signature | −0.3846 | – | −2.2972 | Z |
| 0.7005 | 0.02161 | p | ||
| Radiomics nomogram | −2.031 | −2.2972 | – | Z |
| 0.04226 | 0.02161 | p |
Z, Z statistic ; p, p-value.
Figure 5.
Decision curve analysis of the three models. The X-axis represents the threshold probability, and the Y-axis represents the net benefit. The radiomics nomogram gets the larger net benefit than the clinical model and radiomics signature.
Discussion
In the present study, we constructed a radiomics nomogram that combined the radiomics signature and the clinical factors to predict the meningioma grade based on enhanced T 1WI images. The radiomics nomogram had a better predictive value with an AUC of 0.952, accuracy of 0.860, sensitivity of 0.850, and specificity of 0.870.
Previous studies have found some conventional features to differentiate low- and high-grade meningioma. Kane et al 25 found a twofold higher risk in males for high-grade meningioma. Kasuya et al 26 found that male sex was an independent risk factor for high proliferative potential. A large tumor size was more common in high-grade meningioma. 27,28 Hale et al 29 found that tumor volume was the most robust pre-operative indicator of a higher-grade meningioma. In the study of Salah et al, 30 bone erosion and brain invasion showed a significant correlation with high-grade meningioma.
The results of the present study are in agreement with previous studies. Our study showed that males, larger size and surrounding invasion were factors more likely to be observed in high-grade meningioma. We used these three factors to construct the clinical model. The clinical model had a predictive value with an AUC of 0.870 (95% CI: 0.782–0.959), accuracy of 0.790, sensitivity of 0.850, and specificity of 0.730.
There have been some previous studies using radiomics to predict the meningioma grade. Chu et al 22 used the logistic regression method to analyze 98 patients with 16 cases of high-grade meningioma, and they reported that the areas under the curve values were 0.958 and 0.948 in the training and test groups, respectively. Zhu et al 23 used support vector machine (SVM) to analyze 181 patients with 35 cases of high-grade meningioma, and they reported that the AUC, sensitivity, and specificity to predict the meningioma grades were 0.811, 0.769, and 0.898, respectively. Chen et al 21 applied linear discriminant analysis (LDA) and a SVM to construct a radiomics model to predict the meningioma grade. Their sample included 150 with 89 cases of high-grade meningioma. They found that the highest accuracy among the LDA-based models was 75.6%, shown in the combination of LASSO + LDA.
The present study had several improvements compared to previous studies. There were 94 cases of high-grade meningioma, which was more than the other radiomic studies. Radiomics is a technology based on artificial intelligence and big data. A larger sample size produces a more reliable result. The result of the present study was more accurate and objective due to the larger sample of high-grade meningioma. To the best of our knowledge, no previous study has used radiomic nomograms to predict the meningioma grade.
We first constructed a radiomic nomogram to predict the meningioma grade. The radiomics nomogram showed improvement when combining clinical factors and radiomics. In the present study, the radiomic nomogram had an AUC of 0.952 (95% CI: 0.904–1), which was significantly higher than that of the clinical model and radiomics signature. The radiomics nomogram had a larger net benefit across the range of the threshold probability than the clinical model and radiomics signature from the DCA curve. The radiomics nomogram also showed good calibration. The radiomics nomogram is visual and can quantified by doctors. We can calculate the risk of high-grade meningioma for the patient and formulate an individualized treatment plan.
There were some limitations of this study. First, selection bias and accuracy overestimation of the diagnosis cannot be avoided because this study was a retrospective study. Second, the ROI was two-dimensional (2D) instead of three-dimensional (3D). Recently, some studies found that 2D radiomics models were better than 3D radiomics models. 31,32 Given the cost of the radiomics feature calculation, the 2D approach is currently more appropriate. Even so, future studies should compare the 2D and 3D models in predicting meningioma grade. Third, although the sample size of high-grade meningioma was larger than that in previous studies, it was still less than 100 cases. We should select more cases for additional validation of our model. Fourth, the validation of models were internal validation in our study. There was no external validation because we did not use meningioma images from other hospitals or research centers. We would add it in the future study.
Conclusion
Our study developed a radiomics nomogram based on enhanced T 1WI images for predicting the meningioma grade. It showed a high predictive value and could play an important role in clinical decision-making, although further validation is needed before clinical use.
Contributor Information
Chongfeng Duan, Email: duancf@qduhospital.cn, Department of Radiology, The Affiliated Hospital of Qingdao University, Qingdao, China .
Xiaoming Zhou, Email: zhouxm@qduhospital.cn, Department of Radiology, The Affiliated Hospital of Qingdao University, Qingdao, China .
Jiachen Wang, Email: 625879715@qq.com, Department of Radiology, The Affiliated Hospital of Qingdao University, Qingdao, China .
Nan Li, Email: nannanli1003@163.com, Department of Information Management, The Affiliated Hospital of Qingdao University, Qingdao, China .
Fang Liu, Email: m18765360103@163.com, Department of Radiology, The Affiliated Hospital of Qingdao University, Qingdao, China .
Song Gao, Email: 17853292211@163.com, Department of Radiology, The Affiliated Hospital of Qingdao University, Qingdao, China .
Xuejun Liu, Email: bncz@sina.com, Department of Radiology, The Affiliated Hospital of Qingdao University, Qingdao, China .
Wenjian Xu, Email: wjxu2021@qdu.edu.cn, Department of Radiology, The Affiliated Hospital of Qingdao University, Qingdao, China .
REFERENCES
- 1. Holleczek B, Zampella D, Urbschat S, Sahm F, von Deimling A, Oertel J, et al. . Incidence, mortality and outcome of meningiomas: a population-based study from germany . Cancer Epidemiol 2019. ; 62: 101562 . doi: 10.1016/j.canep.2019.07.001 [DOI] [PubMed] [Google Scholar]
- 2. Wiemels J, Wrensch M, Claus EB . Epidemiology and etiology of meningioma . J Neurooncol 2010. ; 99: 307 – 14 . doi: 10.1007/s11060-010-0386-3 [DOI] [PMC free article] [PubMed] [Google Scholar]
- 3. Wen PY, Huse JT . 2016 world health organization classification of central nervous system tumors . Continuum (Minneap Minn) 2017. ; 23: 1531 – 47 . doi: 10.1212/CON.0000000000000536 [DOI] [PubMed] [Google Scholar]
- 4. Rogers L, Barani I, Chamberlain M, Kaley TJ, McDermott M, Raizer J, et al. . Meningiomas: knowledge base, treatment outcomes, and uncertainties. A RANO review . J Neurosurg 2015. ; 122: 4 – 23 . doi: 10.3171/2014.7.JNS131644 [DOI] [PMC free article] [PubMed] [Google Scholar]
- 5. Goldbrunner R, Minniti G, Preusser M, Jenkinson MD, Sallabanda K, Houdart E, et al. . EANO guidelines for the diagnosis and treatment of meningiomas . Lancet Oncol 2016. ; 17: e383 - 91 . doi: 10.1016/S1470-2045(16)30321-7 [DOI] [PubMed] [Google Scholar]
- 6. Whittle IR, Smith C, Navoo P, Collie D . Meningiomas . Lancet 2004. ; 363: 1535 – 43 . doi: 10.1016/S0140-6736(04)16153-9 [DOI] [PubMed] [Google Scholar]
- 7. Li D, Jiang P, Xu S, Li C, Xi S, Zhang J, et al. . Survival impacts of extent of resection and adjuvant radiotherapy for the modern management of high-grade meningiomas . J Neurooncol 2019. ; 145: 125 – 34 . doi: 10.1007/s11060-019-03278-w [DOI] [PMC free article] [PubMed] [Google Scholar]
- 8. Black PM, Villavicencio AT, Rhouddou C, Loeffler JS . Aggressive surgery and focal radiation in the management of meningiomas of the skull base: preservation of function with maintenance of local control . Acta Neurochir (Wien) 2001. ; 143: 555 – 62 . doi: 10.1007/s007010170060 [DOI] [PubMed] [Google Scholar]
- 9. Hashiba T, Hashimoto N, Maruno M, Izumoto S, Suzuki T, Kagawa N, et al. . Scoring radiologic characteristics to predict proliferative potential in meningiomas . Brain Tumor Pathol 2006. ; 23: 49 – 54 . doi: 10.1007/s10014-006-0199-4 [DOI] [PubMed] [Google Scholar]
- 10. Kawahara Y, Nakada M, Hayashi Y, Kai Y, Hayashi Y, Uchiyama N, et al. . Prediction of high-grade meningioma by preoperative MRI assessment . J Neurooncol 2012. ; 108: 147 – 52 . doi: 10.1007/s11060-012-0809-4 [DOI] [PubMed] [Google Scholar]
- 11. Lin B-J, Chou K-N, Kao H-W, Lin C, Tsai W-C, Feng S-W, et al. . Correlation between magnetic resonance imaging grading and pathological grading in meningioma . J Neurosurg 2014. ; 121: 1201 – 8 . doi: 10.3171/2014.7.JNS132359 [DOI] [PubMed] [Google Scholar]
- 12. Hale AT, Wang L, Strother MK, Chambless LB . Differentiating meningioma grade by imaging features on magnetic resonance imaging . J Clin Neurosci 2018. ; 48: 71 – 75 . doi: 10.1016/j.jocn.2017.11.013 [DOI] [PubMed] [Google Scholar]
- 13. Gillies RJ, Kinahan PE, Hricak H . Radiomics: images are more than pictures, they are data . Radiology 2016. ; 278: 563 – 77 . doi: 10.1148/radiol.2015151169 [DOI] [PMC free article] [PubMed] [Google Scholar]
- 14. Kumar V, Gu Y, Basu S, Berglund A, Eschrich SA, Schabath MB, et al. . Radiomics: the process and the challenges . Magn Reson Imaging 2012. ; 30: 1234 – 48 . doi: 10.1016/j.mri.2012.06.010 [DOI] [PMC free article] [PubMed] [Google Scholar]
- 15. Lambin P, Rios-Velazquez E, Leijenaar R, Carvalho S, van Stiphout RGPM, Granton P, et al. . Radiomics: extracting more information from medical images using advanced feature analysis . Eur J Cancer 2012. ; 48: 441 – 46 . doi: 10.1016/j.ejca.2011.11.036 [DOI] [PMC free article] [PubMed] [Google Scholar]
- 16. Lu Y, Liu L, Luan S, Xiong J, Geng D, Yin B . The diagnostic value of texture analysis in predicting WHO grades of meningiomas based on ADC maps: an attempt using decision tree and decision forest . Eur Radiol 2019. ; 29: 1318 – 28 . doi: 10.1007/s00330-018-5632-7 [DOI] [PubMed] [Google Scholar]
- 17. Park YW, Oh J, You SC, Han K, Ahn SS, Choi YS, et al. . Radiomics and machine learning may accurately predict the grade and histological subtype in meningiomas using conventional and diffusion tensor imaging . Eur Radiol 2019. ; 29: 4068 – 76 . doi: 10.1007/s00330-018-5830-3 [DOI] [PubMed] [Google Scholar]
- 18. Ke C, Chen H, Lv X, Li H, Zhang Y, Chen M, et al. . Differentiation between benign and nonbenign meningiomas by using texture analysis from multiparametric MRI . J Magn Reson Imaging 2020. ; 51: 1810 – 20 . doi: 10.1002/jmri.26976 [DOI] [PubMed] [Google Scholar]
- 19. Yan P-F, Yan L, Hu T-T, Xiao D-D, Zhang Z, Zhao H-Y, et al. . The potential value of preoperative mri texture and shape analysis in grading meningiomas: a preliminary investigation . Transl Oncol 2017. ; 10: 570 – 77 . doi: 10.1016/j.tranon.2017.04.006 [DOI] [PMC free article] [PubMed] [Google Scholar]
- 20. Han Y, Wang T, Wu P, Zhang H, Chen H, Yang C . Meningiomas: preoperative predictive histopathological grading based on radiomics of MRI . Magn Reson Imaging 2021. ; 77: 36 – 43 . doi: 10.1016/j.mri.2020.11.009 [DOI] [PubMed] [Google Scholar]
- 21. Chen C, Guo X, Wang J, Guo W, Ma X, Xu J . The diagnostic value of radiomics-based machine learning in predicting the grade of meningiomas using conventional magnetic resonance imaging: a preliminary study . Front Oncol 2019. ; 9: 1338 . doi: 10.3389/fonc.2019.01338 [DOI] [PMC free article] [PubMed] [Google Scholar]
- 22. Chu H, Lin X, He J, Pang P, Fan B, Lei P, et al. . Value of MRI radiomics based on enhanced t1wi images in prediction of meningiomas grade . Acad Radiol 2021. ; 28: 687 – 93 . doi: 10.1016/j.acra.2020.03.034 [DOI] [PubMed] [Google Scholar]
- 23. Zhu Y, Man C, Gong L, Dong D, Yu X, Wang S, et al. . A deep learning radiomics model for preoperative grading in meningioma . Eur J Radiol 2019. ; 116: 128 – 34 . doi: 10.1016/j.ejrad.2019.04.022 [DOI] [PubMed] [Google Scholar]
- 24. Li X, Miao Y, Han L, Dong J, Guo Y, Shang Y, et al. . Meningioma grading using conventional MRI histogram analysis based on 3D tumor measurement . Eur J Radiol 2019. ; 110: 45 – 53 . doi: 10.1016/j.ejrad.2018.11.016 [DOI] [PubMed] [Google Scholar]
- 25. Kane AJ, Sughrue ME, Rutkowski MJ, Shangari G, Fang S, McDermott MW, et al. . Anatomic location is a risk factor for atypical and malignant meningiomas . Cancer 2011. ; 117: 1272 – 78 . doi: 10.1002/cncr.25591 [DOI] [PMC free article] [PubMed] [Google Scholar]
- 26. Kasuya H, Kubo O, Tanaka M, Amano K, Kato K, Hori T . Clinical and radiological features related to the growth potential of meningioma . Neurosurg Rev 2006. ; 29: 293 – 96 . doi: 10.1007/s10143-006-0039-3 [DOI] [PMC free article] [PubMed] [Google Scholar]
- 27. Lu Y, Liu L, Luan S, Xiong J, Geng D, Yin B, et al. . The diagnostic value of texture analysis in predicting WHO grades of meningiomas based on ADC maps: an attempt using decision tree and decision forest . Eur Radiol 2019. ; 29: 1318 – 28 . doi: 10.1007/s00330-018-5632-7 [DOI] [PubMed] [Google Scholar]
- 28. Coroller TP, Bi WL, Huynh E, Abedalthagafi M, Aizer AA, Greenwald NF, et al. . Radiographic prediction of meningioma grade by semantic and radiomic features . PLoS One 2017. ; 12( 11 . doi: 10.1371/journal.pone.0187908 [DOI] [PMC free article] [PubMed] [Google Scholar]
- 29. Hale AT, Wang L, Strother MK, Chambless LB, et al. . Differentiating meningioma grade by imaging features on magnetic resonance imaging . J Clin Neurosci 2018. ; 48: 71 – 75 . doi: 10.1016/j.jocn.2017.11.013 [DOI] [PubMed] [Google Scholar]
- 30. Salah F, Tabbarah A, ALArab Y N, Asmar K, Tamim H, Makki M, et al. . Can CT and MRI features differentiate benign from malignant meningiomas? Clin Radiol 2019. ; 74: 898 . doi: 10.1016/j.crad.2019.07.020 [DOI] [PubMed] [Google Scholar]
- 31. Shen C, Liu Z, Guan M, Song J, Lian Y, Wang S, et al. . 2D and 3D CT radiomics features prognostic performance comparison in non-small cell lung cancer . Transl Oncol 2017. ; 10: 886 – 94 . doi: 10.1016/j.tranon.2017.08.007 [DOI] [PMC free article] [PubMed] [Google Scholar]
- 32. Yang G, Nie P, Zhao L, Guo J, Xue W, Yan L, et al. . 2D and 3D texture analysis to predict lymphovascular invasion in lung adenocarcinoma . Eur J Radiol 2020. ; 129: 109111 . doi: 10.1016/j.ejrad.2020.109111 [DOI] [PubMed] [Google Scholar]


