

Abstract
Objectives:
To demonstrate the effect of an improved deep learning-based reconstruction (DLR) algorithm on Ultra-High-Resolution Computed Tomography (U-HRCT) scanners.
Methods:
Clinical and phantom studies were conducted. Thirty patients who underwent contrast-enhanced CT examination during the follow-up period were enrolled. Images were reconstructed using improved DLR [termed, New DLR, i.e., Advanced Intelligent Clear-IQ Engine (AiCE) Body Sharp] and conventional DLR (Conv DLR, AiCE Body) algorithms. Two radiologists assessed the overall image quality using a 5-point scale (5 = excellent; 1 = unacceptable). The noise power spectra (NPSs) were calculated to assess the frequency characteristics of the image noise, and the square root of area under the curve (√AUC NPS) between 0.05 and 0.50 cycle/mm was calculated as an indicator of the image noise. Dunnett’s test was used for statistical analysis of the visual evaluation score, with statistical significance set at p < 0.05.
Results:
The overall image quality of New DLR was better than that of the Conv DLR (4.2 ± 0.4 and 3.3 ± 0.4, respectively; p < 0.0001). All New DLR images had an overall image quality score above the average or excellent. The √AUCNPS value of New DLR was lower than that of Conv DLR (13.8 and 14.2, respectively). The median values of reconstruction time required with New DLR and Conv DLR were 5.0 and 7.8 min, respectively.
Conclusions:
The new DLR algorithm improved the image quality within a practical reconstruction time.
Advances in knowledge:
The new DLR enables us to choose whether to improve image quality or reduce the dose.
Introduction
Ultra-high-resolution CT (U-HRCT) scanners, introduced in 2016, have smaller detector elements and a larger reconstruction matrix than those associated with conventional multidetector row CT scanners, thus yielding images with higher spatial resolution.1–5 However, smaller detectors cause an increase in image noise compared to that observed with detectors in conventional CT scanners.6,7 To overcome this increased image noise, deep learning-based reconstruction (DLR, Advanced Intelligent Clear-IQ Engine Body [AiCE Body], Canon Medical Systems, Otawara, Japan), the first commercialised DLR tool, was installed in U-HRCT. The DLR algorithm introduces deep-convolutional neural networks (DCNNs) trained on a teaching dataset of ideal model-based iterative reconstruction (MBIR) images into the reconstruction flow. The DLR algorithm dramatically reduces image noise while maintaining spatial resolution.8 In abdominal CT scans, the quality of DLR images has improved on U-HRCT images compared to that on MBIR images and hybrid-iterative reconstruction (Hybrid-IR).9–13 However, the reconstruction time of DLR is longer than that of Hybrid-IR, making its clinical use difficult because of delays in image reconstruction.
Recently, an improved DLR algorithm named AiCE Body Sharp (Canon Medical Systems, Otawara, Japan) was developed. In this algorithm, the DCNN process was optimised to increase the image quality and reduce the reconstruction time. Thus, the reconstruction algorithm is expected to improve the image quality with a clinically acceptable reconstruction time. High-quality images enable high-quality CT examinations. However, no study has reported the usefulness of the improved DLR algorithm in U-HRCT scanners, except for coronary CT angiography at the writing of this paper.14 Therefore, this study aimed to demonstrate the impact of an improved DLR algorithm on U-HRCT scanner performance.
Methods and materials
Patients and phantom
All included patients underwent contrast-enhanced CT examination for follow-up using a ‘chest routine’ protocol (see the 2–2 section) on U-HRCT between 27 August and 28 October 2021. Patients with poor breath-holding (n = 1) and adverse reactions to contrast media (n = 1) were excluded. Thirty consecutive patients were enrolled in the study. The detailed patient demographics are presented in Table 1. This study was approved by the institutional review board of our hospital (approved number: 21176–00), which waived the requirement for informed consent owing to the retrospective nature of this study.
Table 1.
Patient demographics
| Clinical features | Patient information (n = 30) |
|---|---|
| Age [years]a | 63 (41–81) |
| Gender, male/female | 11/19 |
| Body mass index [kg/m2]a | 19.8 (15.0–27.8) |
| Scan range, chest-abdomen/chest-pelvis | 13/17 |
| Purpose of CT examinationb | |
| Evaluation after chemotherapy for malignant lung cancers | 12 (40) |
| Follow-up after surgery for malignant breast cancers | 6 (20) |
| Follow-up after surgery for malignant lung cancers | 5 (16.7) |
| Evaluation after chemotherapy for diffuse large B-cell lymphoma | 3 (10) |
| Follow-up after surgery for thymoma | 1 (3.3) |
| Evaluation after chemotherapy for mycosis fungoides | 1 (3.3) |
| Follow-up after surgery for malignant melanoma | 1 (3.3) |
| Follow-up after surgery for Paget’s disease | 1 (3.3) |
Unless otherwise indicated, data are number of patients
Values are median; range is shown in parentheses
Data are number of patients (percent)
A Catphan® 600 (Phantom Laboratory, Greenwich, USA; Figure 1a)15 with an elliptical annuls (CTP579-10, Phantom Laboratory, Greenwich, USA; Figure 1b) was used for analysing physical characteristic to mimic the human abdomen (Anteroposterior×Lateral size:25 × 35 cm, Figure 1c). This phantom consisted of two modules: a sensitometry module (CTP 404) and an image uniformity module (CTP 486). The CTP 404 module contained three disc-shaped objects (teflon, delrin, and polystyrene). The contrasts were 840, 240, and 130 Hounsfield units (HU), which were assumed to be the bone, contrast-enhanced vessels, and soft tissues, respectively.
Figure 1.

Photos of (a) Catphan phantom, (b) an elliptical annuls, and (c) experimental arrangement.
CT protocol
Clinical and phantom studies were conducted using a U-HRCT scanner (Aquilion Precision, Canon Medical Systems, Otawara, Japan) with a 0.25 mm collimation and 1,792 channels. In the U-HRCT scanner, a super-high-resolution (SHR) mode with 0.25 mm collimation and 1,792 channels, a high-resolution mode with 0.5 mm collimation and 1,792 channels, and a normal-resolution mode with 0.5 mm collimation and 896 channels can be selected. Of these three scan modes, SHR mode was selected for this study. In SHR mode, high-resolution images can be acquired in both the in-plane and body-axis directions. In this study, the ‘chest routine’ protocol was used for all scans. The scan parameters were as follows: scan mode, SHR mode; tube voltage, 120 kVp; gantry rotation time, 0.5 s/rotation. The tube current was selected using the automatic exposure control (AEC) technique. The AEC was adjusted to reduce the radiation dose by 25% compared to the filtered back projection. Images were reconstructed with a 0.5 mm slice thickness using DLRs (AiCE Body Sharp and AiCE Body), MBIR (Forward projected model-based Iterative Reconstruction SoluTion), and Hybrid-IR (Adaptive Iterative Dose Reduction 3D enhanced with FC 13 kernel) algorithms with standard settings. The AiCE Body Sharp and AiCE Body are hereafter referred to as ‘New DLR’ and ‘Conv DLR’, respectively. The detailed acquisition and reconstruction parameters are presented in Table 2. Moreover, among the 30 patients in the study, three abdominal malignant tumors were confirmed by CT: adrenal metastases from lung cancer, primary renal cancer, and liver metastases from breast cancer.
Table 2.
Scan and reconstruction parameters
| Scan mode | Super-high resolution |
|---|---|
| Tube voltage [kVp] | 120 |
| Tube current control (setting value) | Automatic exposure control (SD: 17.5) |
| Rotation time [s/rotation] | 0.5 |
| Focal spot [mm×mm] | L3 (0.6 × 1.3) |
| Collimation and detector rows | 0.25 mm×160 rows |
| Pitch factor | 0.806 |
| Matrix size | 1,024 × 1,024 |
| Slice thickness/interval [mm] | 0.5/0.5 |
| Reconstruction method | New DLRa, Conv DLRb, Hybrid-IR, MBIR |
| Reconstruction strength | Standard |
| FOV [mm] | 320 |
SD, standard deviation; DLR, deep learning-based reconstruction; Hybrid-IR, hybrid-iterative reconstruction; MBIR, model-based iterative reconstruction; FOV, field of view
indicates advanced intelligent clear-IQ engine body sharp
indicates advanced intelligent clear-IQ engine body
All clinical CT images were contrast-enhanced, and iohexol (Omniaque 300; Daiichi-Sankyo, Tokyo, Japan) was used as the contrast medium. CT scans were performed using 100 ml of contrast medium injected at 1.5 ml s−1, and 80 s after the start of contrast medium injection. At our institution, only one phase of the portal venous phase was acquired in the follow-up CT scan of the thoracic region. The scan ranges were from the thorax to the abdomen, and from the thorax to the pelvis. These scan ranges were determined based on the clinical requirements. The phantom was scanned ten times to improve the measurement accuracy.
To assess the radiation exposure, the CT dose index volume (CTDIvol) and dose-length product (DLP) were reviewed from the dose report. Furthermore, the size-specific dose estimate (SSDE), which corrects the CTDIvol based on body habitus16 was calculated. Size-dependent conversion factors were obtained from the AAPM Report 204,17 and these factors were calculated from the summation of the anteroposterior and lateral dimensions at the mid-liver level of each patient.
Clinical image assessment
Two board-certified radiologists with 13 and 10 years of experience independently graded the overall image quality. One hundred and twenty image series were acquired from 30 patients and four reconstruction algorithms (30 × 4=120). The observers evaluated the overall image quality (1 = unacceptable; 2 = below average but acceptable; 3 = average; 4 = above average; 5 = excellent diagnostic image quality). Subsequently, the mean values of the two observers were recorded and defined as the visual scores. The CT datasets were randomised and the observers were blinded to the acquisition and reconstruction parameters. Images were evaluated using a liquid crystal display (RadiForce GX550, EIZO, Ishikawa, Japan) with a preset window level of 100 HU and a window width of 500 HU. The observers were allowed to adjust the window set during the evaluations. The reading time was not limited.
Quantitative analysis of transverse images was performed by a radiological technologist with eight years of experience in CT examinations. For the image noise measurements, circular regions of interest (ROIs) of 10 mm were placed within the paraspinal muscle. The standard deviation (SD) of attenuation measured at the level of the right portal vein represents image noise (Figure 2).9 Macroscopic fat infiltration was carefully avoided during the measurements. Each value was calculated by averaging three measurements.
Figure 2.

Example of image noise measurement in clinical image.
The reconstruction time of each reconstruction algorithm was measured for each algorithm due to its importance in clinical environment operations.
Phantom image assessment
The frequency characteristics of the image noise, image noise, and spatial resolution were assessed for all reconstruction parameters using CT measure version 098f (Japanese Society of CT Technology, Hiroshima, Japan).18
Noise power spectra (NPSs) were calculated to assess the frequency characteristics of the image noise, using the radial frequency method.19 A square ROI (256 × 256 pixels) was placed at the centre of the CTP 486 image. In previous studies,20,21 the low-contrast detectability of CT images depended on the noise power at low spatial frequencies. Thus, the area under the curve (AUC) of the NPS curve between 0.05 and 0.50 cycle/mm was integrated, and the square root of AUC (√AUCNPS) was used as an indicator of low-frequency image noise.22 The NPS curve for each protocol was acquired by averaging the NPS results from the 300 CT slices.
The SD of the CT number in the ROI was calculated as the magnitude of image noise.23 A square ROI (as described above) was used to calculate the mean value for each reconstruction method (n = 50 slices).
For spatial resolution assessment, task-based modulation transfer function (TTF) curves were calculated using the CTP 404 module. TTF curves were calculated according to the circular edge method.24 The ‘Task’ considered in this study was bone, contrast-enhanced vessels, and soft tissues. To improve the accuracy, 1,000 CT slices were used for the TTF measurements.
Statistical analyses
The visual evaluation scores and image noise of the phantom and clinical images were expressed as the mean and SD, whereas the reconstruction time was expressed as the median and interquartile range. We defined adequate image quality as an average visual evaluation score of ≥3. We hypothesised that the quality of the images reconstructed with New DLR would be superior to those reconstructed with the other three algorithms. Statistical analysis of the visual evaluation scores was performed using Dunnett’s test between New DLR and other reconstruction algorithms. Interobserver agreement was calculated using the κ (κ) statistic (≤ 0.20 = poor, 0.21–0.40 = fair, 0.41–0.60 = moderate, 0.61–0.80 = substantial, and 0.81–1.00 = almost perfect). Statistical significance was set at a p-value less than 0.05. Statistical analyses were performed using JMP Pro 14.2.0 (Statistical Analysis System Institute, Cary, NC, USA).
Results
Clinical image assessment
Figure 3 shows the clinical images acquired with each reconstruction and Table 3 summarises the detailed results of the clinical image analyses. The interobserver agreement was substantial (κ = 0.711; 95% confidence interval, 0.608–0.814). The overall image quality of New DLR was the best among all protocols, and there was a significant difference between New DLR and other reconstruction algorithms (p < 0.0001). All New DLR and Conv DLR images had an average overall image quality of ≥4 and ≥ 3, respectively, while only 13.3% (4/30) of the Conv DLR images were rated above average (score = 4).
Figure 3.

Clinical CT images of a 63-year-old female with a body mass index (BMI) of 22.5 kg/m2 (a–d) and of a 74-year-old female with a BMI of 16.3 kg/m2 (e–h). In cases a–d, liver metastasis of breast cancer was observed (arrows). Reconstruction was performed with New DLR (a and e), Conv DLR (b and f), Hybrid-IR (c and g), and MBIR (d and h).BMI, body mass index; DLR, deep learning-based reconstruction; Hybrid-IR, hybrid-iterative reconstruction; and MBIR, model-based iterative reconstruction.
Table 3.
Overall image quality and image noise of clinical image
| Reconstruction method | ||||
|---|---|---|---|---|
| New DLR (AiCE Body sharp) | Conv DLR (AiCE Body) | Hybrid-IR | MBIR | |
| Overall image quality | 4.2 ± 0.4 (4.0–5.0) | 3.3 ± 0.4a (3.0–4.0) | 2.7 ± 0.4a (2.0–3.0) | 2.1 ± 0.2a (2.0–3.0) |
| Difference from New DLR | - | 1.0 ± 0.2 (0.0–1.0) | 1.5 ± 0.5 (1.0–2.0) | 2.2 ± 0.3 (2.0–3.0) |
| Image noiseb | 20.3 ± 1.8 | 17.8 ± 1.5 | 25.0 ± 2.7 | 23.7 ± 3.1 |
DLR, deep learning-based reconstruction; AiCE, advanced intelligent clear-IQ engine; Hybrid-IR, hybrid-iterative reconstruction; MBIR, model-based iterative reconstruction
Unless otherwise indicated, data are mean and standard deviation with range in parentheses
indicates a significant difference between the new DLR and each reconstruction algorithm (p < 0.0001)
Data are shown with mean and standard deviation
The image noise reconstructed with New DLR, Conv DLR, Hybrid-IR, and MBIR were 20.3 ± 1.8, 17.8 ± 1.5, 25.0 ± 2.7, and 23.7 ± 3.1 HU, respectively (Table 3). The noise of the images reconstructed with New DLR was smaller than that of the images reconstructed with Hybrid-IR and MBIR. The image noise of the images reconstructed with Conv DLR was smaller than that of New DLR.
The median reconstruction times required with New DLR, Conv DLR, Hybrid-IR, and MBIR were 5.0 (range 3.3–6.5), 7.8 (range 5.4–9.6), 1.3 (range 0.96–1.6), and 54.2 (range 37.1–68.5) min, respectively. The median number of images in the 30 patients was 1216 (range 791–1481) (Figure 4). The reconstruction time required for New DLR was shorter than that required with Conv DLR.
Figure 4.
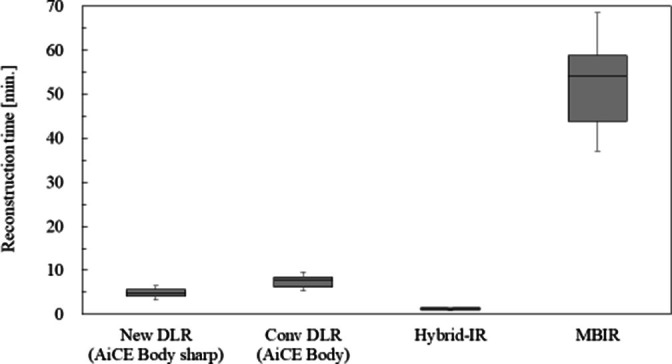
Box plot for reconstruction time in each reconstruction method.
The median CTDIvol, DLP, and SSDE for each phase were 9.8 mGy (range 5.8–14.7), 593.9 mGycm (range 400.5–1091.3), and 15.3 mGy (range 10.8–19.1), respectively.
Phantom image assessment
Figure 5 shows a comparison of the NPS curves acquired using each reconstruction algorithm. Although the shape of the NPS varied depending on the reconstruction algorithm, the low-frequency NPS values were lower in New DLR than in the other reconstruction algorithms. Table 4 shows the √AUCNPS value for each reconstruction algorithm, and the √AUCNPS value at New DLR was the lowest among all the reconstruction algorithms.
Figure 5.

Comparisons of NPS curves of New DLR, Conv DLR, Hybrid-IR, and MBIR. NPS, noise power spectrum; DLR, deep-learning-based reconstruction; AiCE, Advanced intelligent Clear-IQ Engine; Hybrid-IR, hybrid-iterative reconstruction; MBIR, model-based iterative reconstruction.
Table 4.
√AUCNPS and image noise acquired with phantom image
| Reconstruction method | ||||
|---|---|---|---|---|
| New DLR (AiCE Body sharp) | Conv DLR (AiCE Body) | Hybrid-IR | MBIR | |
| √AUCNPS value | 13.8 | 14.2 | 20.9 | 19.0 |
| Image noise of phantom imagea | 22.6 ± 0.2 (22.5–22.7) | 17.9 ± 0.1 (17.9–18.0) | 27.4 ± 0.2 (27.3–27.4) | 23.0 ± 0.3 (22.9–23.1) |
AiCE, advanced intelligent clear-IQ engine;DLR, deep-learning-based reconstruction; Hybrid-IR, hybrid-iterative reconstruction; MBIR, model-based iterative reconstruction.
Data are presented as means and standard deviations with 95% confidence intervals in parentheses
The SD values reconstructed with New DLR, Conv DLR, Hybrid-IR, and MBIR were 22.6 ± 0.2, 17.9 ± 0.1, 27.4 ± 0.2, and 23.0 ± 0.3 HU, respectively (Table 4). The noise of the images reconstructed with New DLR was lower than those of the images reconstructed with Hybrid-IR and MBIR. The image noise of the images reconstructed with Conv DLR was smaller than that of New DLR.
Figure 6 shows a comparison of the TTF measurements acquired using each reconstruction algorithm. The 50 and 10% TTF values acquired using each reconstruction algorithm are listed in Table 5. The 50 and 10% TTF values were highest in New DLR among all reconstruction algorithms, although the difference between New DLR and Conv DLR was slight. In all the reconstruction algorithms, the 50 and 10% TTF values increased in accordance with the module contrast.
Figure 6.

Comparisons of TTF curves of New DLR, Conv DLR, Hybrid-IR, and MBIR: (a) Teflon, (b) Delrin, (c) Polystyrene. TTF, task-based modulation transfer function; DLR, deep-learning-based reconstruction; AiCE, Advanced intelligent clear-IQ engine; Hybrid-IR, hybrid-iterative reconstruction; MBIR, model-based iterative reconstruction.
Table 5.
50% and 10% TTF values for the three contrast modules in each reconstruction method
| Reconstruction method | |||||
|---|---|---|---|---|---|
| New DLR (AiCE Body sharp) | Conv DLR (AiCE Body) | Hybrid-IR | MBIR | ||
| 50% TTF value | Teflon | 0.65 | 0.63 | 0.36 | 0.50 |
| Delrin | 0.37 | 0.37 | 0.31 | 0.31 | |
| Polystyrene | 0.36 | 0.36 | 0.36 | 0.29 | |
| 10% TTF value | Teflon | 1.26 | 1.26 | 0.79 | 1.13 |
| Delrin | 0.81 | 0.76 | 0.66 | 0.76 | |
| Polystyrene | 0.70 | 0.68 | 0.64 | 0.62 |
AiCE, advanced intelligent clear-IQ engine;DLR, deep-learning-based reconstruction;DLR, deep-learning-based reconstruction; Hybrid-IR, hybrid-iterative reconstruction; Hybrid-IR, hybrid-iterative reconstruction; MBIR, model-based iterative reconstruction; MBIR, model-based iterative reconstruction.
Discussion
The present study demonstrated the impact of a reconstruction algorithm on the image quality acquired by U-HRCT scanners. The overall image quality score of New DLR was the highest among those of the other reconstruction algorithms, and the results obtained from the phantom experiment supported this. Specifically, the √AUCNPS value for New DLR was the lowest among all reconstruction algorithms while maintaining spatial resolution. Therefore, we considered that the new DLR algorithm provided better image quality than conventional reconstruction algorithms, within a practical reconstruction time during U-HRCT.
The image noise in the clinical images was the lowest for Conv DLR, and the same results were obtained from the phantom image assessments. Conversely, the overall image quality based on visual evaluation was the highest in New DLR, which was inconsistent with the results pertaining to image noise. This can be explained by a comparison of √AUCNPS. Urikura et al22 previously showed that low-frequency components in the NPS curve affect the lesion detectability. In a previous study, √AUCNPS was reduced in Conv DLR compared to those in Hybrid-IR and MBIR.22 In this study, the √AUCNPS of New DLR was lower than that of Conv DLR, indicating that low-frequency components were the most suppressed in New DLR. Therefore, we considered that the overall image quality of New DLR was the best among all the reconstruction algorithms.
As discussed above, the image noise obtained from the SD measurement does not reflect the image quality of nonlinear images to which noise reduction algorithms (such as iterative reconstruction and deep-learning reconstruction) were applied. A nonlinear image should be assessed according to its frequency properties as they reportedly differ from those of filtered back projection images.20 Therefore, we believe that SD cannot be used to assess image noise in this study. Moreover, it is difficult to obtain √AUCNPS from clinical images. Therefore, further studies are needed to develop an image noise index that can be used in clinical imaging as image noise index has not been proposed.
Based on the results concerning spatial resolution, the difference between New DLR and Conv DLR was slight, although the 10% TTF values acquired with New DLR were superior to those acquired with other reconstruction algorithms. Thus, we consider that the spatial resolutions of New DLR and Conv algorithms were the same. The results of this study seem reasonable because the concept of DLR algorithms is to reduce image noise while maintaining the spatial resolution. Previous studies by Akagi et al10 and Narita et al25 reported that MBIR was superior to DLR with respect to the complexity of small high-contrast lesions such as small vessels and bile ducts. The TTF results in this study were inconsistent with those of previous studies. We speculate that this was because the size of the object was not considered in the TTF measurements. The result of the TTF measured using the circular edge method is dependent only on the contrast of the module and image noise.24 Therefore, further studies are needed to develop a measurement method for the spatial resolution that considers the size of the target object.
The reconstruction time of New DLR was shorter than those of Conv DLR and MBIR (mean reconstruction time; 5.0 min in New DLR, 7.8 min in Conv DLR, and 54.2 min in MBIR). This indicates that the optimised algorithm in New DLR is practical for clinical operation. In terms of reconstruction time alone, the required reconstruction time was the shortest for Hybrid-IR (1.3 min). However, the image quality of Hybrid-IR was worse than that of New DLR. Tanabe et al stated that in patients with stable conditions, such as COPD and asthma, a reconstruction time of approximately 30 min in MBIR was acceptable in routine clinical practice.26 Therefore, we believe that a reconstruction time of 5 min is clinically acceptable, except in extremely urgent cases. Therefore, the active use of New DLR should be recommended.
Compared to the radiation exposure in torso CT studies reported as the Japanese diagnostic reference levels,27 the radiation exposure of the present study was lower. The results of our clinical and phantom studies also suggest the possibility of further reducing the radiation dose. An association between the incidence of unstable chromosomal aberrations (CAs) in peripheral blood lymphocytes and cancer risk has been suggested by several epidemiologic studies,28,29 and the number of unstable CAs was significantly increased by the radiation dose in follow-up CT examinations.30,31 A phantom study by Higaki et al32 reported that DLR reduced the radiation dose by at least 30% while maintaining the image quality, and a clinical study by Nakamura et al9 demonstrated that as well. In our study, the radiation dose was reduced by 25%, almost equivalent to the reduction observed in previous studies. All New DLR images were rated above the average (score = 4) or higher. Because the image quality correlates with the radiation dose, it may be possible to reduce the radiation dose to a level where the average image quality is acquired using the new DLR algorithm. Although the decision to improve the image quality or reduce the radiation dose should be made according to the case and/or purpose, the radiation dose should be minimised in CT examinations. Further studies are required to demonstrate how the radiation dose can be reduced and/or its clinical usefulness using the new DLR algorithm.
This retrospective, single-institution study had several limitations. First, the sample size was small. Further large-scale studies are required to validate these results. Second, the body sizes of the patients were small (median body mass index, 19.8 kg/m2). Although we hypothesised that the relationship between patient body size and the impact of the reconstruction algorithm was not serious, further studies are needed to demonstrate the usefulness of the new DLR algorithm for larger-bodied patients. Third, this study evaluated the DLR algorithm developed by one manufacturer (Canon Medical Systems). Future studies comparing the image quality acquired with other DLR algorithms developed by several manufacturers are required.
In conclusion, this study demonstrated that the New DLR algorithm improved image quality within a clinically acceptable reconstruction time in U-HRCT. The new DLR algorithm may facilitate choosing whether to improve the image quality or reduce the radiation dose, depending on the case.
Contributor Information
Yuki Sakai, Email: yuki.sakai.san@gmail.com, Division of Radiology, Department of Medical Technology, Kyushu University Hospital, 3-1-1 Maidashi, Higashi-ku, Fukuoka, Japan.
Tomoyuki Hida, Email: hida.tomoyuki.632@m.kyushu-u.ac.jp, Department of Clinical Radiology, Graduate School of Medical Sciences, Kyushu University, 3-1-1 Maidashi, Higashi-ku, Fukuoka, Japan.
Yuko Matsuura, Email: urara1783pine@gmail.com, Department of Clinical Radiology, Graduate School of Medical Sciences, Kyushu University, 3-1-1 Maidashi, Higashi-ku, Fukuoka, Japan.
Takeshi Kamitani, Email: kamitani.takeshi.650@m.kyushu-u.ac.jp, Department of Clinical Radiology, Graduate School of Medical Sciences, Kyushu University, 3-1-1 Maidashi, Higashi-ku, Fukuoka, Japan.
Yasuhiro Onizuka, Email: onizuka.yasuhiro.836@m.kyushu-u.ac.jp, Division of Radiology, Department of Medical Technology, Kyushu University Hospital, 3-1-1 Maidashi, Higashi-ku, Fukuoka, Japan.
Takashi Shirasaka, Email: shirasaka.takashi.154@m.kyushu-u.ac.jp, Division of Radiology, Department of Medical Technology, Kyushu University Hospital, 3-1-1 Maidashi, Higashi-ku, Fukuoka, Japan.
Toyoyuki Kato, Email: kato.toyoyuki.715@m.kyushu-u.ac.jp, Division of Radiology, Department of Medical Technology, Kyushu University Hospital, 3-1-1 Maidashi, Higashi-ku, Fukuoka, Japan.
Kousei Ishigami, Email: ishigami.kosei.581@m.kyushu-u.ac.jp, Department of Clinical Radiology, Graduate School of Medical Sciences, Kyushu University, 3-1-1 Maidashi, Higashi-ku, Fukuoka, Japan.
REFERENCES
- 1. Tatsugami F, Higaki T, Nakamura Y, Yu Z, Zhou J, Lu Y, et al. Deep learning-based image restoration algorithm for coronary CT angiography. Eur Radiol 2019; 29: 5322–29. doi: 10.1007/s00330-019-06183-y [DOI] [PubMed] [Google Scholar]
- 2. Oostveen LJ, Boedeker KL, Brink M, Prokop M, de Lange F, Sechopoulos I. Physical evaluation of an ultra-high-resolution CT scanner. Eur Radiol 2020; 30: 2552–60. doi: 10.1007/s00330-019-06635-5 [DOI] [PMC free article] [PubMed] [Google Scholar]
- 3. Hino T, Kamitani T, Sagiyama K, Yamasaki Y, Matsuura Y, Tsutsui S, et al. Detectability of the artery of Adamkiewicz on computed tomography angiography of the aorta by using ultra-high-resolution computed tomography. Jpn J Radiol 2020; 38: 658–65. doi: 10.1007/s11604-020-00943-3 [DOI] [PubMed] [Google Scholar]
- 4. Hata A, Yanagawa M, Honda O, Kikuchi N, Miyata T, Tsukagoshi S, et al. Effect of matrix size on the image quality of ultra-high-resolution CT of the lung: comparison of 512 × 512, 1024 × 1024, and 2048 × 2048. Acad Radiol 2018; 25: 869–76: S1076-6332(17)30504-4. doi: 10.1016/j.acra.2017.11.017 [DOI] [PubMed] [Google Scholar]
- 5. Yamashita K, Hiwatashi A, Togao O, Kikuchi K, Matsumoto N, Momosaka D, et al. Ultrahigh-resolution CT scan of the temporal bone. Eur Arch Otorhinolaryngol 2018; 275: 2797–2803. doi: 10.1007/s00405-018-5101-6 [DOI] [PubMed] [Google Scholar]
- 6. Kakinuma R, Moriyama N, Muramatsu Y, Gomi S, Suzuki M, Nagasawa H, et al. Ultra-High-Resolution computed tomography of the lung: image quality of a prototype scanner. PLoS One 2015; 10(9): e0137165. doi: 10.1371/journal.pone.0137165 [DOI] [PMC free article] [PubMed] [Google Scholar]
- 7. Yanagawa M, Hata A, Honda O, Kikuchi N, Miyata T, Uranishi A, et al. Subjective and objective comparisons of image quality between ultra-high-resolution CT and conventional area detector CT in phantoms and cadaveric human lungs. Eur Radiol 2018; 28: 5060–68. doi: 10.1007/s00330-018-5491-2 [DOI] [PMC free article] [PubMed] [Google Scholar]
- 8. Sakai Y, Kitamoto E, Okamura K, Takarabe S, Shirasaka T, Mikayama R, et al. Low-radiation dose scan protocol for preoperative imaging for dental implant surgery using deep learning-based reconstruction in multidetector CT. Oral Radiol 2022; 38: 517–26. doi: 10.1007/s11282-021-00584-w [DOI] [PubMed] [Google Scholar]
- 9. Nakamura Y, Narita K, Higaki T, Akagi M, Honda Y, Awai K. Diagnostic value of deep learning reconstruction for radiation dose reduction at abdominal ultra-high-resolution CT. Eur Radiol 2021; 31: 4700–4709. doi: 10.1007/s00330-020-07566-2 [DOI] [PubMed] [Google Scholar]
- 10. Akagi M, Nakamura Y, Higaki T, Narita K, Honda Y, Zhou J, et al. Deep learning reconstruction improves image quality of abdominal ultra-high-resolution CT. Eur Radiol 2019; 29: 6163–71. doi: 10.1007/s00330-019-06170-3 [DOI] [PubMed] [Google Scholar]
- 11. Greffier J, Hamard A, Pereira F, Barrau C, Pasquier H, Beregi JP, et al. Image quality and dose reduction opportunity of deep learning image reconstruction algorithm for CT: a phantom study. Eur Radiol 2020; 30: 3951–59. doi: 10.1007/s00330-020-06724-w [DOI] [PubMed] [Google Scholar]
- 12. Brady SL, Trout AT, Somasundaram E, Anton CG, Li Y, Dillman JR. Improving image quality and reducing radiation dose for pediatric CT by using deep learning reconstruction. Radiology 2021; 298: 180–88. doi: 10.1148/radiol.2020202317 [DOI] [PubMed] [Google Scholar]
- 13. Singh R, Digumarthy SR, Muse VV, Kambadakone AR, Blake MA, Tabari A, et al. Image quality and lesion detection on deep learning reconstruction and iterative reconstruction of submillisievert chest and abdominal CT. AJR Am J Roentgenol 2020; 214: 566–73. doi: 10.2214/AJR.19.21809 [DOI] [PubMed] [Google Scholar]
- 14. Nishii T, Funama Y, Kato S, Iwasawa T, Yasuda N, Ota Y, et al. Comparison of visibility of in-stent restenosis between conventional- and ultra-high spatial resolution computed tomography: coronary arterial phantom study. Jpn J Radiol 2022; 40: 279–88. doi: 10.1007/s11604-021-01200-x [DOI] [PubMed] [Google Scholar]
- 15. Watanabe H, Honda E, Tetsumura A, Kurabayashi T. A comparative study for spatial resolution and subjective image characteristics of a multi-slice CT and a cone-beam CT for dental use. Eur J Radiol 2011; 77: 397–402. doi: 10.1016/j.ejrad.2009.09.023 [DOI] [PubMed] [Google Scholar]
- 16. Christner JA, Braun NN, Jacobsen MC, Carter RE, Kofler JM, McCollough CH. Size-specific dose estimates for adult patients at CT of the torso. Radiology 2012; 265: 841–47. doi: 10.1148/radiol.12112365 [DOI] [PubMed] [Google Scholar]
- 17. American Association of Physicists in Medicine . Size specific dose estimates (SSDE) in Pediatric and adult body CT examinations (Task Group 204). College Park, MD: American Association of Physicists in Medicine. 2011. Available from: https://www.aapm.org/pubs/reports/RPT_204.pdf [Google Scholar]
- 18. Ichikawa K. CTmeasure. JPN Japanese Society of CT Technology, Kasumi, Minami-Ku, Hiroshima 2014 Available From 2012. Available from: http://www.jsct-tech.org [Google Scholar]
- 19. Ghetti C, Ortenzia O, Serreli G. Ct iterative reconstruction in image space: a phantom study. Phys Med 2012; 28: 161–65. doi: 10.1016/j.ejmp.2011.03.003 [DOI] [PubMed] [Google Scholar]
- 20. Urikura A, Hara T, Ichikawa K, Nishimaru E, Hoshino T, Yoshida T, et al. Objective assessment of low-contrast computed tomography images with iterative reconstruction. Phys Med 2016; 32: 992–98: S1120-1797(16)30131-4. doi: 10.1016/j.ejmp.2016.07.003 [DOI] [PubMed] [Google Scholar]
- 21. Watanabe S, Ichikawa K, Kawashima H, Kono Y, Kosaka H, Yamada K, et al. Image quality comparison of a nonlinear image-based noise reduction technique with a hybrid-type iterative reconstruction for pediatric computed tomography. Phys Med 2020; 76: 100–108: S1120-1797(20)30148-4. doi: 10.1016/j.ejmp.2020.06.015 [DOI] [PubMed] [Google Scholar]
- 22. Urikura A, Yoshida T, Nakaya Y, Nishimaru E, Hara T, Endo M. Deep learning-based reconstruction in ultra-high-resolution computed tomography: can image noise caused by high definition detector and the miniaturization of matrix element size be improved? Phys Med 2021; 81: 121–29: S1120-1797(20)30319-7. doi: 10.1016/j.ejmp.2020.12.006 [DOI] [PubMed] [Google Scholar]
- 23. Samei E, Bakalyar D, Boedeker KL, Brady S, Fan J, Leng S, et al. Performance evaluation of computed tomography systems: summary of AAPM task group 233. Med Phys 2019; 46: e735–56. doi: 10.1002/mp.13763 [DOI] [PubMed] [Google Scholar]
- 24. Richard S, Husarik DB, Yadava G, Murphy SN, Samei E. Towards task-based assessment of CT performance: system and object MTf across different reconstruction algorithms. Med Phys 2012; 39: 4115–22. doi: 10.1118/1.4725171 [DOI] [PubMed] [Google Scholar]
- 25. Narita K, Nakamura Y, Higaki T, Akagi M, Honda Y, Awai K. Deep learning reconstruction of drip-infusion cholangiography acquired with ultra-high-resolution computed tomography. Abdom Radiol (NY) 2020; 45: 2698–2704. doi: 10.1007/s00261-020-02508-4 [DOI] [PubMed] [Google Scholar]
- 26. Tanabe N, Oguma T, Sato S, Kubo T, Kozawa S, Shima H, et al. Quantitative measurement of airway dimensions using ultra-high resolution computed tomography. Respir Investig 2018; 56: 489–96: S2212-5345(18)30216-8. doi: 10.1016/j.resinv.2018.07.008 [DOI] [PubMed] [Google Scholar]
- 27. Japan Network for Research and Information on Medical Exposure (J-RIME). National diagnostic reference levels in Japan: Japan DRLs 2020. 2020. http://www.radher.jp/J-RIME/report/DRL2020_Engver.pdf
- 28. Bonassi S, Norppa H, Ceppi M, Strömberg U, Vermeulen R, Znaor A, et al. Chromosomal aberration frequency in lymphocytes predicts the risk of cancer: results from a pooled cohort study of 22 358 subjects in 11 countries. Carcinogenesis 2008; 29: 1178–83. doi: 10.1093/carcin/bgn075 [DOI] [PMC free article] [PubMed] [Google Scholar]
- 29. Fucic A, Bonassi S, Gundy S, Lazutka J, Sram R, Ceppi M, et al. Frequency of acentric fragments are associated with cancer risk in subjects exposed to ionizing radiation. Anticancer Res 2016; 36: 2451–57. [PubMed] [Google Scholar]
- 30. Abe Y, Noji H, Miura T, Sugai M, Kurosu Y, Ujiie R, et al. Investigation of the cumulative number of chromosome aberrations induced by three consecutive CT examinations in eight patients. J Radiat Res 2019; 60: 729–39. doi: 10.1093/jrr/rrz068 [DOI] [PMC free article] [PubMed] [Google Scholar]
- 31. Sakane H, Ishida M, Shi L, Fukumoto W, Sakai C, Miyata Y, et al. Biological effects of low-dose chest CT on chromosomal DNA. Radiology 2020; 295: 439–45. doi: 10.1148/radiol.2020190389 [DOI] [PubMed] [Google Scholar]
- 32. Higaki T, Nakamura Y, Zhou J, Yu Z, Nemoto T, Tatsugami F, et al. Deep learning reconstruction at CT: phantom study of the image characteristics. Acad Radiol 2020; 27: 82–87: S1076-6332(19)30434-9. doi: 10.1016/j.acra.2019.09.008 [DOI] [PubMed] [Google Scholar]