

Abstract
Multiphasic scaffolds with tailored gradient features hold significant promise for tissue regeneration applications. Herein, this work reports the transformation of two-dimensional (2D) layered fiber mats into three dimensional (3D) multiphasic scaffolds using a ‘solids-of-revolution’ inspired gas-foaming expansion technology. These scaffolds feature precise control over fiber alignment, pore size, and regional structure. Manipulating nanofiber mat layers and Pluronic F127 concentrations allows further customization of pore size and fiber alignment within different scaffold regions. The cellular response to multiphasic scaffolds demonstrates the number of cells migrated and proliferated onto the scaffolds are mainly dependent on the pore size rather than fiber alignment. In vivo subcutaneous implantation of multiphasic scaffolds to rats reveals substantial cell infiltration, neo tissue formation, collagen deposition, and new vessel formation within scaffolds, greatly surpassing the capabilities of traditional nanofiber mats. Histological examination indicates the importance of optimizing pore size and fiber alignment for promotion of cell infiltration and tissue regeneration. Overall, these scaffolds have potential applications in tissue modeling, studying tissue-tissue interactions, interface tissue engineering, and high-throughput screening for optimized tissue regeneration.
Keywords: nanofiber mats, expansion, multiphasic scaffolds, gradients, tissue regeneration
Graphical Abstract
This paper presents Jingwei Xie group’s latest gas-foaming expansion technology series addition: customizable 3D multiphasic scaffolds transformed from layered 2D fiber mats. These methods precisely control fiber alignment and pore size in different portions of a single scaffold, demonstrating great potential in tissue regeneration in both in vitro and in vivo assessments.
1 |. INTRODUCTION
Scaffolds were recognized as having immense potential in various tissue regeneration applications as they provide a specialized environment that facilitates cellular infiltration, proliferation, and differentiation.[1–3] The surgical repair of tissue defects, often necessitated by trauma, congenital anomalies, malignancy, or infection, commonly involves autologous tissue grafting.[4,5] However, this approach has inherent limitations, including the limited availability of desired tissue, increased surgical time for harvesting, and the potential for tissue morbidity. Alternative strategies, such as cell delivery and the use of growth factors and cytokines, have shown limited promise and undesirable side effect profiles.[6] Biomaterials like titanium, bioglass, poly(methyl methacrylate), and poly(ether ether ketone) have also been explored.[7,8] Still, their lack of porosity and biological signaling hinder effective tissue regeneration and can lead to degradation and implant complications. Another concern is the ability of regenerative implants to degrade, as it directly impacts the tissue’s ability to reclaim the affected space.[9,10] Implants incorporating living cells and growth factors exhibit similar risk profiles to allografts and other biomaterials. Additionally, gradual histological variation, such as the transition from cortical to cancellous bone tissue in long bones, exemplifies the importance of seamless junctions and an optimized extracellular matrix (ECM).[11,12] Furthermore, the combination of three-dimensional (3D) printing and melt electrospinning has so far only yielded structures with limited thicknesses and microscale fibers.[13]
To replicate the intricate 3D architecture of the ECM and harness nanofiber-based scaffolds in tissue engineering, we previously introduced gas-foaming techniques.[1,2,14] These techniques transformed 2D nanofiber mats into complex 3D objects with controlled thickness and porosity. These objects, referred to as radially aligned scaffolds (RAS) and vertically aligned scaffolds (VAS), have demonstrated their capacity to guide cell migration from the periphery towards the center and from the bottom to the top, respectively. While they have exhibited tremendous potential in various applications, including regenerative medicine, soft tissue regeneration, bone regeneration, wound healing, and more,[8,15,16] these uniform scaffolds may not be optimal for repairing tissue interfaces characterized by variations in structural organization and composition.
Therefore, the aim of this study was to create multiphasic 3D nanofiber scaffolds with customized gradient features. Our focus centered on producing and characterizing 3D nanofiber scaffolds made from poly(L-lactide-co-ε-caprolactone) (PLCL), a biocompatible and biodegradable material used in Food and Drug Administration (FDA)-approved medical devices (e.g., Neurolac® and Caprolon®). Building upon our established gas-foaming expansion techniques and protocols for generating layered nanofiber mats, we successfully manufactured predesigned multiphasic PLCL scaffolds. These scaffolds comprised various regions featuring RAS and/or VAS with tailored pore sizes. Our approach introduces the innovative concept of multiphasic RAS and VAS, which enhances cell migration and infiltration within the scaffolds. In the VAS region, this bidirectional cell migration occurs from from top to bottom and bottom to top, while in the RAS region, migration predominantly proceeds from the periphery to the center. The alternating arrangement of RAS and VAS within the multiphasic scaffold holds the potential to synergistically enhance tissue regeneration. Additionally, by incorporating various pore sizes into multiphasic scaffolds, we can explore the impact of pore dimensions and alignment on tissue regeneration. For instance, bone tissue requires sufficient oxygen supply for cell proliferation and is highly vascularized, whereas adjacent cartilage tissue is avascular.[17] Thus, a biphasic scaffold with large pores on one side and smaller pores on the other side could mimic the vascular and avascular conditions of bone and cartilage, thereby enhancing regeneration at tissue interfaces. This methodology allows us to integrate diverse compositional gradients, maintain precise control over pore sizes, and align nanofibers within multiphasic scaffolds. Multiphasic scaffolds, consisting of alternating RAS and VAS regions, have the potential to synergistically enhance cell penetration from surrounding host tissues, promote neovascularization, and stimulate ECM production during tissue regeneration. This work opens exciting opportunities for the development of scaffolds that closely mimic the natural architecture of tissue interfaces, thereby likely enhancing their regenerative capabilities.
2 |. RESULTS AND DISCUSSION
We first fabricated RAS and VAS by converting PLCL nanofiber mats into cylinder-shaped objects through thermal fixation on one side and gas-foaming expansion, following our established protocols (Figures S1a and S1b). Figure S1c represents scanning electron microscopy (SEM) images capturing cross-sectional views in the X-Y plane of cylinder-shaped scaffolds characterized by radially aligned nanofibers and an abundance of thin layers. Likewise, Figure S1d displays SEM images illustrating cross-sectional views (X-Y plane) of cylinder-shaped scaffolds consisting of vertically aligned nanofibers and numerous layers. Figures S1e and S1f showcase SEM images of side views of both RAS and VAS, indicating that both RAS and VAS feature open pores on the surface and layered structures. Gap distances between adjacent layers at different regions (i)-(iv) and channel lengths were determined following our previously reported method.[8] The average gap distances of RAS in regions (i)-(iv) measured 57 ± 23 μm, 289 ± 44 μm, 548 ± 29 μm, and 764 ± 67 μm, indicating a gradual increase in gap distances from the center to the edge. For VAS in regions (i)-(iv), the average gap distances were 86 ± 32 μm, 297 ± 69 μm, 786 ± 39 μm, and 1214 ± 100 μm, demonstrating a similar tread of gradually increasing gap distances from the center to the periphery (Figures S2a and S2b). Furthermore, Figures S2c and S2d illustrate the distributions of channel lengths in RAS and VAS. In RAS, channel lengths were predominantly in the range of 0 to 3 mm, with a major peak occurring at 1.5–2 mm. In contrast, channel lengths in VAS primarily fell within the range of 0.5 to 2.5 mm, with a major peak observed at 0.5–1 mm.
To demonstrate the fabrication of scaffolds featuring biphasic fiber organization, we generated 2D PLCL mats, which consisted of two layers with varying thicknesses (0.5 mm, 0.5 mm or 0.7 mm, 0.3 mm or 0.3 mm, 0.7 mm), comprised of uniaxially aligned nanofibers stacked orthogonally. We thermally fixed the edge perpendicular to the direction of fiber orientation in one layer and parallel to the other layer (Figure 1a). Following our previously established protocol, including the gas-foaming expansion, gelatin coating, crosslinking and freeze-drying, we obtained the biphasic cylinder-shaped scaffolds consisting of RAS and VAS in the varying ratios of 50%:50%, 70%:30%, or 30%:70% (Figures 1b(1)–(3) and S3a–c).[14,15] To further demonstrate the fabrication of scaffolds featuring multiphasic fiber organization, we produced 2D PLCL mats consisting of four layers (each 0.25 mm thick) of uniaxially aligned nanofibers by alternating their stacking (Figure 1a). Using a similar principle as previously described, we produced multiphasic cylinder-shaped scaffolds containing RAS and VAS in equal proportions (25%:25%:25%:25%), as seen in Figures 1b(4) and S3d. Figures 1c(I)–e(I) show SEM images of the top views of biphasic scaffolds with RAS and VAS ratios of 50/50, 70/30, and 30/70. Figures 1c(II)–e(II) provide higher magnification SEM images highlighting the boundary between RAS and VAS, marked by a dotted yellow line. Additionally, Figure 1f(I) shows a SEM image of the top view of multiphasic scaffolds with alternating RAS and VAS, and Figure 1f(II) delineates the border between RAS and VAS, also indicated by a dotted yellow line. Using our previously established method, we analyzed the gap distances in regions (i)-(iv) from the center to the edge of cylindrical scaffolds.[8] It is worth noting that there was a gradual increase in gap distances from regions (i) to (iv) in both RAS and VAS sections of all the scaffolds (Figures 1g–j), and this trend appeared independent of the ratios of RAS and VAS. In biphasic scaffolds containing 30%, 50%, and 70% VAS, most channels within the VAS regions exhibited lengths within the following ranges: 1–1.5 mm, 0.5–1 mm, and 2–2.5 mm, respectively (Figures 1k–m). Conversely, in biphasic scaffolds comprising 30%, 50%, and 70% RAS, the predominant channel lengths within the RAS sections were distributed within the ranges of 1–1.5 mm, 1.5–2 mm, and 0.5–1 mm, respectively (Figures 1k–m). For multiphasic scaffolds composed of alternate RAS and VAS, the channel lengths in both RAS and VAS sections showed an approximately normal distribution ranging from 0.5 mm to 3 mm, with major peaks at 1.5–2 mm and 1–1.5 mm (Figure 1n). While we have demonstrated the fabrication of biphasic and multiphasic scaffolds containing RAS and VAS in two and four alternate regions, it is also feasible to create scaffolds composed of numerous alternating thin layers comprised of radially and vertically aligned nanofibers. Such a scaffold has the potential to facilitate and enhance cellular infiltration from all surrounding areas rather than being limited to specific directions following implantation to the tissue defects. For example, this scaffold could provide nanotopographic cues to direct and enhance host cell migration from the surrounding healthy bone tissue, dura matter underneath, and periosteum on the top into the cranial bone defect after implantation.
Figure 1. Fabrication and characterization of biphasic and multiphasic scaffolds.

(a) Schematic showing 2D layered nanofiber mats with alternating fiber alignments in different layers. (b) Photographs showing the cross-sectional view of biphasic scaffolds made of (1) 50:50, (2) 70:30, and (3) 30:70 ratios of RAS and VAS. (4) The cross-sectional image of a multiphasic scaffold with alternating RAS and VAS arrangement. (c) SEM images of biphasic scaffolds made of RAS and VAS at a ratio of 50/50: (I) overview of the scaffold. (II) enlarged intersectional area. (d) SEM images of biphasic scaffolds made of RAS and VAS at a ratio of 70/30: (I) overview of the scaffold. (II) enlarged intersectional area. (e) SEM images of biphasic scaffolds made of RAS and VAS at a ratio of 30/70: (I) overview of the scaffold. (II) enlarged intersectional area. (f) SEM images of multiphasic scaffolds consisting of alternating RAS and VAS: (I) overview of the scaffold. (II) enlarged intersectional area. Yellow dotted lines indicate the boundary between RAS and VAS. (g-i) Gap distance from center to periphery (regions i-iv) of the biphasic scaffolds composed of RAS and VAS at ratios of 50:50, 70:30, and 30:70. (j) Gap distance from center to periphery of multiphasic scaffolds consisting of alternating RAS and VAS. (k-m) Channel length distribution from center to periphery of the biphasic scaffolds composed of RAS and VAS at ratios of 50:50, 70:30, and 30:70. (n) Channel length distribution from center to periphery of the multiphasic scaffolds consisting of alternating RAS and VAS. RAS: radially aligned scaffold; VAS: vertically aligned scaffold. The data were presented as mean ± standard deviation (SD), with a sample size of N = 5. Statistical significance was indicated as *p < 0.05, **p < 0.01, and ***p < 0.001. A p-value greater than 0.05 was considered statistically nonsignificant (ns).
Next, to fabricate biphasic scaffolds featuring dual variations in gap distance and fiber alignment, we began by preparing a 1-mm thick PLCL mat. One half of this mat consisted of uniaxially aligned nanofibers, while the other half was composed of randomly oriented nanofibers (Figure 2a(1)). We controlled the fiber alignment by adjusting the rotating speed of the mandrel during the electrospinning process. Higher rotating speeds (>2000 rpm) resulted in highly aligned nanofibers, whereas lower speeds (<100 rpm) produced random fibers. After the expansion process, biphasic 3D scaffolds exhibited differing gap distances between adjacent layers in two distinct regions, as indicated by dotted blue and red lines (Figure 2b(1)). The region consisting of aligned nanofibers displayed larger gap distances than the section containing random fibers (Figures 2c(I)). This variation could be attributed to marginal fiber entanglement and the ease of separating layers in the aligned portion due to the layer-by-layer deposition during the electrospinning process (Figure 2c(II)). In contrast, the randomly organized fibers exhibited more entanglement, posing challenges in layer separation and resulting in smaller gap distances (Figure 2c(III)). Employing a similar principle, we transformed a nanofiber mat made of three layers, each with different fiber organizations, into a triphasic scaffold (Figures 2a(2), b(2), and d). We produced 2D nanofiber mats with three layers, incorporating aligned, partially aligned, and random fibers were by adjusting the rotating speed of the mandrel during the electrospinning process (Figures 2a(2)). The resulting expanded 3D triphasic scaffolds showcased three distinct regions, as indicated by dotted red and blue lines in Figures 2b(2). Gap distances decreased progressively from the aligned to the partially aligned to the random portions (Figures 2d(I-III)). To demonstrate the fabrication of multiphasic scaffolds featuring dual disparities in fiber organization and gap distances, we produced a 1-mm thick mat composed of alternating aligned and random fibers by controlling the rotating speed of the mandrel at different intervals (Figure 2a(3)). After expansion, the obtained scaffold exhibited four regions, as indicated by dotted blue and red lines in Figure 2b(3) (Figure 2E(I)). SEM images of the top views reveal that the gap distances in the aligned portion appeared larger than those in the random counterpart (Figures 2e (II,III)). We further quantified the gap distance, fold change in volume change, porosity, and normalized density of these scaffolds (Figures 2f–I and S4). In the triphasic scaffold consisting of aligned, partially aligned, and random fibers, the clear gradient in the gap distance was observed (Figure 2f). Correspondingly, the fold change in volume, porosity, and normalized density exhibited graded variations from the aligned portion to the partially aligned portion to the random portion (Figures 2g–i). Overall, for both biphasic and multiphasic scaffolds, the gap distances, volume, and porosity were consistently larger in the aligned portion compared to the random portion, while the normalized densities displayed the opposite trend (Figures S4a–d). These techniques provide a straightforward means to control the porosity of multiphasic scaffolds without the need for crosslinkers,[18] solvents,[19] surfactants,[3] template agents,[20] catalysts,[21] or cryoprotectant.[22] Furthermore multiphasic scaffolds featuring dual gradients in gap distance and fiber organization hold significant potential for emulating the intricate structure of the ECM and modulating cellular behavior.[23] Such scaffolds offer promise for accurately replicating collagen fiber arrangements in different tissues and developing in vitro 3D tissue models to study tissue-tissue interactions, such as muscle-bone and nerve-muscle interactions.[24]
Figure 2. Controlling the fiber organization in biphasic, triphasic, and multiphasic scaffolds.

(a) Schematic of layered nanofiber mats consisting of: (1) random and aligned fiber layers, (2) aligned, partially aligned, and random fiber layers, and (3) alternating aligned and random fiber layers. (b) Photographs showing the top view of the expanded scaffold consisting of (1) random and aligned fiber layers, (2) aligned, partially aligned, and random fiber layers, and (3) alternating aligned and random fiber layers. (c) SEM images of biphasic scaffolds: (I) intersectional region of aligned and random fibers, (II) region of aligned fibers, and (III) region of random fibers. (d) SEM images of triphasic scaffolds: (I) region of aligned fibers, (II) region of partially aligned fibers, and (III) region of random fibers. (e) Multiphasic scaffolds: (I) Schematic showing multiphasic scaffolds composed of alternating random and aligned fiber regions, (II) region of aligned fibers, and (III) region of random fibers. (f) Gap distance from center to periphery of scaffolds constructed with aligned, partially aligned, and random fibers. (g) Fold change in volume. (h) Porosity. (i) Normalized density. The data were presented as mean ± standard deviation (SD), with a sample size of N = 5. Statistical significance was indicated as *p < 0.05, **p < 0.01, and ***p < 0.001. A p-value greater than 0.05 was considered statistically nonsignificant (ns).
To generate multiphasic scaffolds with varying fiber alignment and gap distance gradients, we introduced an alternative approach. We first produced a 2D mat consisting of four layers of uniaxially aligned nanofiber membranes, with each layer having a thickness of 0.25 mm. These layers contained varying amounts of of F127 (0%, 0.5%, 1.0%, and 1.5%), as previous studies have shown that incorporating the surfactant F127 can stabilize the gas bubbles and significantly enhance the expansion of 2D nanofiber mats (Figure 3a).[3] Similar to what was demonstrated in Figure 1, the resulting multiphasic scaffolds consisting of RAS or VAS exhibited a clear trend where the gap distance increased as the F127 content in the fibers increased moving from region (i) to (iv) (Figures 3b–d). These findings underscored our ability to control both fiber alignment and pore size within multiphasic scaffolds. To illustrate multiple alignments and gap distances within a single 3D scaffold, we created a 1-mm thick mat comprising four layers of uniaxially aligned nanofiber. In this structure, two adjacent layers were stacked orthogonally, with each layer containing a F127 concentration ranging from 0% to 1.5% (Figure 3a). The mat was thermally fixed and expanded to form the scaffold, which consisted of four distinct regions labeled by dotted red, blue, yellow, and purple lines (Figures 3b (3)). Figure 3e displays SEM images of the top views of the scaffold’s quadrants, where the first and second quadrants, consisting of radially aligned nanofibers, differed in pore size (Figures 3e(I,II)). The second quadrant exhibited larger pores than the first quadrant. The third quadrant (Figure 3e(III)) consisting of vertically aligned nanofibers, displayed a larger pore size compared to the second quadrant (Figure 3e(II)), which comprised radially aligned nanofibers. Similarly, the fourth quadrant (Figure 3e(IV)), consisting of vertically aligned nanofibers, featured a larger pore size than the third quadrant. The increased pore size could be attributed to the higher F127 concentration, as F127 can exist at the interface between gas and liquid phases, stabilizing gas bubble, and concurrently enhancing the hydrophilicity of PLCL nanofibers. Furthermore, we quantified the influence of F127 concentration on the gap distance, volume, and porosity of each quadrant in the scaffolds (Figures 3f–h). Regardless of the fiber alignment in each quadrant, an increase in F127 concentration significantly correlated with increased gap distance and volume, while density decreased. This observation underscored our ability to fine-tune the physical properties of each quadrant by adjusting the F127 concentration and fiber alignment. This versatile technique holds great potential for various applications in tissue regeneration, given that the optimal pore size and porosity often differ among different tissue types.[25]
Figure 3. Control of pore size and alignment in multiphasic scaffolds.

(a) Schematic of layered nanofiber mats with fibers in each layer parallel, perpendicular, or alternating parallel/perpendicular to the thermally fixed side containing different concentrations of F-127. (b) Photographic images showing the cross-sectional view of the multiphasic scaffold, highlighting the specific areas (RAS, VAS, RAS/VAS) containing different amounts of F127 (Scale bar = 1 cm). (c-d) SEM images depicting the morphology of each section of the multiphasic RAS and VAS. (e) SEM images illustrating each section’s morphology of a multiphasic scaffold consisting of alternating RAS and VAS. (f) Gap distance from center to periphery (regions i-iv). (g) Fold change in volume. (h) Normalized density. (I) section of RAS or VAS without containing F127; (II) section of RAS or VAS containing 0.5% F127; (III) section of RAS or VAS containing 1% F127; (IV) section of RAS or VAS containing 1.5% F127. The data were presented as mean ± standard deviation (SD), with a sample size of N = 5. Statistical significance was indicated as *p < 0.05, **p < 0.01, and ***p < 0.001. A p-value greater than 0.05 was considered statistically nonsignificant (ns).
Following the fabrication of multigradient features in 3D expanded scaffolds, we examined how distinct fiber organizations, alignments, or gap distances contribute to the mechanical properties of multiphasic scaffolds (Figures S5–7). Our initial focus was on assessing the mechanical properties of RAS and VAS before and after coating with 0.5% gelatin. Remarkably, the compressive stress of both RAS and VAS exhibited a threefold increase after applying gelatin coating compared to their non-coated counterparts, particularly evident at a 90% strain (Figure S5a). Notably, the gelatin-coated VAS demonstrated a significantly elevated elastic modulus than the gelatin-coated RAS (Figure S5b). Interestingly, our investigation into fiber alignment demonstrated a notable pattern in the compressive stress of 3D expanded nanofiber scaffolds at 90% compressive strains (Figure S6). The results revealed a progressive increase in compressive stress from aligned to partially aligned fiber, reaching its peak in scaffolds made with random fibers. Subsequently, we explored the impact of the surfactant F127 on the mechanical characteristics of multiphasic RAS and VAS. As depicted in Figure S7, the maximum compressive stress at 90% strain diminishes in both RAS and VAS with increasing concentrations of F127. Remarkably, RAS and VAS devoid of F127 exhibited the most pronounced compressive strength compared to other formulations (Table S1). These findings underscore the feasibility of tailoring the mechanical properties of nanofiber scaffolds alongside their multi-gradient features.
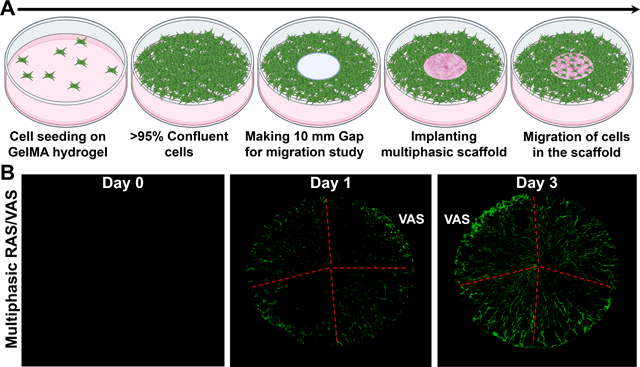
To investigate the impact of multi-gradient features, such as gap distances and fiber organizations, within a multiphasic scaffold on cellular response, we assessed cell migration using an in vitro wound model, following our previously established protocol.[3,8] In brief, green fluorescent protein (GFP) labeled fibroblasts were seeded onto GelMA hydrogel and allowed to reach confluency (>95%). Subsequently, we created a 10-mm defect at the center of the hydrogel using a punch, and then inserted a multiphasic scaffold consisting of four regions with varying gap distances and fiber organizations into the defect (Figure 4a). The migration of cells from the GelMA hydrogel to different regions of the multiphasic scaffold was monitored using confocal laser scanning microscopy (CLSM).[3,8] The CLSM images revealed consistent cellular migration from the GelMA hydrogel to the scaffolds, with more cells observed on Day 3 than on Day 1, indicating time-dependent migration (Figures 4b–d). Notably, in quadrants with larger pores resulting from a higher concentration of F127 (e.g., 1.5% F127), cells were unable to fill the gaps. Instead, they migrated along the radial direction of scaffolds without completing gap closure for both multiphasic RAS and VAS (Figures 4b,c). Despite the increased cell migration observed on Day 3, visible pores indicated that the gaps were not filled, suggesting that cells could not migrate effectively when the pore size within the scaffolds was excessively large. The cell migration behavior observed in multiphasic scaffolds consisting of alternating RAS and VAS was similar to that seen in sections of scaffolds comprising RAS and VAS without the incorporation of F127 (Figure 4d). Interestingly, cells exhibited comparable migration behavior on multiphasic VAS and RAS. We speculate that the ridge structure on the top surface of multiphasic VAS may have effects similar to radially aligned nanofibers, guiding and promoting cell migration. Although we did not examine cell migration along the axial direction in this study, based on our previous research, multiphasic VAS can enhance cell migration along the axial direction as well.[3,8] Notably, as the 3D nanofiber scaffolds incorporate FDA-approved PLCL materials coated with gelatin, with a well-documented non-toxic nature,[26–28] we opted not to perform additional toxicity tests. All these findings underscore the significance of tailoring dual gradient features, specifically pore size and fiber alignment, within multiphasic scaffolds to regulate cell behavior and response. The promotion of cell migration through precisely controlled pore size and fiber alignment has the potential to facilitate wound healing and tissue regeneration. Moreover, the incorporation of distinct bioactive molecules within specific quadrants could further enhance therapeutic potential, enabling synergistic effects in modulating cellular responses within multiphasic scaffolds.
Figure 4. Cell Migration Study in an in vitro wound model.

(a) Schematic representation of the experimental procedure. (b-d) Fluorescence images of GFP-labeled dermal fibroblasts on the scaffolds captured after 0, 1, and 3 days of culture. (I) section of RAS or VAS without containing F127; (II) section of RAS or VAS containing 0.5% F127; (III) section of RAS or VAS containing 1% F127; (IV) section of RAS or VAS containing 1.5% F127. Multiphasic RAS: multiphasic scaffold composed of four regions of RAS and each region contained different concentrations of F127. Multiphasic VAS: multiphasic scaffold composed of four regions of VAS and each region contained different concentrations of F127. Multiphasic RAS/VAS: multiphasic scaffolds composed of alternating RAS and VAS without containing F127. Scale bar = 2 mm.
Previous studies demonstrated the fabrication of scaffolds consisting of either RAS or VAS, each having a uniform structure.[16] These scaffolds facilitated improved cell migration, with RAS promoting movement from the outer edge towards the center, and VAS enabling movement either from top to bottom or bottom to top. Nevertheless, these uniform scaffolds can only guide cell infiltration in specific directions. Consequently, we proposed a hypothesis that multiphasic scaffolds, comprising both RAS and VAS, could effectively encourage cell infiltration in various directions, thus enhancing tissue regeneration. Specifically, within the VAS section, cell infiltration could occur bidirectionally, from top to bottom and vice versa, while in the RAS section, it could facilitate cell infiltration form the periphery towards the center. Additionally, by incorporating variation in gap distances, we aimed to investigate the combined effect of gap distance and fiber alignment on host cell response. To assess their regenerative potential, we implanted three types of multiphasic scaffolds subcutaneously in rats as acellular constructs (Figures S8a,b). Furthermore, we used a uniaxially aligned nanofiber mat as a control for comparison. Following 14 and 28 days of implantation, we observed no signs of inflammation or necrosis in the surrounding tissues (Figures S8c,d). Remarkably, histological examination using H&E staining revealed substantial cellular infiltration throughout the multiphasic scaffolds after 2 weeks of implantation, a phenomenon absent in the control group even after 4 weeks (Figures 5a,b). Over time, an increasing number of cells penetrated the multiphasic scaffolds, ultimately resulting in the formation of new tissue and vessel at 4 weeks (Figure 5b). Interestingly, regions of scaffolds consisting of RAS or VAS with a higher amount of F127 (1% and 1.5%), which exhibited larger gaps between adjacent fiber layers, showed reduced cellular infiltration compared to regions containing lower amount of F127 (0% and 0.5%) with smaller gaps (Figure 5). Notably, multiphasic scaffolds with four regions alternating between RAS and VAS appeared to exhibit similar levels of cellular infiltration in different regions. These results align with our in vitro findings (Figure 4). However, 2D nanofiber mats showed very minimal cellular infiltration even after 4 weeks of implantation. These collective results underscore that nanofiber mats with small pores and 3D scaffolds with excessively large pores are suboptimal for tissue regeneration. An ideal multiphasic scaffold should possess an optimal pore size and fiber organization to promote cell infiltration. [28,29]
Figure 5. Impact of pore size and alignment on host cell infiltration in multiphasic scaffolds.
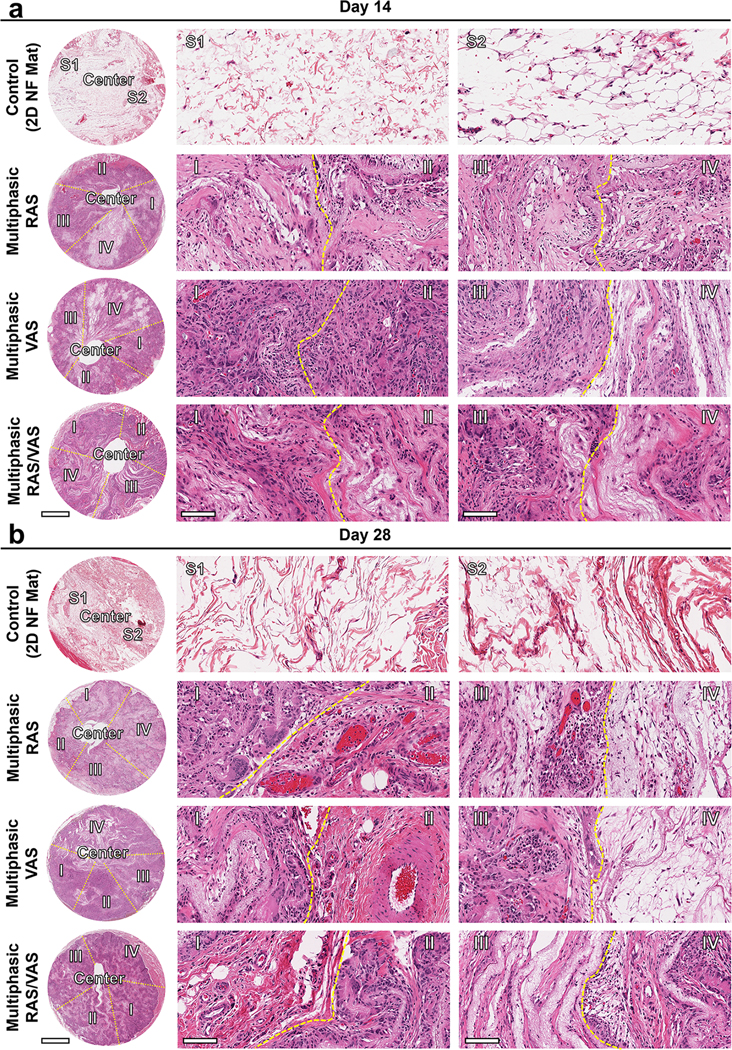
(a) and (b): Representative H&E staining of sections of various explants on days 14 and 28. Control: 2D PLCL NF mat; S1: random section 1; S2: random section 2. Multiphasic RAS: (I) section of RAS without containing F127; (II) section of RAS containing 0.5% F127; (III) section of RAS containing 1% F127; (IV): section of RAS containing 1.5% F127. Multiphasic VAS: (I) section of VAS without containing F127; (II) section of VAS containing 0.5% F127; (III) section of VAS containing 1% F127; (IV) section of VAS containing 1.5% F127. Multiphasic RAS/VAS: (I): section of RAS; (II) section of VAS; (III) section of RAS; (IV) section of VAS. Scale bars = 2 mm (left panels) and 100 μm (middle and right panels).
We further assessed host cell infiltration by quantifying the percentages of cell-infiltrated area and cell counts per region of interest (ROI) in different sections of the samples (Figure 6a). After 2 weeks of implantation, the percentages of cell-infiltrated areas in regions (I)-(IV) of scaffolds consisting of RAS were measured at 65 ± 6 %, 74 ± 9 %, 81 ± 6 %, and 43 ± 11%, respectively. These percentages increased to 96 ± 4 %, 97 ± 2%, 89 ± 8 %, and 62 ± 5 % after 4 weeks (Figure 6b). Likewise, in the case of multiphasic scaffolds composed of VAS, the proportions of cell-infiltrated areas in regions (I)-(IV) observed the 2-week mark were 56 ± 3 %, 77 ± 6 %, 68 ± 10 %, and 37 ± 5 %. Subsequently, these percentages increased to 96 ± 2 %, 97 ± 2 %, 83 ± 7 %, and 58 ± 9 % after 4 weeks. In contrast, multiphasic scaffolds consisting of alternating RAS and VAS yielded favorable results, with cell infiltration areas of 82 ± 7 %, 78 ± 9 %, 73 ± 11 %, and 85 ± 3 % within regions (I)-(IV) after 2 weeks. These values further improve to 97 ± 2 %, 97 ± 3 %, 98 ± 1 %, and 98 ± 1 % after 4 weeks (Figure 6b). Additionally, we recorded the quantity of infiltrated cells in regions (I)-(IV) within the multiphasic scaffolds composed of RAS. At the 2-week mark after implantation, these number were 222 ± 57, 307 ± 41, 229 ± 21, and 168 ± 11 per ROI. Subsequently, these figures increased to 346 ± 33, 412 ± 31, 302 ± 11, and 259 ± 8 after 4 weeks (Figure 6c). Similar trends were observed in the multiphasic VAS scaffolds. In contrast, multiphasic scaffolds composed of alternating RAS and VAS demonstrated favorable results, with cell counts per ROI of 357 ± 32, 371 ± 43, 403 ± 39, and 392 ± 26 within regions (I)-(IV) after 2 weeks. These values subsequently increased to 531 ± 21, 664 ± 31, 594 ± 48, and 639 ± 19 after 4 weeks. However, the number of cells infiltrated into the 2D nanofiber mat was recorded as 30 ± 12 and 54 ± 9 after 2 and 4 weeks, respectively, suggesting that the small pore size of the 2D nanofiber mat hinders cell penetration, despite its ability to mimic the ECM structure.[29] These findings strongly suggest that the gap distance within the expanded nanofiber scaffold plays a key role in enhancing cellular infiltration, thus facilitating the formation of new tissues. These results collectively demonstrated that a small pore size in 2D nanofiber mats and excessively large gap distances in 3D expanded nanofiber scaffolds are suboptimal for tissue regeneration. It seems that there is an optimized gap distance in expanded nanofiber scaffolds that maximizes cellular infiltration.
Figure 6. Host cell infiltration in subcutaneously implanted multiphasic scaffolds in rats after 14 and 28 days compared to 2D nanofiber mats.
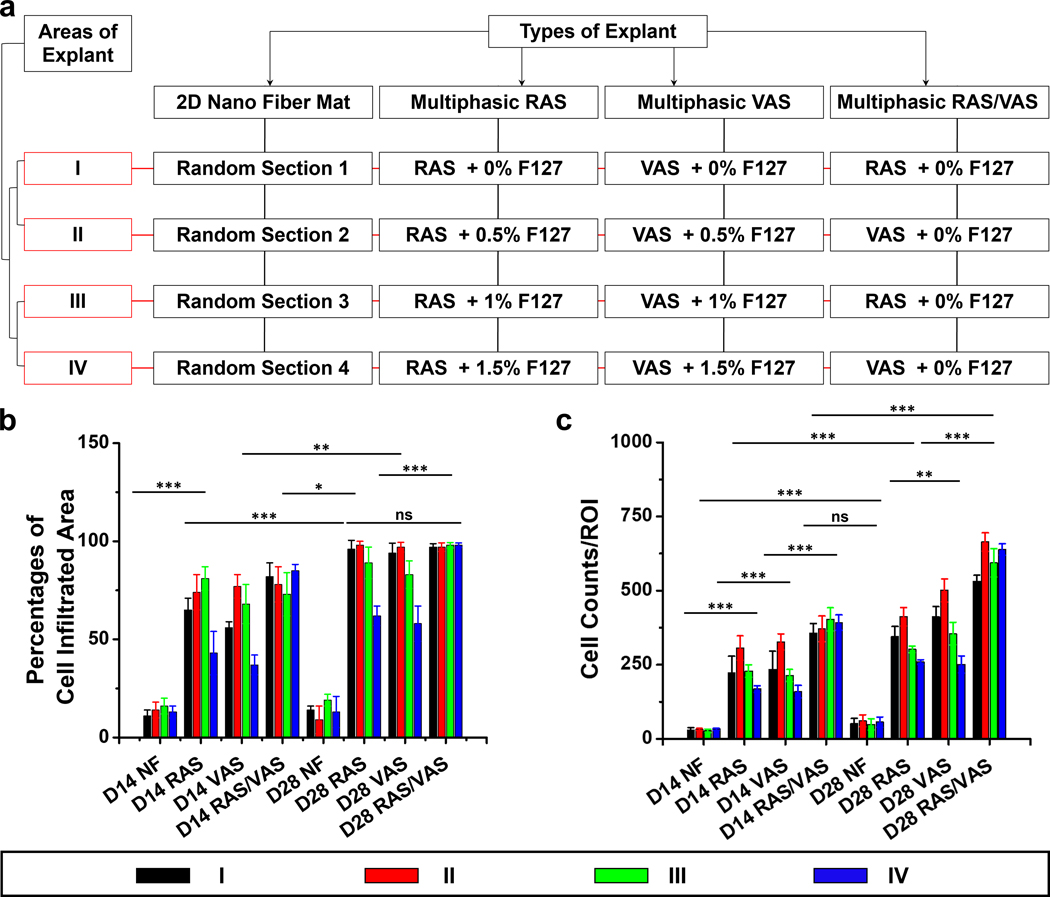
(a) Diagram depicting the different types of scaffolds and their respective sections. (b) Percentages of host cell infiltration area in each region of the explants. (c) Number of host cells migrated from host tissue into each region of the scaffolds. D14: 14 days after implantation; D28: 28 days after implantation; NF: 2D nanofiber mat; Multiphasic RAS: multiphasic scaffold composed of four regions of RAS and each region contained different concentrations of F127. Multiphasic VAS: multiphasic scaffold composed of four regions of VAS and each region contained different concentrations of F127. Multiphasic RAS/VAS: multiphasic scaffolds composed of alternating RAS and VAS without containing F127. The data were presented as mean ± standard deviation (SD), with a sample size of N = 12. Statistical significance was indicated as *p < 0.05, **p < 0.01, and ***p < 0.001. A p-value greater than 0.05 was considered statistically nonsignificant (ns).
To gain further insights into ECM collagen deposition and blood vessel formation, we conducted Masson’s Trichrome (MT) staining of explants (Figure 7). Within the 2D nanofiber mats, minimal collagen deposition and no new blood vessels were evident after 2 and 4 weeks of implantation due to limited cellular infiltration. In contrast, a substantial amount of collagen was deposited in region (I) of the multiphasic scaffold consisting of RAS after both 2 and 4 weeks of implantation. Notably, collagen deposition appeared to decrease gradually from regions (I)-(IV), with region (I) exhibiting the highest amount and region (IV) displaying the lowest. We proceed to quantitatively assess collagen coverage and the number of blood vessels based on the MT staining images. The percentages of collagen coverage in regions (I)-(IV) of scaffolds consisting of RAS, two weeks post-implantation, were approximately 73 ± 5%, 67 ± 8%, 51 ± 7%, and 39 ± 4%, respectively. These percentages increased to 88 ± 3%, 91 ± 4%, 73 ± 8%, and 57 ± 6% after 4 weeks (Figure 7a). Likewise, in the case of multiphasic scaffolds composed of VAS, observed 2 weeks post-implantation, the proportions of collagen coverage within regions (I)-(IV) were approximately 62 ± 7%, 71 ± 9%, 59 ± 5%, and 43 ± 6%. Subsequently, these percentages increased to 72 ± 4%, 81 ± 6%, 51 ± 7%, and 49 ± 3% after 4 weeks. In contrast, multiphasic scaffolds consisting of alternating RAS and VAS yielded highly promising outcomes, showcasing collagen coverage of 80 ± 4%, 86 ± 5%, 88 ± 1%, and 90 ± 3% within regions (I)-(IV) after the 2-week mark. Impressively, these values increased to 98 ± 1%, 96 ± 3%, 94 ± 3%, and 97 ± 2% after 4 weeks (Figure 8a). Moreover, within the multiphasic scaffolds composed of RAS, the number of blood vessels within regions (I)-(IV) was quantified as 8 ± 4, 12 ± 3, 7 ± 2, and 3 ± 2 per mm2 at the 2-week post-implantation mark (Figure 8b). Remarkably, these figures exhibited a substantial increase to 19 ± 7, 26 ± 4, 20 ± 6, and 7 ± 3 after 4 weeks (Figure 8b). A similar trend in blood vessel formation was observed in the multiphasic VAS scaffolds. Notably, over the 4-week duration, significant enhancement in blood vessel formation was evident within regions (I)-(IV) of the multiphasic scaffolds comprising alternating RAS and VAS, with recorded values of 31 ± 2, 25 ± 4, 27 ± 5, and 24 ± 7. While it is challenging to provide precise measurements of vascular structures from MTC staining images, the visual assessment in Figure 7 suggests that the diameter of newly formed blood vessels falls within the range of 20 to 100 μm. These findings underscore the pivotal role of scaffold composition and design in modulating cellular responses and highlight the potential of multiphasic scaffolds as a promising strategy for enhancing tissue regeneration in biomedical applications.
Figure 7. MT staining of sections of various explants.
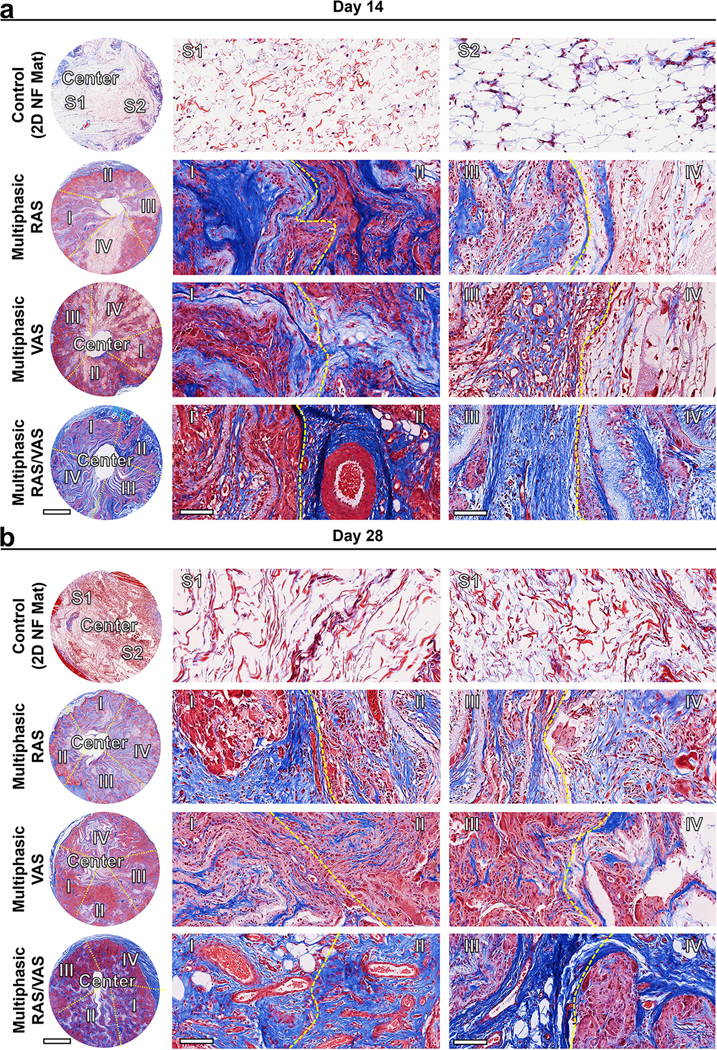
(a) and (b): Representative MT staining images of sections of various explants on days 14 and 28. The blue color observed in the images indicates the area of collagen deposition. The presence of red blood cells within the multiphasic scaffolds indicates the newly formed blood vessels. Control: 2D PLCL NF mats: S1: random section 1; S2: random section 2. Multiphasic RAS: (I) section of RAS without containing F127; (II) section of RAS containing 0.5% F127; (III) section of RAS containing 1% F127; (IV) section of RAS containing 1.5% F127. Multiphasic VAS: (I) section of VAS without containing F127; (II) section of VAS containing 0.5% F127; (III) section of VAS containing 1% F127; (IV) section of VAS containing 1.5% F127. Multiphasic RAS/VAS: (I) section of RAS; RAS/VAS (II) section of VAS; RAS/VAS (III) section of RAS; RAS/VAS (IV) section of VAS. Scale bars = 2 mm (left panels) and 100 μm (middle and right panels).
Figure 8. Collagen coverage area and neovascularization in different regions of each explant after 14 and 28 days of implantation in rats.
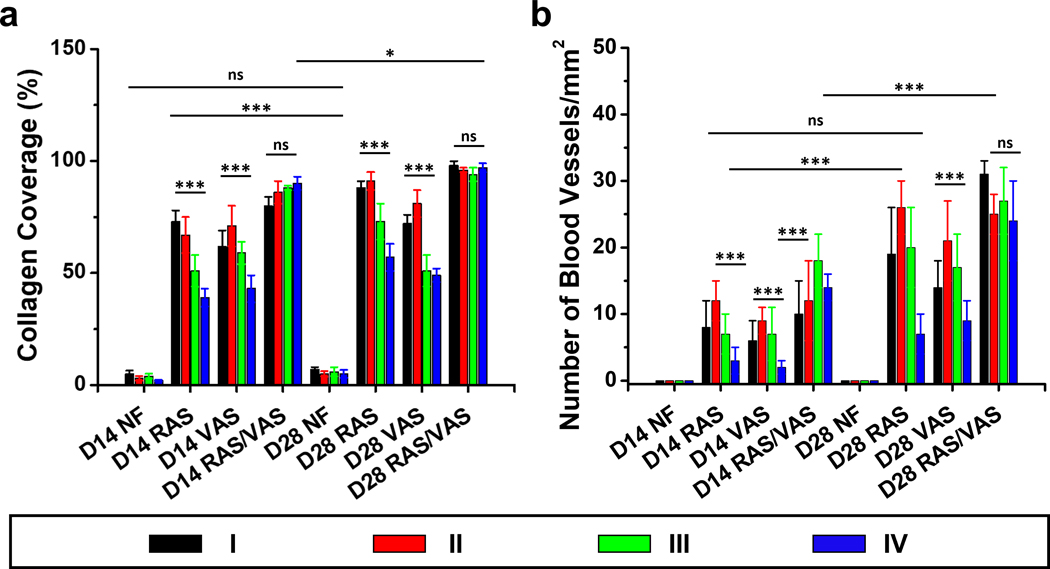
(a) Percentage of collagen coverage area in four distinct regions of 2D nanofiber mat (control), multiphasic RAS, multiphasic VAS, and multiphasic RAS/VAS. (b) Assessment of new blood vessel formation in each region of the explants after 14 and 28 days. D14: 14 days after implantation. D28: 28 days after implantation. NF: 2D nanofiber mat. RAS: multiphasic RAS with four regions and each region contained different concentrations of F127. VAS: multiphasic VAS with four regions and each region contained different concentrations of F127. RAS/VAS: multiphasic RAS/VAS composed of alternating RAS and VAS without containing F127. Regions (I), (II), (III), and (IV) correspond to the regions depicted in Figure 6A. The data were presented as mean ± standard deviation, with a sample size of N = 12. Statistical significance was indicated as *p < 0.05, **p < 0.01, and ***p < 0.001. A p-value greater than 0.05 was considered statistically nonsignificant (ns).
3 |. CONCLUSIONS
In summary, we have successfully demonstrated the fabrication of multiphasic 3D nanofiber scaffolds with controlled variations in fiber alignment and pore size, achieved through a gas-foaming expansion technique inspired by solids-of-revolution. By manipulating factors such as the number of layers, compositions within each layer, and fiber arrangements, we have generated scaffolds consisting of RAS and/or VAS or alternating RAS and VAS, both with and without gradient features like F127 content, gap size, and fiber alignment. Our in vitro studies have revealed that the gradation in pore size within nanofiber scaffolds significantly influences cell migration from the surrounding areas into the scaffolds. Specifically, pore size larger than 1 mm appear to compromise cell migration. In addition, our in vivo studies have shown that cell infiltration, neovascularization, and the formation of new tissue within the multiphasic scaffolds, following subcutaneous implantation in rats, appear to be dependent on pore size but independent of the fiber alignment direction. These investigations underscore the potential of nanofiber scaffolds in tissue regeneration, while emphasizing the crucial need to optimize both fiber alignment and pore size in such scaffolds to effectively facilitate and enhance tissue healing and regeneration. Overall, the findings from this study will contribute to the development of tailored 3D nanofiber scaffolds for specific tissue and interface regeneration and modeling.
4 |. MATERILAS AND METHODS
4.1 |. Materials
PLCL was purchased from BMG Incorporated Higashikujo, Kyoto, Japan. Pluronic® F-127, sodium borohydride, gelatin, and dimethylsulfoxide (DMSO) were obtained from Sigma-Aldrich (St. Louis, MO, USA). N, N-dimethylformamide (DMF) was acquired from Thermo Fisher Scientific (Hampton, NH, USA). Dulbecco’s modified eagle medium (DMEM), penicillin-streptomycin, and fetal bovine serum (FBS) were obtained from Invitrogen (Carlsbad, CA, USA). Cell culture dishes and plates were purchased from Corning (New York, NY, USA).
4.2 |. Fabrication of RAS and VAS
PLCL was dissolved in a mixture of DCM and DMF at a ratio of 4:1 to form an 8% PLCL solution. This solution was electrospun as follows. A 22-gauge needle was used as the syringe needle. The flow rate was controlled at 0.7 ml/h with the assistance of a syringe pump (Fisher Scientific, Pittsburgh, PA, USA), and an 18 kV electrical potential (HV Power Supply, ES304–5W/DAM, Gamma High Voltage Research Inc, Ormond Beach, FL, USA) was applied between the needle and the rotating mandrel (aka drum: 10 cm long and 12 cm in diameter; Servo Motor: AMETEK Pittman 8224S006, 24 VDC, M12–17-20, ROHS). Nanofiber mats with a thickness of 1 mm were produced by collecting the electrospun fibers deposited on the high-speed (DC Power Supply: 12 V; 1550BKPRECISION, UPC 817050155006, BK Precision, Serial No. 15502617, China) rotating drum. Subsequently, the mats were cut into rectangular shapes (5 mm × 15 mm), either parallel or perpendicular to the alignment of nanofibers. One longer side of rectangles was thermally fixed. The orientation of nanofibers determined whether the fibers would exhibit vertical or radial alignment after gas-foaming expansion. The expansion was carried out by immersing the thermally fixed mats in a bath containing 1M NaBH4 for 30 min. The 3D scaffolds were washed three times with distilled water for 10 s each, using a vacuum for assistance of expansion. The scaffolds were then subjected to freeze-drying (Labconco, Catalog No. 7740020, Serial No. 140795128S) and subsequently coated with 0.5% gelatin. The gelatin-coated scaffolds were freeze-dried, followed by crosslinking the dried samples in a closed chamber using 2.5% glutaraldehyde vapor (EMD Millipore Corp., Burlington MA, USA). Finally, the 3D scaffolds were cut into 1-mm thick.
4.3 |. Fabrication of biphasic and multiphasic scaffolds
To fabricate biphasic scaffolds, nanofiber mats consisting of two layers of nanofibers with distinct fiber organizations were produced by varying the direction of the first layer during fiber deposition or simply stacking two layers of fibers with different alignments. The nanofiber mats were then cut into rectangular-shaped fiber mats which consisted of two nanofiber layers with two different alignments relative to the longer side including parallel and perpendicular and thicknesses (e.g., 0.5 mm, 0.5 mm; 0.7 mm, 0.3 mm; 0.3 mm, 0.7 mm). Based on the similar gas-foaming procedure as described above, the 3D biphasic scaffolds were obtained. Specifically, we fabricated biphasic scaffolds composed of RAS and VAS at ratios of 50:50, 70:30, and 30:70. The thickness of scaffolds was maintained at 1 mm. Additionally, to fabricate multiphasic scaffolds with alternating RAS and VAS regions, we thermally fixed one side of nanofiber mats consisting of four layers with alternating fiber alignments (either parallel or perpendicular to the fixed side), with each layer having a thickness of 0.25 mm (for a total of 1 mm). Following the previously established procedure, these multi-layered mats were expanded, freeze-dried, coated with gelatin, and crosslinked with glutaraldehyde.[8,14,15]
4.4 |. Fabrication of scaffolds with a gradation in fiber organizations
In this experimental setup, a 45 mL solution of 8% PLCL+0.5% F-127 was pumped at a flow rate of 0.7 mL/h using a syringe pump. The electrospinning process was conducted under a potential of 18 kV between the spinneret (22 Gauge needle) and the drum collector. By controlling the rotating speed of the drum collector (aka drum: 10 cm long and 12 cm in diameter; Servo Motor: AMETEK Pittman 8224S006, 24 VDC, M12–17-20, ROHS), we achieved a nanofiber mat with graded fiber organizations. During the electrospinning, we employed a three-step process. For the first 15 mL of solution, the direct-current electrical source used for controlling the rotating mandrel was adjusted to 12 V, representing a high speed (DC Power Supply: 1550BKPRECISION, UPC 817050155006, BK Precision, Serial No. 15502617, China). During the subsequent electrospinning of the second 15 mL of solution, the direct-current electrical source was adjusted to 7 V, corresponding to a medium speed. Finally, during electrospinning the last 15 mL of solution, the direct-current electrical source was adjusted to 3 V, indicating a low speed. The speed of the collector played a crucial role in determining the alignment of fibers within the electrospun nanofiber mat. High, medium, and low speeds resulted in aligned, partially aligned, and random orientations of fibers within the mat, respectively. Following the electrospinning process, we collected a gradient orientation PLCL nanofiber mat with a thickness of approximately 1 mm. The mat was carefully removed from the drum collector and cut into square shapes measuring 10 mm × 10 mm × 1 mm. They were fixed on one side via thermal-induced fusion to secure the mats. Subsequently, the nanofiber mats were converted into a multiphasic scaffold with a gradation in fiber organizations based on the similar gas-foaming expansion and coating procedure as described above.
4.5 |. Fabrication of multiphasic scaffolds with a gradation in pore sizes
Various solutions were prepared by dissolving PLCL and F-127 in a mixture of DCM and DMF at a ratio of 4:1 (v/v). The resultant solutions contained 8% of PLCL (w/v) and 0%, 0.5%, 1%, or 1.5% of F127 (w/w). The amount of F-127 was based on the initial dry weight of PLCL. The electrospinning was employed to fabricate nanofiber mats from these solutions. A syringe pump was used to continuously feed the solutions at a flow rate of 0.7 mL/h through a 22-gauge needle. The electrospinning process was conducted under a potential of 15–18 kV, with the nanofibers collected on a grounded, high-speed rotating drum collector. The resulting nanofiber mats were approximately 1 mm thick (0.25 mm aligned PLCL nanofiber layer, 0.25 mm aligned PLCL nanofiber layer containing 0.5% F127, 0.25 mm aligned PLCL nanofiber layer containing 1.0% F127, 0.25 mm aligned PLCL nanofiber layer containing 1.5% F127). After collection, the nanofiber mats were cut into square shapes measuring 10 mm × 10 mm × 1 mm. One side of the mats was thermally fused to fix them in place. For making multiphasic RAS, a fiber mat consisting of four 0.25 mm thick aligned (fiber alignment perpendicular to the thermally fixed side) PLCL nanofiber layers and the F-127 content in each layer increased from 0%, to 0.5%, to 1.0%, to1.5%. Based on the similar gas-foaming procedure as described above, this fiber mat was converted into a multiphasic RAS. For making multiphasic VAS, a fiber mat consisting of four 0.25 mm thick aligned (fiber alignment parallel to the thermally fixed side) PLCL nanofiber layers and each layer contained 0%, 0.5%, 1.0%, and 1.5% of F-127. Based on the similar gas-foaming expansion and coating procedure as described above, this fiber mat was converted into a multiphasic VAS.
4.6 |. Fabrication of 3D nanofiber scaffold with gradations in pore sizes and fiber organizations
A fiber mat consisting of four 0.25 mm thick aligned PLCL nanofiber layers and the F-127 content in each layer increased from 0%, to 0.5%, to 1.0%, to1.5%. Each layer had alternating fiber alignment (first layer: fiber alignment perpendicular to the thermally fixed side, second layer: fiber alignment parallel to the thermally fixed side; third layer: fiber alignment perpendicular to the thermally fixed side; the fourth layer: fiber alignment parallel to the thermally fixed side). The nanofiber mats were cut into square shapes measuring 10 mm × 10 mm × 1 mm. One side of the mats was thermally fused to fix them in place. Based on the similar gas-foaming expansion and coating procedure as described above, this fiber mat was converted into a multiphasic scaffold with gradations in pore sizes and fiber organizations.
4.7 |. Characterization of Scaffolds
The multiphasic scaffolds were characterized using a scanning electron microscope (FEI, Quanta 200, Oregon, USA) to examine their cross-sectional morphology. Firstly, the samples were immersed in water and placed on a cryo-cutting metal stub. Snap freezing with liquid nitrogen was then performed, followed by cryo-cutting. Subsequently, the samples were freeze-dried and coated with a thin layer of electrically conductive platinum (Pt) using a sputter coater. The images were captured at various magnifications specified by the scale bar, and a consistent voltage of 25kV was maintained during imaging. The gap distance between adjacent layers in different areas of expanded biphasic or multiphasic PLCL nanofiber scaffolds (Figures 1G–I, 2F, and 3F) was determined using SEM images following our prior study.[3] Similarly, the channel length of these scaffolds (Figure 1K–N) was assessed based on SEM images, as per our established protocol.[8] The volume of the scaffolds (V) was determined using the following equation, as outlined in our previous study[16]:
Porosity in the nanofiber scaffolds was assessed by comparing the volume of the expanded nanofiber shapes to that of the estimated bulk materials. The porosity () was quantified (Figures 2H and 3H) using the following formula:
Here, represents the calculated volume of the bulk materials, with being the mass of bulk materials and representing the density of bulk materials. Subsequently, volume change (Figures 2G and 3G) (volume of scaffold after expansion divided by volume of nanofiber mat) and density change (Figure 3I) (density of scaffold after expansion divided by density of nanofiber mat) were calculated using established methods.[2,3]
4.8 |. Mechanical Properties
The mechanical properties of the different multiphasic scaffolds were assessed through a compression test. Cylindrical scaffolds with dimensions of 5 mm in diameter and 5 mm in length were subjected to testing using an Instron 5640 universal test machine. The dry samples were securely affixed to the lower compression plate of a CellScale Univert using double-sided tape, and compression was initiated by a 200 N load plate, reaching 90% displacement. The length of the scaffolds before and after recovery was measured with a digital caliper. The elastic modulus was determined using the equation:
Here, , , , and represent the compressive force, cross-sectional area, initial length, and change in length of the scaffolds, respectively.
4.9 |. Fibroblasts migration study in an in vitro wound healing model
To investigate fibroblast migration within multiphasic scaffolds, we prepared 3D scaffolds and sterilized them using ethylene oxide for 24 h. Green fluorescent protein (GFP)-labeled fibroblasts were generously supplied by Dr. Mark Carlson in Department of Surgery at UNMC, suspended in DMEM cell culture medium supplemented with 10% FBS and 1% penicillin, resulting in 1×10⁸ cells/mL. Next, approximately 1×10⁸ cells were seeded on the top to each Gel-MA hydrogel-covered 6-well plate well. The cells were cultured continuously at 37 °C and 5% CO2. Once the fibroblasts reached >95% confluency, a 10-mm hole was created in each hydrogel using a biopsy punch (Acu-Punch®, Acuderm Inc., Florida, USA). Subsequently, the multiphasic RAS (multiphasic scaffold composed of four regions of RAS and each region contained different concentrations of F127), VAS (multiphasic scaffold composed of four regions of VAS and each region contained different concentrations of F127), or RAS/VAS (multiphasic scaffolds composed of alternating RAS and VAS without containing F127) were inserted into the defects and cultured further at 37 °C and 5% CO2 for 24 h and 72 h, allowing the fibroblasts to migrate from the Gel-MA hydrogel toward the periphery of the scaffolds. At predetermined time points, the scaffolds were washed three times with PBS. They were then fixed with a non-coagulative additive fixative (Epredia™ 10% neutral buffered formalin, Fisher Scientific) for 10 min and rewashed three times with PBS. The migration of cells from the Gel-MA hydrogel to the scaffolds was visualized and analyzed using CLSM (800 CLSM, Zeiss, Oberkochen, Germany).
4.10 |. Soft tissue regeneration study in an in vivo subcutaneous implantation model
The multiphasic scaffolds were sterilized using ethylene oxide gas prior to implantation. Sprague Dawley (SD) rats, aged 8 weeks, were obtained from Charles River Laboratories, MA, USA, and used for this study. All animal procedures were performed under the approved UNMC IUACUC protocol no. 17–103-11-Fc. Subcutaneous implantation of multiphasic nanofiber scaffolds was carried out on the dorsal of SD rats. Additionally, a multiphasic scaffold consisting of alternating RAS and VAS was used for comparison. A 2D nanofiber mat was employed as a control. Upon arrival, the animals were housed in the UNMC comparative medicine facility and divided into four cohorts according to the study design (N = 12). During the surgical procedure, anesthesia was induced using 1–5 % isoflurane delivered through a nose cap at a flow rate of 1–2 L/min of oxygen. The animals were placed on a heating pad to maintain body temperature. An area of 8 × 4 cm2 on the dorsal region was shaved, and the exposed skin was treated with a povidone-iodine solution to create an aseptic surgical site. Each rat received four different types of implants (control: 2D nanofiber mat; multiphasic RAS: multiphasic scaffold composed of four regions of RAS and each region contained different concentrations of F127; multiphasic VAS: multiphasic scaffold composed of four regions of VAS and each region contained different concentrations of F127; multiphasic RAS/VAS: multiphasic scaffolds composed of alternating RAS and VAS without containing F127). Under aseptic conditions, incisions 1.5 cm in length were made at four paraspinal sites on the dorsal region, and subcutaneous pockets were created using blunt dissection. The implants (8 mm × 2mm) were gently inserted into the subcutaneous pockets through the incisions. After implantation, the skin incisions were closed with staples. The animals could recover on the heating pad before returning to their cages. After 2 and 4 weeks of implantation, the rats were euthanized, and the explants were harvested for subsequent analysis.
4.11 |. Explant imaging
For imaging of explants, the explants were isolated and cleaned with phosphate-buffered saline (PBS) to remove any debris. The imaging area was prepared by selecting a well-light and clean environment without any potential sources of reflection or glare. A scale was placed adjacent to the explants and kept visible in the frame during photography to ensure accurate measurements. The images were then captured using the iPhone 14 Pro Max (Apple, CA, USA) camera, with proper composition and alignment of the explants and scale. The captured images were transferred to a computer for storage and organization, following any necessary post-processing adjustments while preserving the integrity of the data.
4.12 |. H&E staining
Each explant was submerged in a 10% neutral buffered formalin solution to fix the tissue, and a graded ethanol series ranging from 50% to 100% dehydrated the tissue samples. Subsequently, the explants were embedded in paraffin. Paraffin-embedded tissue sections were used for H&E staining.[30] First, the tissue sections were placed on microscope slides. The slides were immersed in xylene for 5 min to remove the paraffin. Next, the slides were transferred to containers with 95% ethanol for 2 min, followed by 70% ethanol for an additional 2 min. Distilled water was used to rinse the slides. For hematoxylin staining, the tissue sections were flooded with hematoxylin solution and allowed to sit for 5–10 min. Excess hematoxylin was then removed by rinsing the slides with distilled water. The slides were differentiated in acid alcohol for a few seconds to achieve the desired staining level. Afterward, they were rinsed with distilled water. For eosin staining, the tissue sections were flooded with eosin solution and allowed to sit for 1–2 min. The slides were then rinsed with distilled water to remove excess eosin. The slides underwent a dehydration process to dehydrate the tissue. They were placed in ascending ethanol concentrations (50%, 70%, 95%, and absolute) for 2 min each. This dehydration step was repeated once. The slides were cleared by transferring them to xylene for 5 min to remove any residual ethanol. The tissue sections were then mounted using a mounting medium to the slides. Finally, a coverslip was gently placed over the mounted sections. The slides were allowed to air-dry completely before being examined under a microscope. This H&E staining protocol enabled visualization of cellular morphology and tissue structures.
4.13 |. Quantification of host cell infiltration
Quantification of host cell infiltration in the scaffolds was carried out using ImageJ software.[31] The image was loaded into the ImageJ toolbox, then converted to 16-bit grayscale by selecting “Image > Type > 16-bit Grayscale.” The threshold feature was utilized to distinguish cells from the background, which involved adjusting the threshold by selecting “Image > Adjust > Threshold.” The lower bound was modified to remove background pixels, while the upper bound was set at 192. These threshold values were determined through experimentation to effectively eliminate background without excluding cells. Next, particle analysis based on circularity was employed to identify the cells by selecting “Analyze > Analyze Particles.” Size parameters were set to exclude small clusters and circular substructures within cells. The default setting for circularity was retained. The ROI manager and a summary were automatically generated after the particle analysis. The ROI manager contained the selected cells or ROIs, and manual adjustments were made if required. The summary provided the total number of cells along with other pertinent measurements. Before analyzing cells from the H&E staining slide, the “Analyze > Set Measurements” measurement settings were adjusted every time. Quantification of cell infiltrated area was conducted on each section according to our previously established protocols.[20,31–33]
4.14 |. MT staining
A trichrome staining protocol was conducted to visualize collagen deposition in each explant.[20] First, tissue sections were deparaffinized and rehydrated using standard procedures. Next, the sections were fixed in Bouin’s solution at room temperature for 1 h to preserve the tissue structure. Afterward, excess fixative was removed by rinsing the sections with running tap water. The sections were immersed in Weigert’s iron hematoxylin solution for 10 min to stain the nuclei. The sections were differentiated by briefly exposing them to acid alcohol, which contained 1% hydrochloric acid in 70% ethanol. Subsequently, the sections were rinsed with distilled water to eliminate excess acid alcohol. The sections were immersed in a trichrome stain solution for 10–15 min, typically composed of acid fuchsin, phosphomolybdic acid, and aniline blue for trichrome staining. Acid fuchsin stained cytoplasm and muscle fibers red, while phosphomolybdic acid enhanced collagen staining, and aniline blue specifically stained collagen fibers blue. The sections were briefly differentiated in 1% acetic acid solution and then rinsed with distilled water to remove excess stain. Dehydration was achieved by sequentially passing the sections through ascending concentrations of ethanol (70%, 95%, and absolute ethanol) for 1–2 min each. Residual ethanol was cleared by immersing the sections in xylene for 5 min, rendering them transparent. The sections were mounted using a mounting medium, and coverslips were gently placed over them. Following complete air-drying, the slides were examined under a light microscope to visualize the blue-stained collagen fibers indicative of collagen deposition.
4.15 |. Quantification of collagen coverage area
The collagen coverage area from MT staining slides was determined using ImageJ software, following a standardized protocol.[34] All images were acquired under consistent conditions, with automatic exposure and white balance disabled to maintain a consistent grayscale range. The images were adjusted to ensure that blank areas appeared white, and any false-positive staining was carefully eliminated. Subsequently, the images were digitized and saved in an uncompressed TIFF format, with a resolution of 640 × 480 pixels and 24-bit RGB. To establish the scale bar, the “Straight” line tool in the “Analyze” menu of ImageJ was employed. By measuring the length of the scale bar and specifying the unit of measurement (μm) in the corresponding settings, an accurate scale was set for subsequent analysis. Color deconvolution was then applied to separate collagen fibers from overlapping regions in the images. The images were converted to RGB format, and the “Color Deconvolution” plugin was utilized. This plugin allowed MT-stained images to be deconvolved into their red, blue, and green components. The green component specifically represented the collagen fibers. Quantifying collagen deposited area involved using the “Threshold” tool. The threshold was manually adjusted until the entire green area, corresponding to the collagen fibers, was distinctly highlighted in red. Measurement settings, including “Area,” “Integrated Intensity,” and “Limit to Threshold,” were configured in the analysis menu. Clicking the “Measurement” button yielded the results presented in the “Results” window. Area-based analysis facilitated extracting and quantifying regions of interest (ROIs), particularly the atherosclerotic plaque. The “ROI manager” tool, accessible in the “Tools” box of the “Analyze” menu, was utilized to identify the plaque region along the internal elastic lamina and the plaque surface.
4.16 |. Quantification of the number of blood vessels
The number of blood vessels per square millimeter was determined from MT-stained tissue slides through a systematic experimental approach. Firstly, the slides containing tissue samples stained with MT were obtained and handled carefully to ensure sample integrity. Microscopic analysis was then conducted by selecting a region of interest (ROI) within the tissue samples that contained blood vessels. The microscope was adjusted to an appropriate magnification level, and proper illumination and focus settings were ensured for clear visualization. Next, blood vessels were counted within the selected areas, considering their characteristic staining and morphology. Standardized criteria were employed to identify blood vessels and maintain consistency in counting accurately. The area of the selected ROI was measured using ImageJ analysis software, ensuring measurements were in square millimeters.[20,31] To obtain a representative sample, microscopic analysis, and blood vessel counting were repeated for multiple fields of view. Adequate sampling was performed to minimize potential bias. The count and area were recorded for each field of view, encompassing the entire observation area. The density of blood vessels was then calculated by summing up the total number of blood vessels counted across all fields of view and the total observed area in square millimeters. The number of blood vessels per square millimeter was obtained by dividing the total count by the total observed area. Statistical analysis was conducted to determine significant differences or correlations in the data. Finally, the calculated number of blood vessels per square millimeter was presented as the density of blood vessels within the observed tissue area. Relevant statistical analysis and measures of variability were included in the reporting of results.
4.17 |. Statistical Analysis
The data were presented as mean ± standard deviation. Statistical analyses were conducted using analysis of variance (ANOVA) in GraphPad Prism (version 9.5.1). Pairwise comparisons were performed using ordinary one-way ANOVAs with Tukey’s multiple comparisons post hoc test. Statistical significance was denoted as *p < 0.05, **p < 0.01, **p < 0.001, ****p < 0.0001. Lack of pairwise comparison bars indicates a lack of significance (p > 0.05, ns).
Supplementary Material
ACKNOWLEDGMENTS
This work was partially supported by startup funds from the University of Nebraska Medical Center (UNMC), National Institute of General Medical Science (NIGMS) and National Heart, Lung, and Blood Institute (NHLBI) of the National Institutes of Health under Award Numbers R01GM138552 (JX) and R01HL162747 (JX), Congressionally Directed Medical Research Program (CDMRP)/Peer Reviewed Medical Research Program (PRMRP) FY19 W81XWH2010207 (JX), Nebraska Research Initiative grant, and NE LB606.
Footnotes
ETHICS STATEMENT
The work has not been published or submitted for publication elsewhere, either completely or in part, or in another form or language. All experiments were approved by the Institutional Animal Care and Use Committee (IACUC) of the University of Nebraska Medical Center under the approved protocol no. 17-103-11-Fc.
SUPPORTING INFORMATION
Supplementary data are included in the Supporting Information. Supporting Information is available from the Wiley Online Library or the authors.
CONFLICT OF INTEREST STATEMMENT
The authors declare no conflict of interest.
DATA AVAILABILITY STATEMENT
The data that support the findings of this study are available from the corresponding author upon reasonable request.
REFERENCES
- [1].Chen S, John JV, McCarthy A, Xie J, J. Mater. Chem. B 2020, 8, 3733. [DOI] [PMC free article] [PubMed] [Google Scholar]
- [2].Chen S, V John J, McCarthy A, Carlson MA, Li X, Xie J, Appl. Phys. Rev 2020, 7, 021406. [DOI] [PMC free article] [PubMed] [Google Scholar]
- [3].Chen S, McCarthy A, John JV, Su Y, Xie J, Adv. Mater 2020, 32, 2003754. [DOI] [PMC free article] [PubMed] [Google Scholar]
- [4].Chen S, Carlson MA, Li X, Siddique A, Zhu W, Xie J, ACS Biomater. Sci. Eng 2021, 7, 2204. [DOI] [PMC free article] [PubMed] [Google Scholar]
- [5].Zeiderman MR, Pu LLQ, Burns Trauma. 2021, 9, etkab024. [DOI] [PMC free article] [PubMed] [Google Scholar]
- [6].Pina S, Ribeiro VP, Marques CF, Maia FR, Silva TH, Reis RL, Oliveira JM, Materials 2019, 12, 1824. [DOI] [PMC free article] [PubMed] [Google Scholar]
- [7].Montoya C, Du Y, Gianforcaro AL, Orrego S, Yang M, Lelkes PI, Bone Res. 2021, 9, 12. [DOI] [PMC free article] [PubMed] [Google Scholar]
- [8].Chen S, Wang H, Mainardi VL, Talò G, McCarthy A, John JV, Teusink MJ, Hong L, Xie J, Sci. Adv 2021, 7, eabg3089. [DOI] [PMC free article] [PubMed] [Google Scholar]
- [9].Gaharwar AK, Singh I, Khademhosseini A, Nat. Rev. Mater 2020, 5, 686. [Google Scholar]
- [10].Li C, Lv H, Du Y, Zhu W, Yang W, Wang X, Wang J, Chen W, Regen. Ther 2022, 19, 9. [DOI] [PMC free article] [PubMed] [Google Scholar]
- [11].Blumer MJF, Ann. Anat. – Anat. Anz 2021, 235, 151704. [DOI] [PubMed] [Google Scholar]
- [12].Kameo Y, Sakano N, Adachi T, Bone Rep. 2020, 12, 100260. [DOI] [PMC free article] [PubMed] [Google Scholar]
- [13].An J, Teoh JEM, Suntornnond R, Chua CK, Engineering 2015, 1, 261. [Google Scholar]
- [14].Chen S, Wang H, McCarthy A, Yan Z, Kim HJ, Carlson MA, Xia Y, Xie J, Nano Lett. 2019, 19, 2059. [DOI] [PubMed] [Google Scholar]
- [15].Chen S, Ge L, Wang H, Cheng Y, Gorantla S, Poluektova LY, Gombart AF, Xie J, Acta Biomater. 2019, 97, 187. [DOI] [PMC free article] [PubMed] [Google Scholar]
- [16].Chen S, Wang H, McCarthy A, Yan Z, Kim HJ, Carlson MA, Xia Y, Xie J, Nano Lett. 2019, 19, 2059. [DOI] [PubMed] [Google Scholar]
- [17].Watson EC, Adams RH, Cold Spring Harb. Perspect. Med 2018, 8, a031559. [DOI] [PMC free article] [PubMed] [Google Scholar]
- [18].An JM, Shahriar SMS, Lee DY, Hwang SR, Lee Y, ACS Appl. Mater. Interfaces 2022, 14, 19139. [DOI] [PubMed] [Google Scholar]
- [19].Alvarez-Fernandez A, Fornerod MJ, Reid B, Guldin S, Langmuir 2022, 38, 3297. [DOI] [PMC free article] [PubMed] [Google Scholar]
- [20].John JV, Sharma NS, Tang G, Luo Z, Su Y, Weihs S, Shahriar SMS, Wang G, McCarthy A, Dyke J, Zhang YS, Khademhosseini A, Xie J, Adv. Funct. Mater 2023, 33, 2206936. [DOI] [PMC free article] [PubMed] [Google Scholar]
- [21].Iwamoto M, Tanaka Y, Sawamura N, Namba S, J. Am. Chem. Soc 2003, 125, 13032. [DOI] [PubMed] [Google Scholar]
- [22].Jiang S, Lyu C, Zhao P, Li W, Kong W, Huang C, Genin GM, Du Y, Nat. Commun 2019, 10, 3491. [DOI] [PMC free article] [PubMed] [Google Scholar]
- [23].Zhang B, Huang J, Narayan RJ, J. Mater. Chem. B 2020, 8, 8149. [DOI] [PubMed] [Google Scholar]
- [24].Cao Y, Yang S, Zhao D, Li Y, Cheong SS, Han D, Li Q, J. Orthop. Translat 2020, 23, 89. [DOI] [PMC free article] [PubMed] [Google Scholar]
- [25].yadav P, Beniwal G, Saxena KK, Mater. Today Proc. 2021, 44, 2623. [Google Scholar]
- [26].Fu W, Liu Z, Feng B, Hu R, He X, Wang H, Yin M, Huang H, Zhang H, Wang W, Int. J. Nanomedicine 2014, 2335. [DOI] [PMC free article] [PubMed] [Google Scholar]
- [27].He Y, Liu W, Guan L, Chen J, Duan L, Jia Z, Huang J, Li W, Liu J, Xiong J, Liu L, Wang D, Biomed. Res. Int 2018, 2018, 1. [DOI] [PMC free article] [PubMed] [Google Scholar]
- [28].He X, Fu W, Feng B, Wang H, Liu Z, Yin M, Wang W, Zheng J, Regen. Med 2013, 8, 425. [DOI] [PubMed] [Google Scholar]
- [29].Xue J, Wu T, Dai Y, Xia Y, Chem. Rev 2019, 119, 5298. [DOI] [PMC free article] [PubMed] [Google Scholar]
- [30].Shahriar SMS, An JM, Hasan MN, Surwase SS, Kim Y-C, Lee DY, Cho S, Lee Y, Nano Lett. 2021, 21, 4666. [DOI] [PubMed] [Google Scholar]
- [31].McCarthy A, John JV, Saldana L, Wang H, Lagerstrom M, Chen S, Su Y, Kuss M, Duan B, Carlson MA, Xie J, Adv. Healthc. Mater 2021, 10, 2100766. [DOI] [PMC free article] [PubMed] [Google Scholar]
- [32].John JV, McCarthy A, Wang H, Luo Z, Li H, Wang Z, Cheng F, Zhang YS, Xie J, Adv. Healthc. Mater 2021, 10, 2100238. [DOI] [PMC free article] [PubMed] [Google Scholar]
- [33].McCarthy A, Avegnon KLM, Holubeck PA, Brown D, Karan A, Sharma NS, John JV, Weihs S, Ley J, Xie J, Mater. Today Bio. 2021, 12, 100166. [DOI] [PMC free article] [PubMed] [Google Scholar]
- [34].Chen Y, Yu Q, Xu C-B, Int. J. Clin. Exp. Med 2017, 10, 14904. [Google Scholar]
Associated Data
This section collects any data citations, data availability statements, or supplementary materials included in this article.
Supplementary Materials
Data Availability Statement
The data that support the findings of this study are available from the corresponding author upon reasonable request.