

Abstract
Background
Frailty is an aging-related syndrome of reduced physiological reserve to maintain homeostasis. The Faurot frailty index has been validated as a Medicare claims-based proxy for predicting frailty using billing information from a user-specified ascertainment window.
Objectives
We assessed the validity of the Faurot frailty index as a predictor of the frailty phenotype and one-year mortality using varying frailty ascertainment windows.
Research Design
We identified older adults (66+ years) in Round 5 (2015) of the National Health and Aging Trends Study with Medicare claims linkage. Gold standard frailty was assessed using the frailty phenotype. We calculated the Faurot frailty index using 3, 6, 8, and 12 months of claims prior to the survey or all-available lookback. Model performance for each window in predicting the frailty phenotype was assessed by quantifying calibration and discrimination. Predictive performance for one-year mortality was assessed by estimating risk differences across claims-based frailty strata.
Results
Among 4,253 older adults, the 6 and 8-month windows had the best frailty phenotype calibration (calibration-slopes: 0.88 and 0.87). All-available lookback had the best discrimination (C-statistic=0.780), but poor calibration. Mortality associations were strongest using a 3-month window and monotonically decreased with longer windows. Subgroup analyses revealed worse performance in Black and Hispanic individuals than counterparts.
Conclusions
The optimal ascertainment window for the Faurot frailty index may depend on clinical context and researchers should consider tradeoffs between discrimination, calibration, and mortality. Sensitivity analyses using different durations can enhance robustness of inferences. Research is needed to improve prediction across racial and ethnic groups.
Keywords: frailty, aging, Medicare, validation
Introduction
Frailty is an aging-related syndrome characterized by increased vulnerability due to reduced physiological reserve to maintain homeostatisis.1–3 It is dynamic, with improvement and worsening in frailty over time occurring commonly in older adults.4, 5 Frailty is strongly associated with increased risks of mortality, morbidity, and disability.2, 3 Measuring frailty is of interest to clinicians when guiding care and to researchers when generating evidence on health in older adult populations. Measurement of frailty typically uses the Fried frailty phenotype, which defines three phenotypes (robust, prefrail, frail) based on the presence of five symptoms.1–3 However, evaluation of frailty for older adults is underutilized and poorly documented in clinical practice.6, 7 Even when clinical assessments of frailty are conducted, results are not available in administrative healthcare databases, such as insurance claims data, which are increasingly being used to study the health of older adults.
Medicare claims and enrollment data are a rich resource for conducting health services research in older adult populations due to large samples and detailed healthcare encounter information. However, their primarily purpose is to facilitate healthcare reimbursement. As a result, they lack detailed clinical information, including clinical measures of frailty that are desirable for research. The Faurot frailty index is a claims-based proxy measure that predicts frailty using demographic, diagnostic, and procedural billing information during a user-defined frailty ascertainment window.8 Prior studies have demonstrated that the Faurot frailty index is strongly associated with short-term geriatric outcomes, including mortality, skilled nursing facility (SNF) admission, and hospitalization.8, 9 It has been used extensively for population stratification and confounding control in studies using Medicare data.10–14 While the original model was developed using an 8-month frailty ascertainment window,8 subsequent research studies have employed different durations. For example, Zhang et al. used a 6-month frailty ascertainment window to control for confounding by frailty when assessing the effectiveness of influenza vaccines in older adults.10 Alternatively, Mayer et al. employed a 12-month window to predict frailty in older adults with colon cancer.15
Given frailty’s dynamic nature, the duration of the frailty ascertainment window may impact the validity of claims-based measures. A window that is too short may miss predictors of frailty that are not billed frequently (e.g., cancer screening). Alternatively, a window that is too long may include information that is no longer relevant for frailty (e.g., remote history of ambulance services). No study has assessed how the duration of the frailty ascertainment window affects the validity of the Faurot frailty index.
In this study, we assess the validity of the Faurot frailty index as a predictor of the concurrent frailty phenotype and as a predictor of one-year geriatric outcomes using varying ascertainment windows (3, 6, 8, and 12 months and using all-available lookback) in a cohort of older adults in the United States. We also assess its validity in subgroups defined by gender, race, ethnicity, age, and region.
Methods
The Office of Human Research Ethics of the University of North Carolina at Chapel Hill approved this study (#21–0520). Analyses were performed using SAS Version 9.4 (SAS Institute, Cary, NC) and R Version 4.1.1.
Data source and population
Our study cohort was drawn from the National Health and Aging Trends Study (NHATS), a prospective cohort of Medicare beneficiaries sponsored by the National Institute on Aging (U01AG032947) through a cooperative agreement with the Johns Hopkins Bloomberg School of Public Health.16 We used the Round 5 (2015) sensitive data file, with linkage to Medicare claims and enrollment data (2010–2018). We identified older adults (≥66 years) residing in the community or a non-nursing home residential care setting on the date of the Round 5 interview (index date). Participants were required to have continuous enrollment in Medicare Parts A and B with no health maintenance organization enrollment for 365 days prior to the index date.
The Faurot frailty index
The Faurot frailty index is a Medicare claims-based proxy measure that calculates a predicted probability of frailty using demographics and diagnosis, procedure, and durable medical equipment codes (Supplemental Table 1).8, 17 The original model was developed and validated using dependency in the activities of daily living (ADL) as a proxy for frailty and includes indicators positively and negatively associated with ADL dependency.8 It was externally validated as a predictor of the Fried frailty phenotype in the Atherosclerosis Risk in Communities cohort.9 Additional details on the development of the algorithm are provided in the Supplemental Methods. The diagnosis and procedure-based frailty indicators are assessed during a user-specified frailty ascertainment window. The algorithm calculates a predicted probability of frailty based on the indicators and parameter estimates from the original model. A macro to calculate the Faurot frailty index is available online: https://sph.unc.edu/epid/harry-guess-research-community/.
We calculated the predicted probability of frailty for individuals on the index date using 3, 6, 8, and 12-month frailty ascertainment windows (Figure 1).18 We also tested an “all-available lookback” approach, where the entire history of Medicare fee-for-service continuous enrollment available prior to the index date was used to identify the frailty indicators. The predicted probability of frailty for each ascertainment window was calculated by identifying the claims-based predictors during the respective lookback window and using the parameter estimates from the original model. Claims-based frailty was categorized as low (<0.05), low-medium (0.05-<0.10), medium (0.10-<0.20), medium-high (0.20-<0.40), and high (≥0.40). These categories have been shown to differentiate risks of incident outcomes in prior research.8, 17
Figure 1.

Study schematic depicting the five ascertainment windows assessed in our analysis. Abbreviations: NHATS=National Health and Aging Trends Study.
Frailty phenotype
Our gold standard frailty measure was the frailty phenotype, which classifies individuals as robust, prefrail, or frail based on five symptoms: exhaustion, low physical activity, weakness, slowness, and shrinking.3 NHATS collects information on the frailty phenotype using self-report and performance-based measures.19 We classified individuals as frail if they met definitions for three to five frailty phenotype components. Individuals with less than three components were considered non-frail. Thirteen percent of older adults were missing at least one frailty phenotype component. Missingness was more common for performance-based and physical assessment measures (slowness: 8%, weakness: 9%, shrinking: 3%) than measures based on self-report (exhaustion: <1%, low physical activity: <1%). Missing frailty components were imputed using hot-deck imputation.20, 21 For observations with missing frailty phenotype components, we assigned a phenotype by randomly drawing from observations with fully observed frailty information who shared the same pattern for non-missing components. Hot-deck imputation has been shown to perform similarly to multiple imputation when imputing the frailty phenotype in NHATS.21
Geriatric outcomes
We followed individuals for up to one year from the index date to assess incident outcomes relevant to a frail population: mortality, hospitalization, and SNF admission. Mortality was assessed using vital status and date of death from the enrollment file. Inpatient and SNF admissions were identified using admission dates in the MEDPAR file. For analyses of inpatient or SNF admissions, follow-up time was censored at disenrollment from Medicare fee-for-service. Death was considered a competing event (i.e., risk was set to 0 after death, rather than censoring). For the analysis of one-year mortality, follow-up was not censored at disenrollment since Medicare captures vital status information regardless of enrollment status.
Statistical analysis
Sankey diagrams
Changes in the classification of claims-based frailty when comparing the different ascertainment windows were visualized using Sankey diagrams.22, 23
Concurrent frailty phenotype validation
Calibration refers to agreement between observed and predicted events.24 We assessed calibration between the frailty phenotype and the Faurot frailty index across various ascertainment windows by fitting linear probability models. The dependent variable was observed frailty phenotype (frail vs. non-frail) and the independent variable was the claims-based predicted probability of frailty. We reported calibration intercepts and slopes.25 Perfect calibration would yield an intercept of 0 and a slope of 1. We also generated calibration plots using a LOESS smoothing function to assess departures from linearity.
Discrimination refers to the ability of a prediction model to distinguish between individuals with and without a health condition. We assessed the ability of each claims-based frailty measure to discriminate between frail and non-frail individuals by plotting receiver operating characteristic (ROC) curves and estimating C-statistics (i.e., area-under-the-curve). Differences in C-statistics were assessed using DeLong’s test.26 We identified the optimal cutpoint for classifying frailty using each ascertainment window based on the Youden index.27, 28 We also identified cutpoints that would yield 80% or 90% sensitivity and 80% or 90% specificity.
We computed integrated discrimination improvement (IDI), a reclassification statistic that measures the change in the difference in average predicted probability of frailty for frail vs. non-frail individuals between two models.29,30 The 8-month ascertainment window was considered the reference model since this was consistent with the original Faurot model. A positive IDI indicates better performance for a new model compared to the reference; a negative value indicates worse performance. Confidence intervals (CIs) for the IDI were estimated using bootstrapping with 2000 replicates.31, 32
Subgroup analyses
We conducted subgroup analyses to assess calibration and discrimination against the frailty phenotype for each frailty ascertainment window. Our subgroups were defined by age (66–75, 76–85, 86+ years), self-reported race (Black, non-Black), self-reported ethnicity (Hispanic, non-Hispanic), census region (Northeast, Midwest, South, West), and gender (female, male). Race and ethnicity were conceptualized as two distinct social constructs that may affect frailty, risk of outcomes, and classification of the claims-based measures.33 In our analyses, we operationalized race as Black vs. non-Black due to sample size constraints.
Prediction of one-year geriatric-relevant outcomes
We assessed the predictive validity of the claims-based frailty index using the varying ascertainment windows as a predictor of one-year cumulative incidence of mortality, SNF admission, and hospitalization. We estimated cumulative incidence of one-year mortality using Kaplan-Meier analyses stratified by the claims-based frailty category using each ascertainment window. Differences in one-year cumulative incidence across frailty strata were calculated using the low frailty stratum as the reference group. Using each frailty ascertainment window, the cumulative incidence of SNF and inpatient admissions was estimated using Aalen-Johansen estimators to account for competing risk by death, stratifying by claims-based frailty.34 We estimated 95% CIs using 2000 bootstrapped samples.
Results
Cohort characteristics
We identified 4,253 older adults meeting eligibility criteria. The median (IQR) age was 78 (72, 85) years; 58% were female. Seventy-eight percent self-identified as White, 18% as Black, and 4% as another race. Four percent self-identified as Hispanic. After hot-deck imputation, 81% were non-frail and 19% were frail according to the frailty phenotype. Additional characteristics are provided in Table 1.
Table 1.
Baseline characteristics for study participants in the 2015 NHATS-Medicare cohort
| Characteristic | NHATS-Medicare cohort N=4,253 |
|---|---|
| Demographics | |
| Age on index date, median (IQR) | 78 (72, 85) |
| Mean (SD) | 78.8 (7.9) |
| Gender, n (%) | |
| Female | 2,467 (58.0) |
| Male | 1,786 (42.0) |
| Race,a n (%) | |
| White | 3,236 (77.8) |
| Black | 761 (18.3) |
| American Indian/Alaska Native | 42 (1.0) |
| Asian or Pacific Islander | 65 (1.6) |
| Other | 54 (1.3) |
| Missing | 95 |
| Ethnicity,a n (%) | |
| Hispanic | 158 (3.8) |
| Non-Hispanic | 4,002 (96.2) |
| Census region, n (%) | |
| Northeast | 668 (15.7) |
| West | 740 (17.4) |
| Midwest | 986 (23.2) |
| South | 1,859 (43.7) |
| Frailty phenotype,b n (%) | |
| Non-frail | 3,465 (81.5) |
| Frail | 788 (18.5) |
Abbreviations: IQR=interquartile range; NHATS=National Health and Aging Trends Study; SD=standard deviation.
Race and ethnicity data are based on self-reported data from the 2015 NHATS survey. The distribution of race and ethnicity was nearly identical when using the Research Triangle Institute (RTI) recoded race/ethnicity variable from the Medicare enrollment file: non-Hispanic White (74%), non-Hispanic Black (19%), Hispanic (4%), Other race or ethnicity (3%).
Based on the gold standard Fried frailty phenotype.
Distribution of claims-based frailty
The distributions of the Faurot frailty index using each ascertainment window were right skewed (Supplemental Figure 1). Median predicted probability of frailty was stable across ascertainment windows (range 0.04–0.06) and the mean increased with longer durations (3 months: 0.08, all-available lookback: 0.18). The indicators with the largest differences between the 3-month and all-available lookback windows were cancer screening (range: 9–67%), arthritis/joint conditions (range: 26–79%), and lipid abnormalities (range: 39–87%) (Supplemental Figure 2).
A Sankey diagram depicting changes in claims-based frailty classification using the different ascertainment windows is provided in Figure 2. The percentage of older adults classified as having low claims-based frailty decreased with longer ascertainment windows. Although more people were reclassified into higher claims-based frailty strata when using longer windows, some individuals were reclassified into lower frailty strata.
Figure 2.
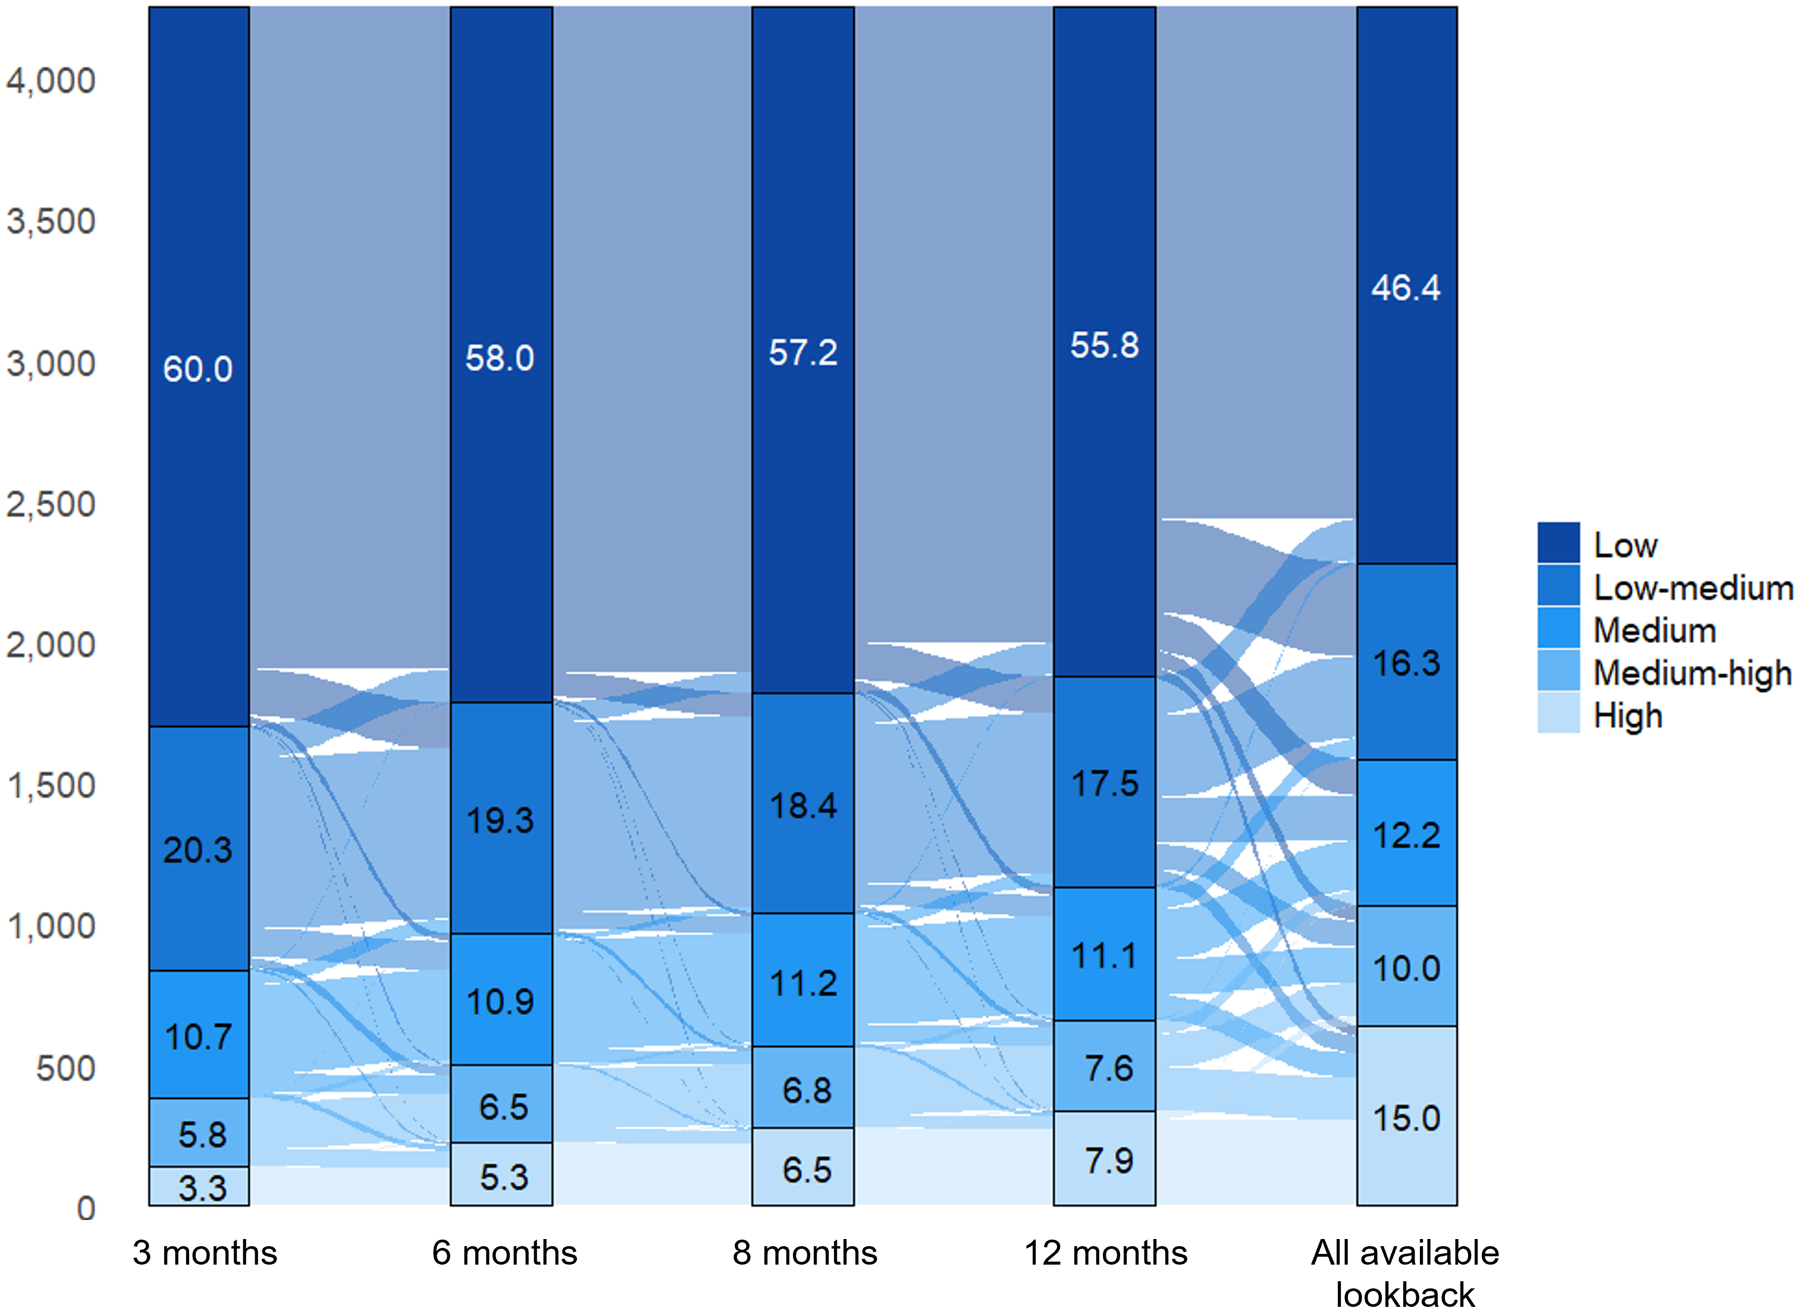
Sankey diagram depicting reclassification of claims-based frailty categories using varying frailty ascertainment windows.
Concurrent frailty phenotype validation
The claims-based predicted probability of frailty was positively associated with the concurrent frailty phenotype using each ascertainment window (Figure 3A). Based on the LOESS analysis, the claims-based predicted probability of frailty underestimated the true observed prevalence of frailty for low scores and overestimated the true prevalence of frailty for high scores. Calibration was worst using all-available lookback. In the calibration slope analyses, the 6 and 8-month ascertainment windows had the best calibration (6-month: intercept=0.09, slope=0.88; 8-month: intercept=0.08, slope=0.87).
Figure 3.

(A) Calibration plot of the Faurot frailty index for predicting the Fried frailty phenotype using varying frailty ascertainment windows. The solid lines are the estimated calibration slopes and intercepts based on linear-binomial models and the dashed lines are based on a LOESS smoother; (B) Receiver operating characteristic curves comparing the Faurot frailty index using varying ascertainment windows as predictors of frailty according to the Fried frailty phenotype. P-values for DeLong test of differences between C-statistics (i.e., AUC) using 8-month lookback as reference: 3-month=0.02; 6-month=0.08; 12-month=0.10; all-available lookback: <0.01. Abbreviations: AUC=area-under-the-curve.
All frailty ascertainment windows were able to discriminate between frail and non-frail individuals well (Figure 3B). The all-available lookback approach had the best discrimination (C-statistic=0.780). Discrimination for the other windows was similar (range: 0.743–0.760). The optimal cutpoints for identifying frailty based on the Youden index were lower when using shorter ascertainment windows and increased for longer ascertainment windows (3-month: 0.064; all-available lookback: 0.114; Table 2).
Table 2.
Sensitivity, specificity, positive predictive value, and negative predictive value for predicted probability of frailty cutpoints to identify frail vs. non-frail individuals in NHATS
| Cutpoint | Prevalence of frailty based on cutpoint (%) | Sensitivity | Specificity | PPV | NPV | |
|---|---|---|---|---|---|---|
| Optimal cutpoints based on Youden Index | ||||||
| 3-month | 0.064 | 30.7 | 0.61 | 0.76 | 0.37 | 0.90 |
| 6-month | 0.078 | 28.6 | 0.58 | 0.78 | 0.38 | 0.89 |
| 8-month | 0.078 | 29.8 | 0.61 | 0.77 | 0.38 | 0.90 |
| 12-month | 0.100 | 26.7 | 0.59 | 0.81 | 0.41 | 0.90 |
| AAL | 0.114 | 34.4 | 0.70 | 0.74 | 0.37 | 0.91 |
| 80% Sensitivity | ||||||
| 3-month | 0.038 | 52.4 | 0.80 | 0.53 | 0.28 | 0.92 |
| 6-month | 0.038 | 53.4 | 0.80 | 0.53 | 0.28 | 0.92 |
| 8-month | 0.040 | 52.1 | 0.80 | 0.54 | 0.28 | 0.92 |
| 12-month | 0.041 | 51.0 | 0.80 | 0.56 | 0.29 | 0.92 |
| AAL | 0.062 | 47.6 | 0.80 | 0.60 | 0.31 | 0.93 |
| 90% Sensitivity | ||||||
| 3-month | 0.027 | 72.4 | 0.90 | 0.32 | 0.23 | 0.93 |
| 6-month | 0.028 | 69.4 | 0.90 | 0.34 | 0.24 | 0.94 |
| 8-month | 0.027 | 71.2 | 0.90 | 0.33 | 0.23 | 0.94 |
| 12-month | 0.026 | 71.2 | 0.90 | 0.33 | 0.23 | 0.94 |
| AAL | 0.034 | 64.1 | 0.90 | 0.42 | 0.26 | 0.95 |
| 80% Specificity | ||||||
| 3-month | 0.075 | 26.6 | 0.56 | 0.80 | 0.39 | 0.89 |
| 6-month | 0.084 | 26.4 | 0.55 | 0.80 | 0.39 | 0.89 |
| 8-month | 0.088 | 27.1 | 0.58 | 0.80 | 0.40 | 0.89 |
| 12-month | 0.097 | 27.2 | 0.59 | 0.80 | 0.40 | 0.90 |
| AAL | 0.172 | 27.3 | 0.60 | 0.80 | 0.40 | 0.90 |
| 90% Specificity | ||||||
| 3-month | 0.123 | 15.2 | 0.38 | 0.90 | 0.47 | 0.87 |
| 6-month | 0.148 | 15.8 | 0.41 | 0.90 | 0.48 | 0.87 |
| 8-month | 0.163 | 15.7 | 0.41 | 0.90 | 0.48 | 0.87 |
| 12-month | 0.192 | 16.0 | 0.43 | 0.90 | 0.49 | 0.87 |
| AAL | 0.359 | 16.2 | 0.44 | 0.90 | 0.50 | 0.88 |
Abbreviations: AAL=all available lookback, NHATS=National Health and Aging Trends Study; NPV=negative predictive value; PPV=positive predictive value.
The IDIs (i.e., differences in average predicted probabilities of frailty for frail vs. non-frail individuals) increased monotonically with longer ascertainment windows (3-month: 0.11, 95% CI 0.10–0.13; all-available lookback: 0.27, 95% CI 0.25–0.30) (Supplemental Table 2).
Subgroup analyses
Subgroup analysis results are provided in Supplemental Table 3. In subgroups defined by race, ethnicity, gender, region, and age, the calibration slope was furthest from 1 when using the all-available lookback approach. The calibration intercept was furthest from 0 when using a 3-month ascertainment window for all subgroups. The 6, 8, and 12-month ascertainment windows produced similar calibration slopes, intercepts, and C-statistics in all subgroups, except for Hispanic individuals. None of the frailty ascertainment windows evaluated performed well in Hispanic individuals (e.g., 8-month calibration intercept=0.21, slope=0.94, C-statistic=0.64). Calibration was worse for Black individuals compared to non-Black individuals for all ascertainment windows (e.g., 8-month calibration: Black intercept=0.14, slope=0.79; non-Black intercept=0.07, slope=0.89). Calibration and discrimination were worse in individuals who resided in the West compared to other regions.
Prediction of one-year outcomes
Five percent of the study cohort died within one year. Using each ascertainment window, claims-based predicted probability of frailty was strongly and positively associated with one-year mortality (Supplemental Table 4). The difference in the one-year cumulative incidence of mortality for individuals with high vs. low claims-based frailty was largest using the 3-month frailty ascertainment window (29% vs. 2%, difference=27%, 95% CI 20–35%) and smallest using all-available lookback (17% vs. 1%, difference=16%, 95% CI 13–19%). C-statistics for discriminating one-year mortality ranged from 0.779 (all-available lookback) to 0.795 (6-month window). Associations between claims-based frailty and one-year SNF and inpatient admissions were similar using 3, 6, 8, and 12-month ascertainment windows. Cumulative incidence differences for these outcomes were slightly reduced when using all-available lookback, although the associations were still strong.
Discussion
We assessed how the duration of frailty ascertainment impacted the validity of the claims-based Faurot frailty index as a predictor of concurrent frailty phenotype and one-year geriatric outcomes. Calibration was best using 6, 8, and 12-month windows. Discrimination was best using all-available lookback. One-year mortality associations were strongest using shorter ascertainment windows.
We examined several aspects of validity, including calibration, discrimination, and outcome prediction, and there was not a single ascertainment window that performed best across all validation measures. The optimal window will depend on the clinical context and researchers should carefully consider the pros and cons of each approach when selecting the primary definition. In cases where sample sizes are small, using a shorter window may allow researchers to retain more individuals in their study by requiring a shorter duration of pre-index continuous enrollment. Furthermore, given the improved mortality prediction, shorter windows may be preferable if the claims-based frailty score will be used as a proxy for life-expectancy prediction. Alternatively, if the goal is to estimate the prevalence of frailty most accurately, better discrimination should be prioritized. We recommend that researchers test multiple frailty ascertainment windows in sensitivity analyses to provide better support for findings.
Although the all-available lookback approach discriminated frailty well, calibration was poor and associations between claims-based frailty and outcomes were weaker than when using shorter windows. This is not surprising given the dynamic nature of frailty. Claims in the distant past likely have less relevance for predicting short-term outcomes. Changes in billing history may also be indicative of resiliency or improvements in frailty. For example, an individual with a history of home oxygen in the distant past that no longer has claims for oxygen in more recent history may have experienced an improvement in frailty. Future work should consider including time-varying frailty indicators to improve prediction for claims-based algorithms. In addition, in the Medicare population, older adults will likely contribute more time when using an all-available lookback approach. This could lead to differential misclassification of frailty by age.
The Faurot frailty index can be used in research to identify study cohorts with low or high prevalence of frailty, to control for confounding by frailty, or to assess effect measure modification. In many cases, it may be necessary to use cutpoints to classify frailty. We identified optimal cutpoints that maximize sensitivity and specificity, as well as cutpoints to achieve certain sensitivity and specificity thresholds. When using cutpoints to classify frailty in claims data, researchers must consider the context-specific tradeoffs between sensitivity and specificity.35 In cases where researchers want to identify all frail individuals (e.g., for exclusion), even at the expense of including false positives, researchers should choose a cutpoint that maximizes sensitivity. Alternatively, high specificity is important if researchers want to identify near certain cases. Positive and negative predictive value are important when defining study inclusion and exclusion criteria and depend on sensitivity, specificity, and the prevalence of frailty in the population.
The performance of the Faurot frailty index was poor in Hispanic individuals for all ascertainment windows. In addition, frailty phenotype prediction was worse in Black individuals than non-Black individuals. The Faurot frailty index algorithm includes racial and ethnic classification as an indicator with the following categories: non-Hispanic White (reference group), non-Hispanic Black, Hispanic, and other. The parameter estimates for the non-Hispanic Black and other groups are positive, meaning that holding the other frailty indicators constant, older adults in these groups are assigned a higher claims-based frailty score. Alternatively, the Hispanic group has a negative parameter estimate, meaning they are assigned a lower claims-based frailty score, conditional on the other frailty indicators. A prior analysis using the standalone NHATS data found that the prevalence of frailty according to the frailty phenotype was higher in Hispanic individuals than non-Hispanic individuals.19 Notably, the population that the original Faurot frailty index was developed in was predominantly non-Hispanic White (88%), with only 8% and 2% of individuals classified as non-Hispanic Black and Hispanic, respectively.8 The low prevalence of Hispanic and non-Hispanic Black individuals included in the original development sample could explain part of the suboptimal performance in these groups.
In addition, while the Faurot model combines race and ethnicity as a single categorical variable, race and ethnicity represent distinct social constructs and the original classification may not accurately capture the unique ways each construct, and their intersections, contribute to frailty and mortality risk.33 Differences in healthcare access and utilization among historically marginalized groups, largely due to systemic and interpersonal racism and discrimination, could explain underperformance in these populations. Our findings point to the need for improved frailty prediction tools that perform better across racial and ethnic subgroups.
We found that 6, 8, and 12-month frailty ascertainment windows performed similarly within subgroups defined by gender. Calibration and discrimination were best in the youngest age group (66–74 years) and were poorer in older adults for all ascertainment windows. These results were similar to those reported in an external validation of the original Faurot model and may reflect the fact that individuals between 66–74 years of age represented the largest group in the development sample.9 Discrimination was worse in the West compared to other regions, which was also found in the original Faurot paper.8 The mechanism for this difference is unknown.
Limitations
Our cohort was restricted to older adults residing in community or non-nursing home residential care settings. Our results likely do not generalize to nursing home populations who tend to have a higher prevalence of frailty and different patterns of care than community-dwelling older adults. Similarly, we restricted our study to Medicare beneficiaries covered by Parts A and B and our findings may not generalize to individuals covered by Medicare Advantage who, as of 2023, represent half of Medicare beneficiaries.36 There was a large amount of missingness in the gold standard frailty phenotype measure. We addressed potential missing data bias using hot-deck imputation, but this could lead to misclassification of true frailty status. Due to sample size and data availability, we were not able to assess the performance of the frailty index in other racial and ethnic categories than those evaluated and the results for Hispanic individuals are based on small numbers. Finally, we opted to study the general population of older adults to reflect the population in the original Faurot paper. However, the performance of the Faurot frailty index may differ in specific populations. For example, older adults experiencing an acute medical event may have different patterns of care and billing than a general population or a chronic disease population. Future work should evaluate the Faurot frailty index in different populations.
Conclusions
We assessed how frailty ascertainment windows affected the performance of the Faurot frailty index as a predictor of the frailty phenotype and one-year outcomes in older Medicare beneficiaries. We found that 6, 8, and 12-month windows discriminated frailty well and had good calibration. The 3-month window performed well as a predictor of one-year mortality but had the worst frailty discrimination. While all-available lookback had the best discrimination, it had the worst calibration and weaker associations with one-year mortality than shorter windows. The optimal duration for the frailty ascertainment window will depend on the clinical context of individual studies. We recommend that researchers test multiple windows using sensitivity analyses to improve the robustness of inferences. Additional tools are needed to improve the validity of claims-based frailty measures in Black and Hispanic individuals.
Supplementary Material
Funding:
Emilie Duchesneau is supported by the Cancer Care Quality Training Program at the Lineberger Comprehensive Cancer Center, University of North Carolina at Chapel Hill (grant T32CA116339). Dr. Kim is supported by NIA grant K24AG073527. This work was supported by NIA grant R01AG056479 and a pilot grant through NIA grant P30AG066615.
Conflict of interest:
Dr. Stürmer receives salary support from the Center for Pharmacoepidemiology (current members: GlaxoSmithKline, UCB BioSciences, Takeda, AbbVie, Boehringer Ingelheim) and from a generous contribution from Dr. Nancy A. Dreyer to the Department of Epidemiology, University of North Carolina at Chapel Hill. Dr. Stürmer does not accept personal compensation of any kind from any pharmaceutical company. He owns stock in Novartis, Roche, and Novo Nordisk. Dr. Lund receives research support from Roche to the University of North Carolina; her spouse was formerly employed by GlaxoSmithKline and previously owned stock in the company. Dr. Reeder-Hayes receives research support unrelated to this work from Pfizer Global Medical Foundation to the University of North Carolina. Dr. Kim is supported by NIA grant K24AG073527. He received personal fees from Alosa Health and VillageMD for unrelated work. Dr. Edwards, Dr. Faurot, and Ms. Duchesneau report no conflicts of interest.
References
- 1.Chen X, Mao G and Leng SX. Frailty syndrome: an overview. Clin Interv Aging 2014; 9: 433–441. 2014/03/29. DOI: 10.2147/CIA.S45300. [DOI] [PMC free article] [PubMed] [Google Scholar]
- 2.Clegg A, Young J, Iliffe S, et al. Frailty in elderly people. Lancet 2013; 381: 752–762. 2013/02/12. DOI: 10.1016/S0140-6736(12)62167-9. [DOI] [PMC free article] [PubMed] [Google Scholar]
- 3.Fried LP, Tangen CM, Walston J, et al. Frailty in older adults: evidence for a phenotype. J Gerontol A Biol Sci Med Sci 2001; 56: M146–156. DOI: 10.1093/gerona/56.3.m146. [DOI] [PubMed] [Google Scholar]
- 4.Gill TM, Gahbauer EA, Allore HG, et al. Transitions between frailty states among community-living older persons. Arch Intern Med 2006; 166: 418–423. DOI: 10.1001/archinte.166.4.418. [DOI] [PubMed] [Google Scholar]
- 5.Kojima G, Taniguchi Y, Iliffe S, et al. Transitions between frailty states among community-dwelling older people: A systematic review and meta-analysis. Ageing Res Rev 2019; 50: 81–88. 2019/01/20. DOI: 10.1016/j.arr.2019.01.010. [DOI] [PubMed] [Google Scholar]
- 6.Walston J, Bandeen-Roche K, Buta B, et al. Moving Frailty Toward Clinical Practice: NIA Intramural Frailty Science Symposium Summary. J Am Geriatr Soc 2019; 67: 1559–1564. 2019/05/03. DOI: 10.1111/jgs.15928. [DOI] [PMC free article] [PubMed] [Google Scholar]
- 7.Dale W, Williams GR, A RM, et al. How Is Geriatric Assessment Used in Clinical Practice for Older Adults With Cancer? A Survey of Cancer Providers by the American Society of Clinical Oncology. JCO Oncol Pract 2021; 17: 336–344. 2020/10/17. DOI: 10.1200/OP.20.00442. [DOI] [PMC free article] [PubMed] [Google Scholar]
- 8.Faurot KR, Jonsson Funk M, Pate V, et al. Using claims data to predict dependency in activities of daily living as a proxy for frailty. Pharmacoepidemiol Drug Saf 2015; 24: 59–66. 20141021. DOI: 10.1002/pds.3719. [DOI] [PMC free article] [PubMed] [Google Scholar]
- 9.Cuthbertson CC, Kucharska-Newton A, Faurot KR, et al. Controlling for Frailty in Pharmacoepidemiologic Studies of Older Adults: Validation of an Existing Medicare Claims-based Algorithm. Epidemiology 2018; 29: 556–561. DOI: 10.1097/EDE.0000000000000833. [DOI] [PMC free article] [PubMed] [Google Scholar]
- 10.Zhang HT, McGrath LJ, Wyss R, et al. Controlling confounding by frailty when estimating influenza vaccine effectiveness using predictors of dependency in activities of daily living. Pharmacoepidemiol Drug Saf 2017; 26: 1500–1506. 2017/08/26. DOI: 10.1002/pds.4298. [DOI] [PMC free article] [PubMed] [Google Scholar]
- 11.Webster-Clark M, Lund JL, Sturmer T, et al. Reweighting Oranges to Apples: Transported RE-LY Trial Versus Nonexperimental Effect Estimates of Anticoagulation in Atrial Fibrillation. Epidemiology 2020; 31: 605–613. 2020/08/03. DOI: 10.1097/EDE.0000000000001230. [DOI] [PubMed] [Google Scholar]
- 12.Webster-Clark M, Sturmer T, Edwards JK, et al. Real-world on-treatment and initial treatment absolute risk differences for dabigatran vs warfarin in older US adults. Pharmacoepidemiol Drug Saf 2020; 29: 832–841. 2020/07/16. DOI: 10.1002/pds.5069. [DOI] [PMC free article] [PubMed] [Google Scholar]
- 13.Layton JB, Forns J, Turner ME, et al. Falls and Fractures in Patients with Parkinson’s Disease-Related Psychosis Treated with Pimavanserin vs Atypical Antipsychotics: A Cohort Study. Drugs Real World Outcomes 2022; 9: 9–22. 2021/11/01. DOI: 10.1007/s40801-021-00284-1. [DOI] [PMC free article] [PubMed] [Google Scholar]
- 14.Shmuel S, Pate V, Pepin MJ, et al. Effects of anticholinergic and sedative medication use on fractures: A self-controlled design study. J Am Geriatr Soc 2021; 69: 3212–3224. 2021/07/23. DOI: 10.1111/jgs.17377. [DOI] [PMC free article] [PubMed] [Google Scholar]
- 15.Mayer SE, Tan HJ, Peacock Hinton S, et al. Comparison of Medicare Claims-based Proxy Measures of Poor Function and Associations With Treatment Receipt and Mortality in Older Colon Cancer Patients. Med Care 2019; 57: 286–294. DOI: 10.1097/MLR.0000000000001073. [DOI] [PMC free article] [PubMed] [Google Scholar]
- 16.NHATS Public Use Data. (Rounds 1–10), sponsored by the National Institute on Aging (grant number NIA U01AG032947) through a cooperative agreement with the Johns Hopkins Bloomberg School of Public Health.
- 17.Duchesneau ED, Shmuel S, Faurot KR, et al. Translation of a claims-based frailty index from International Classification of Diseases 9th Revision to 10th Revision. Am J Epidemiol 2023. 20230711. DOI: 10.1093/aje/kwad151. [DOI] [PMC free article] [PubMed] [Google Scholar]
- 18.Schneeweiss S, Rassen JA, Brown JS, et al. Graphical Depiction of Longitudinal Study Designs in Health Care Databases. Ann Intern Med 2019; 170: 398–406. 20190312. DOI: 10.7326/M18-3079. [DOI] [PubMed] [Google Scholar]
- 19.Bandeen-Roche K, Seplaki CL, Huang J, et al. Frailty in Older Adults: A Nationally Representative Profile in the United States. J Gerontol A Biol Sci Med Sci 2015; 70: 1427–1434. 2015/08/25. DOI: 10.1093/gerona/glv133. [DOI] [PMC free article] [PubMed] [Google Scholar]
- 20.Andridge RR and Little RJ. A Review of Hot Deck Imputation for Survey Non-response. Int Stat Rev 2010; 78: 40–64. 2010/04/01. DOI: 10.1111/j.1751-5823.2010.00103.x. [DOI] [PMC free article] [PubMed] [Google Scholar]
- 21.Duchesneau ED, Shmuel S, Faurot KR, et al. Missing data approaches in longitudinal studies of aging: A case example using the National Health and Aging Trends Study. PLoS One 2023; 18: e0286984. 20230608. DOI: 10.1371/journal.pone.0286984. [DOI] [PMC free article] [PubMed] [Google Scholar]
- 22.Otto E, Culakova E, Meng S, et al. Overview of Sankey flow diagrams: Focusing on symptom trajectories in older adults with advanced cancer. J Geriatr Oncol 2022. 2022/01/11. DOI: 10.1016/j.jgo.2021.12.017. [DOI] [PMC free article] [PubMed] [Google Scholar]
- 23.Brunson J and Read Q. ggalluvial: Alluvial Plots in ‘ggplot2’. R package version 0.12.3. 2020. [Google Scholar]
- 24.Steyerberg EW, Vickers AJ, Cook NR, et al. Assessing the performance of prediction models: a framework for traditional and novel measures. Epidemiology 2010; 21: 128–138. 2009/12/17. DOI: 10.1097/EDE.0b013e3181c30fb2. [DOI] [PMC free article] [PubMed] [Google Scholar]
- 25.Stevens RJ and Poppe KK. Validation of clinical prediction models: what does the “calibration slope” really measure? J Clin Epidemiol 2020; 118: 93–99. 2019/10/13. DOI: 10.1016/j.jclinepi.2019.09.016. [DOI] [PubMed] [Google Scholar]
- 26.DeLong ER, DeLong DM and Clarke-Pearson DL. Comparing the areas under two or more correlated receiver operating characteristic curves: a nonparametric approach. Biometrics 1988; 44: 837–845. 1988/09/01. [PubMed] [Google Scholar]
- 27.Youden WJ. Index for rating diagnostic tests. Cancer 1950; 3: 32–35. 1950/01/01. DOI: . [DOI] [PubMed] [Google Scholar]
- 28.Fluss R, Faraggi D and Reiser B. Estimation of the Youden Index and its associated cutoff point. Biom J 2005; 47: 458–472. 2005/09/16. DOI: 10.1002/bimj.200410135. [DOI] [PubMed] [Google Scholar]
- 29.Pencina MJ, D’Agostino RB, Sr., D’Agostino RB Jr., et al. Evaluating the added predictive ability of a new marker: from area under the ROC curve to reclassification and beyond. Stat Med 2008; 27: 157–172; discussion 207–112. 2007/06/15. DOI: 10.1002/sim.2929. [DOI] [PubMed] [Google Scholar]
- 30.Lund JL, Kuo TM, Brookhart MA, et al. Development and validation of a 5-year mortality prediction model using regularized regression and Medicare data. Pharmacoepidemiol Drug Saf 2019; 28: 584–592. 2019/03/21. DOI: 10.1002/pds.4769. [DOI] [PMC free article] [PubMed] [Google Scholar]
- 31.Kerr KF, McClelland RL, Brown ER, et al. Evaluating the incremental value of new biomarkers with integrated discrimination improvement. Am J Epidemiol 2011; 174: 364–374. 2011/06/16. DOI: 10.1093/aje/kwr086. [DOI] [PMC free article] [PubMed] [Google Scholar]
- 32.Kerr KF, Wang Z, Janes H, et al. Net reclassification indices for evaluating risk prediction instruments: a critical review. Epidemiology 2014; 25: 114–121. 2013/11/19. DOI: 10.1097/EDE.0000000000000018. [DOI] [PMC free article] [PubMed] [Google Scholar]
- 33.Martinez RAM, Andrabi N, Goodwin AN, et al. Conceptualization, Operationalization, and Utilization of Race and Ethnicity in Major Epidemiology Journals 1995–2018: A Systematic Review. Am J Epidemiol 2022. 2022/08/09. DOI: 10.1093/aje/kwac146. [DOI] [PMC free article] [PubMed] [Google Scholar]
- 34.Aalen O and Johansen S. An empirical transition matrix for non-homogeneous Markov chains based on censored observations. Scandinavian Journal of Statistics 1978; 5: 141–150. [Google Scholar]
- 35.Chubak J, Pocobelli G and Weiss NS. Tradeoffs between accuracy measures for electronic health care data algorithms. J Clin Epidemiol 2012; 65: 343–349 e342. 2011/12/27. DOI: 10.1016/j.jclinepi.2011.09.002. [DOI] [PMC free article] [PubMed] [Google Scholar]
- 36.Ochieng N, Fuglesten Biniek J, Freed M, et al. Medicare Advantage in 2023: Enrollment Update and Key Trends. KFF, 2023. [Google Scholar]
Associated Data
This section collects any data citations, data availability statements, or supplementary materials included in this article.