

Abstract
Background
The likelihood of poor health outcomes for refugees is increased due to a variety of complicated causes. Lack of access to high-quality care during resettlement is frequently cited by migrants. Therefore, this study was carried out to assess the quality of primary care services from the perspective of refugees and migrants.
Methods
This cross-sectional study was conducted in three health networks affiliated with Iran University of Medical Sciences in 2021. Data were collected by using a self-administrative questionnaire, the validity and reliability of which were checked and confirmed. The questionnaires were randomly completed by 280 migrants and refugees. Data were analyzed by using Kruskal–Wallis, Mann–Whitney U, Spearman correlation, exploratory factor analysis, and Cronbach's α with SPSS 22.
Results
According to the results, the overall service quality was 3.86 out of 5. The highest and lowest mean scores were related to efficiency (4.12 ±0.64) and tangibility (3.28 ±0.39). Furthermore, there was a significant relationship between the perception of service quality and gender, education, residence area, and the rate of center visits (P < 0.05).
Conclusion
The quality of services was generally rated favorably by the refugees. Managers and decision-makers are recommended to allocate enough funds to equip and upgrade the amenities at health centers to increase the quality of services.
Keywords: Primary health care, Quality of health care, Migrants, Refugees
↑What is “already known” in this topic:
Service quality assessment allows organizations to identify areas for improvement, assess and compare the performance of team members, and improve customer satisfaction. Patients' perspectives have been used to assess the quality of primary healthcare services in Iran .
→What this article adds:
For the first time, the study has examined the perspectives of migrants and refugees regarding the quality of primary health care in Iran. The highest and lowest mean scores were related to efficiency and tangibility dimensions .
Introduction
Primary health care (PHC) was inspired by the World Health Organization (WHO) in 1948 and then emphasized at the Alma-Ata International Conference in 1978 (1, 2). It aims to achieve the maximum degree and distribution of health and well-being. PHC is considered a whole-society approach to health and offers a comprehensive array of accessible services, such as palliative care, disease prevention, treatment, and rehabilitation (3). The enhancement of PHC contributes to the responsiveness and resilience of health systems, especially during crises, and can improve population health outcomes by lowering all-cause mortality. Moreover, it is a cost-effective way to achieve universal health coverage and Sustainable Development Goals (SDGs) (4). Currently, one of the most important policies in the health systems of all countries is to move towards achieving the SDGs which are now used as a reference in global development guidelines and determine social and environmental factors in health (5). To protect human health, primary health institutions have been given a high priority, especially in low- and middle-income countries with limited health resources (6).
In parallel with WHO's emphasis in 1984, PHC was implemented in Iran, and since then, health indices have increased. In the 1970s and 1980s, Iran was successful in meeting the requirements of its population by offering primary healthcare services. Yet, in trying to meet the population's current demands, the PHC system has encountered challenges and barriers due to changes in the burden of diseases and demand patterns. The delivery of poor quality services in health facilities to address communicable diseases, maternal and infant mortality, as well as emerging new non-communicable disorders have caused significant issues for Iran's health system (7, 8).
Refugees and migrants are one of the most significant populations who use PHC services. The number of migrants, including refugees and internally displaced persons, has been rising globally, with an unprecedented 70.8 million individuals who are compelled to leave their country of origin due to violence and persecution (9). According to the United Nations High Commissioner for Refugees (UNHCR), most displaced Afghans live in the Islamic Republics of Iran and Pakistan because of common religion, language, and culture. Iran has been hosting refugees from Afghanistan and Iraq for about 40 years and is one of the top 10 countries hosting refugees in the world. According to the latest official statistics, about 979,000 documented Afghan and 32,000 Iraqi refugees live in Iran. In addition, the number of undocumented migrants is estimated to be more than 2 million; however, according to field statistics, after the dominance of the Taliban in Afghanistan, their population has increased to eight million (10-12).
The likelihood of poor health outcomes for refugees is increased by their unwillingness to seek medical care owing to a variety of complicated causes, such as language problems, discrimination, income, etc. Lack of access to high-quality care during resettlement is frequently cited by migrants (13, 14). Therefore, some interventions are needed to improve the quality of primary healthcare provided to refugees, such as developing their individual skills, strengthening the skills of PHC workers, using service integration models and structures, and enhancing communication services between patients and providers (15). Similarly, the findings of a study on refugees' perception of service quality in Italy revealed several obstacles, such as linguistic barriers, lack of cultural mediation, bureaucratic barriers, and lack of familiarity with the health care system. (16).
Furthermore, most diseases are more prevalent among Afghan immigrants and refugees compared with the Iranian population; consequently, from the perspective of public health and human rights, it is crucial to increase the migrants' access to health services (17). However, inadequate insurance coverage and failure to schedule timely screenings and vaccinations pose significant obstacles for the refugees to seek PHC services (18, 19).
Healthcare service providers have to establish and keep a competitive edge in quality. Therefore, the measurement of service quality can help find current flaws and gaps (20). Although numerous studies have evaluated the quality of PHC services in Iran (21), to the best of our knowledge, none have yet taken refugees' and migrants' perspectives into account. Consideration of service quality from many angles can lead to an accurate detection of issues and shortfalls across various groups. Thus, this study was the first to assess the quality of primary care services from the perspective of refugees and migrants. The study objectives were: 1- To determine the mean score of service quality dimensions in health care centers affiliated with Iran University of Medical Sciences in Tehran from migrants' and refugees’ viewpoints. 2- To determine the perception of migrants and refugees about service quality in health care centers affiliated with Iran University of Medical Sciences in Tehran in terms of demographic characteristics.
Methods
Sampling
This cross-sectional study was conducted in 2021. Three health networks affiliated with Iran University of Medical Sciences were selected as cluster sampling, and four health centers were selected from each network through simple random sampling. According to reports, each center received an average of 125 visits from refugees each month. A total of 1500 individuals visited 12 health centers throughout a given month. As a result, Cochran's formula was used to determine the sample size. Finally,a total of300 questionnaires were randomly distributed among refugees, 280 of whom completed them after visiting their physicians.
Instrument
Initially, the researchers reviewed the literature in various databases, such as PubMed, Scopus, and Web of Science to identify questionnaires used for evaluating the quality of health services. Three instruments were selected as the basis for designing the questionnaire: HEALTHQUAL, an adapted version of SERVQUAL questionnaire designed for evaluating the quality of health care services (22, 23);Primary Care Assessment Tool, a questionnaire that examines primary care and focuses on accessibility, availability, and referral system (24); and a researcher-made framework, which focuses on the provision of quality primary care based on patients' views in Iran (25). The instruments were reviewed to extract the most relevant items and attributes for assessing the quality of primary services. Finally, aquestionnaire was designed with30 items in 9 dimensions (Figure 1). The content validity of the questionnaire was confirmed by a panel of eight experts. Face validity was examined by a sample of 10 patients. The reliability of the questionnaire was assessed by using Cronbach’s alpha coefficient.The questionnaire included interactions, efficiency, waiting time, accuracy, consultation, tangibility, accessibility, safety, and environment dimensions rated on a 5-point Likert scale: 5= strongly agree, 4= agree, 3= not sure, 2= disagree, and 1= strongly disagree.
Figure 1.
Developing the questionnaire
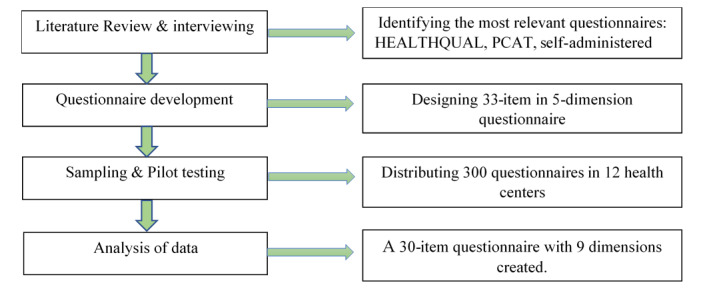
Table 1 shows the dimensions emerging from factor analysis. They include: “interactions”, “efficiency”, “timeliness”, “accuracy”, “consultation”, “tangibility”, “accessibility”, “safety”, and “environment”. As shown in the table, all eigenvalues are higher than 1. The “interactions” dimension has the highest eigenvalue (3.65) and explains a much greater percentage of variance (11.07%) than the other dimensions. The content validity of the questions was confirmed after checking and revising a number of questions (CVR= 0.81, CVI= 0.79). Also, Cronbach’s alpha coefficient ranged from 0.76 to 0.80 for service quality dimensions and 0.82 for the overall service quality, indicating a sufficient level of reliability (Table 1).
Table 1. Eigenvalue, percentage of explained variance, reliability, and items with factor-loadings of nine factors.
| Dimensions and items | Eigenvalue | Percentage of explained variance | Reliability | Factor loading |
|---|---|---|---|---|
| 1- Interactions | 3.65 | 11.07 | 0.768 | |
| -The behavior of the employees (e.g. receptionist, security guard, and cashier) was good. | 0.742 | |||
| - In providing services, the doctor and other employees were respectful and polite. | 0.738 | |||
| - The doctor and other employees answered my questions completely. | 0.736 | |||
| - The doctor's and other employees’ words were clear and understandable to me. | 0.726 | |||
| 2- Efficiency | 3.27 | 9.93 | 0.774 | |
| - The cost of a doctor's visit in this center is reasonable. | 0.728 | |||
| - The doctor and nurse warned and reminded about the arbitrary use of medicine and other medical services without prescription. | 0.720 | |||
| - The service I received at this center was worth paying the money for. | 0.702 | |||
| - I visited the doctor on the expected day and hour. | 0.553 | |||
| 3- Timeliness | 2.74 | 8.30 | 0.768 | |
| - The process of paying for the visit was easy and fast. | 0.749 | |||
| - Filing the case was easy and completed in the shortest possible time. | 0.739 | |||
| - I did not wait long from the time I entered the health center to the doctor's room. | 0.694 | |||
| - I think the doctor and other staff tried their best to avoid wasting time. | 0.554 | |||
| 4- Accuracy | 2.71 | 8.21 | 0.799 | |
| - Nurses and other employees do not make mistakes in providing services. | 0.866 | |||
| - Doctors of this center do not make mistakes in their diagnosis. | 0.825 | |||
| - Doctors and employees have enough expertise and skills to provide service. | 0.711 | |||
| 5- Consultation | 2.30 | 7.98 | 0.801 | |
| - In addition to the visit, the doctor talked about the ways to prevent other physical and mental diseases (e.g., diabetes, high blood pressure, depression, anxiety, etc.). | 0.825 | |||
| - I received good advice from the doctor or nurse about a healthy lifestyle (e.g., healthy eating, exercise, etc.). | 0.785 | |||
| - In this center, timely measures and sufficient guidance are provided to relieve the patient from pain. | 0.534 | |||
| 6- Tangibility | 2.29 | 7.96 | 0.802 | |
| - This center has advanced equipment and facilities. | 0.743 | |||
| - The health center was clean and tidy. | 0.741 | |||
| - The amenities of the waiting room (TV, water cooler, chairs, magazines, etc.) were at the optimum level. | 0.598 | |||
| - The appearance and dress of the employees were neat and orderly. | 0.568 | |||
| 7- Safety | 2.05 | 7.22 | 0.791 | |
| - Adequate measures are taken in this center to prevent the spread of infection. | 0.650 | |||
| - In this center, a safe and comfortable environment is provided to receive services. | 0.545 | |||
| 8- Accessibility | 1.93 | 6.86 | 0.804 | |
| - It is possible to receive medical advice from this center offline (e.g., via phone, website, etc.). | 0.790 | |||
| - The hours and days of operation of the health center are such that you can easily visit it at any time. | 0.664 | |||
| - If the doctor is not present in the health care center, there is someone else (such as a nurse) who will take care of your problem. | 0.635 | |||
| - Access to the health center was easy. | 0.533 | |||
| 9- Environment | 1.64 | 5.58 | 0.800 | |
| - The noise and crowding of the environment were not annoying. | 0.743 | |||
| - The temperature (hot and cold) of the environment was suitable. | 0.697 | |||
| Overall | 73.16 | 0.820 |
Inclusion and exclusion criteria
The inclusion criteria for selecting experts included those who had at least 5 years of work experience in healthcare management and had published at least three articles in the field of quality assessment and improvement in reputable journals. The criteria for the study samples included patients at least 18 years old and a history of receiving services from primary health care centers. That is, those patients who had been referred to health centers and had completed the questionnaires because, in that case, they could accurately assess services; the patients should have received services and had enough information about the whole process (from admission to visiting a doctor). Patients under the age of 18, those who went to health centers for minor services, like screenings and vaccinations,were excluded from the study.
Data analysis
Descriptive tests, Kolmogorov-Smirnov, exploratory factor analysis (EFA), Spearman correlation, and Cronbach's α were performed with SPSS version 22 software. P values less than 0.05 were considered statistically significant. The primary healthcare quality dimensions and the related items were determined through EFA. The criterion for the number of factors to be rotated was eigenvalues greater than 1, and items with factor loadings lower than 0.4 were excluded. In order to evaluate the reliability of the retained variables in each factor, Cronbach’s α coefficient was calculated, and the coefficients higher than 0.6 were considered acceptable (26).
Results
In this study, 145 of the participants were female (51.8%), 167 persons held college degrees (59.6%), 268 were residents of urban areas (95.7%), 161 were married (57.5%), and 137 people (48.9%) had visited health centers four times or more. The highest quality mean scores were obtained by illiterate patients (4.10 ±0.36), females (3.95 ±0.53), patients with four or more visits (3.93 ±0.54), married patients (3.88 ±0.48), and urban dwellers (3.85 ±0.49) (Table 2).
Table 2. The relationship between demographic characteristics and service quality score (N = 280).
| Variable | Frequency | Percentage | Mean ±SD | P-value | |
|---|---|---|---|---|---|
| Gender | Male | 135 | 48.2 | 3.74 ±0.42 | < 0.001 |
| Female | 145 | 51.8 | 3.95 ±0.53 | ||
| Education | No schooling | 10 | 3.5 | 4.10 ±0.36 | < 0.001 |
| Primary and Secondary school | 103 | 36.8 | 3.83 ±0.43 | ||
| University | 167 | 59.6 | 3.80 ±0.51 | ||
| Nationality | Afghan | 255 | 91 | 3.85 ±0.35 | 0.062 |
| Iraqi | 10 | 3.5 | 3.87 ±0.46 | ||
| Other | 15 | 5.3 | 3.86 ±0.31 | ||
| Residence Area | Urban | 268 | 95.7 | 3.85 ±0.49 | < 0.001 |
| Rural | 12 | 4.3 | 3.81 ±0.32 | ||
| Economic status | Good | 9 | 3.2 | 3.84 ±0.44 | 0.074 |
| Average | 98 | 35 | 3.86 ±0.49 | ||
| Low | 173 | 61.8 | 3.85 ±0.61 | ||
| Marital status | Married | 161 | 57.5 | 3.88 ±0.48 | 0.263 |
| Single | 119 | 42.5 | 3.82 ±0.37 | ||
| Rate of center visit | First | 95 | 33.9 | 3.81 ±0.24 | 0.006 |
| Second | 37 | 13.2 | 3.69 ±0.33 | ||
| Third | 11 | 3.9 | 3.80 ±0.25 | ||
| Fourth or more | 137 | 48.9 | 3.93 ±0.54 | ||
The comparison of mean scores of service quality in terms of demographic variables by Kruskal–Wallis and Mann–Whitney U tests showed a significant relationship between gender, education, residence area, and rate of center visit variables and the overall quality mean score ( P < 0.01) (Table 2).
The findings on service quality dimensions indicated that the highest and lowest mean scores were obtained by efficiency (4.12 ±0.63) and tangibility (3.28 ±0.39). The overall mean score of service quality was 3.86 ±0.61 (Table 3).
Table 3. The mean and standard deviations of service quality dimensions.
| Dimensions | Mean | SD | Minimum | Maximum |
|---|---|---|---|---|
| Interactions | 4.07 | 0.64 | 1 | 5 |
| Efficiency | 4.12 | 0.63 | 2 | 5 |
| Timeliness | 4.07 | 0.64 | 2 | 5 |
| Accuracy | 3.69 | 0.62 | 2 | 5 |
| Consultation | 3.94 | 0.75 | 2 | 5 |
| Tangibility | 3.28 | 0.39 | 2 | 4 |
| Accessibility | 3.79 | 0.66 | 2 | 5 |
| Safety | 3.53 | 0.61 | 2 | 5 |
| Environment | 4.05 | 0.67 | 1 | 5 |
| Service quality | 3.86 | 0.64 | 1 | 5 |
Moreover, a significant correlation was found between the overall service quality and its dimensions, specifically timeliness (r = 0.769) and interactions (r = 0.768)followed by other dimensions, such as efficiency, consultation, accessibility, safety, tangibility, and accuracy (Table 4).
Table 4. The Spearman correlation between service quality dimensions.
| Dimensions | Interactions | Efficiency | Timeliness | Accuracy | Consultation | Tangibility | Accessibility | Safety | Environment | Service quality |
|---|---|---|---|---|---|---|---|---|---|---|
| Interactions | 1 | |||||||||
| Efficiency | 0.673* | 1 | ||||||||
| Timeliness | 1* | 0.675* | 1 | |||||||
| Accuracy | 0.275* | 0.405* | 0.275* | 1 | ||||||
| Consultation | 0.320* | 0.332* | 0.320* | 0.346* | 1 | |||||
| Tangibility | 0.279* | 0.165* | 0.281* | 0.190* | 0.258* | 1 | ||||
| Accessibility | 0.328* | 0.402* | 0.328* | 0.244* | 0.235* | 0.283* | 1 | |||
| Safety | 0.357* | 0.300* | 0.358* | 0.105* | 0.237* | 0.341* | 0.271* | 1 | ||
| Environment | 0.356 | 0.393* | 0.356* | 0.202* | 0.163* | 0.263* | 0.402* | 0.083 | 1 | |
| Service quality | 0.768* | 0.737* | 0.769* | 0.499* | 0.619* | 0.503* | 0.600* | 0.544* | 0.501* | 1 |
*P < 0.05 level (2-tailed)
Discussion
This study aimed to evaluate PHC service quality in Iran from migrants' and refugees’ viewpoints. The results showed that the overall service quality was 3.86 out of 5. Based on the results of systematic review and meta-analysis studies in Iran, the mean scores of primary service quality were 3.81 (21) and 3.83 (27). In a study by Sharifi et al., the overall mean scores of PHC service quality were 3.26 and 3.25 based on SERVQUAL and HEALTHQUAL tools, respectively (28). Consequently, compared to Iranian patients, the refugees gave the highest mean score to the overall service quality. Therefore, it may be concluded that the refugees are more satisfied with the services. There was a positive correlation between service quality and patient satisfaction (29-31) which can be due to refugees' low expectations or service standards in Iran compared with those in their own country. One of the strengths of the PHC system in Iran is the provision of free services which makes them accessible to patients (32); therefore, it can be inferred that refugees’ expectations are reduced as a result of using free or affordable health services.
The highest and lowest mean scores were related to efficiency (4.12 ±0.64) and tangibility (3.28 ±0.39) dimensions. Efficiency refers to the efforts made by providers to prevent the provision of unnecessary and costly services. Similarly, Sharifi et al. (28) assessed healthcare quality in their study, where efficiency obtained the highest mean score. However, the results of the study by Mossadegh Rad et al. (23) revealed the lowest mean score in the efficiency dimension. A high score in this dimension shows that refugees do not bear the cost of receiving services. Moreover, tangibility refers to the level of cleanliness of the physical environment, the appearance of employees, modern facilities, and equipment. In line with our study, the results of a systematic review by Rahmani et al. reported tangibility as the weakest dimension (27). Despite successful interventions and the development of health indicators in Iran in the 1980s, it appears that primary care has received inappropriate funding and investment as outdated equipment and inadequate physical environment are observed in health centers (33). On the other hand, in assessing the quality of outpatient services in Iran, the tangibility dimension obtained the highest average score (34).
The most crucial determinants of service quality were timeliness (r = 0.769) and interactions (r = 0.768). Reducing waiting time, facilitating the filing and payment processes, and improving the courteous behavior of service providers, along with answering and understandable explanations to the clients, can have a direct impact on patients' positive perception of service quality and satisfaction. According to a number of studies, one of the most crucial elements in shaping a favorable view of service quality is excellent communication and interaction between service providers and refugees. (15, 35) A study by Atinga et al. (36) showed that waiting time is one of the most important factors determining patients’ satisfaction with the quality of healthcare delivery. The results of a study by Abbasi-Moghaddam et al. (37) showed the highest correlation between the doctor's advice and explanation to the patient and the service quality score. Nonetheless, this study revealed that waiting time had the least effect on quality rating for outpatient services. In other studies conducted in health centers and referral hospitals, the provision of information and responsiveness dimension received the lowest scores (38, 39) Furthermore, the results indicated a significant relationship between patient residence, gender, education, the rate of center visits, and service quality. Patients who were female had less education, lived in urban areas, and made more visits to healthcare centers gave a higher scoreto service quality. According to earlier studies, socio-demographic characteristics affect patient-provider interactions which in turn affect the quality of services. This is in line with the result of the study by Abbasi-Moghaddam et al. who found that patients who were female and resided in urban areas were more satisfied with the quality of services (37, 40). Also, the study by Alhassan et al. revealed that patients with higher levels of education have a favorable view of primary health facilities service quality (41). In contrast to our findings, other studies showed no significant relationship between the rate of visits to healthcare centers and service quality (37, 42).
Limitations
The findings of this study are subject to certain limitations. Healthcare quality is a wide notion that depends on a number of variables and cannot be fully investigated through quantitative studies. However, more information would be gained by triangulation of key informant interviews and focus groups with patients and service providers. As a result, it is recommended that potential researchers evaluate service quality by using a triangulation approach in addition to quantitative measurements. Furthermore, generalizing the findings to the broader community should be done with caution because only the perspective of the migrants and refugees was measured in this study.
Conclusion
According to the findings, the quality of services from the perspective of refugees was generally good (3.86 out of 5). Efficiency and tangibility received the highest and lowest mean scores, respectively. The managers and decision-makers are advised to allocate sufficient resources to equip and modify the amenities at healthcare centers. It is also recommended that the personnel pay more attention to physical space cleanliness and neat appearance.
Ethical considerations
All participants were informed of the aims of the study, and their participation was on a voluntary basis. Verbal informed consents were secured from each participant since, according to the ethical principles of Iran, no written consent is needed for studies using non-invasive clinical techniques. The questionnaires were all anonymous to keep the personal information confidential. The completion of the questionnaires was not compulsory and the participants had the right to refuse participation or withdraw from the study. This study is part of a project approved by the National Committee of Ethics in Biomedical Research with the code IR.IUMS.REC.1400.442.
Conflict of Interests
The authors declare that they have no competing interests.
Acknowledgments
This research has been supported by Iran University of Medical Sciences. The authors would like to thank the individuals and organizations that contributed to this study, especially the migrants and refugees and the personnel of the health centers.
Cite this article as : Aghaei Hashjin A, Bagherzadeh R, Faraji A, Rouzbahani M, Farrokhi P. Evaluating Primary Healthcare Quality from Migrants and Refugees’ Viewpoint. Med J Islam Repub Iran. 2024 (6 Feb);38:12. https://doi.org/10.47176/mjiri.38.12
References
- 1. World Health Organization (WHO). Primary Health Care: Declaration of Alma-Ata International Conference on Primary Health Care. Alma-Ata; 1978.
- 2.Rifkin SB. Alma Ata after 40 years: Primary Health Care and Health for All—from consensus to complexity. BMJ Glob Health. 2018;3(Suppl 3):e001188. doi: 10.1136/bmjgh-2018-001188. [DOI] [PMC free article] [PubMed] [Google Scholar]
- 3. World Health Organization (WHO), UNICEF. A vision for primary health care in the 21st century: towards universal health coverage and the Sustainable Development Goals. Geneva: World Health Organization and the United Nations Children’s Fund (UNICEF). 2018.
- 4.Langlois EV, McKenzie A, Schneider H, Mecaskey JW. Measures to strengthen primary health-care systems in low-and middle-income countries. Bull World Health Organ. 2020;98(11):781. doi: 10.2471/BLT.20.252742. [DOI] [PMC free article] [PubMed] [Google Scholar]
- 5.Hone T, Macinko J, Millett C. Revisiting Alma-Ata: what is the role of primary health care in achieving the Sustainable Development Goals. The Lancet. 2018;392(10156):1461. doi: 10.1016/S0140-6736(18)31829-4. [DOI] [PubMed] [Google Scholar]
- 6.Binagwaho A, Ghebreyesus TA. Primary healthcare is cornerstone of universal health coverage. BMJ (Online) 2019 doi: 10.1136/bmj.l2391. [DOI] [PubMed]
- 7.Nekoei Moghadam, Amiresmaili M, Sadeghi V, Zeinalzadeh AH, Tupchi M, Parva S. A qualitative study on human resources for primary health care in Iran. Int J Health Plan Manag. 2018;33(1):e38–e48. doi: 10.1002/hpm.2405. [DOI] [PubMed] [Google Scholar]
- 8.Farrokhi P, Zarei E, Bagherzadeh R, Irannejad B, Hashjin AA. Development and validation of primary health care quality assessment tool. BMC Health Serv Res. 2023;23(1):1156. doi: 10.1186/s12913-023-10162-x. [DOI] [PMC free article] [PubMed] [Google Scholar]
- 9. United Nations (UN). Global issues: refugees 2020 [Available from: https://www.un.org/en/sections/issues-depth/refugees/].
- 10.Kiani MM, Khanjankhani K, Takbiri A, Takian A. Refugees and sustainable health development in Iran. Arch Iran Med. 2021;24(1):27–34. doi: 10.34172/aim.2021.05. [DOI] [PubMed] [Google Scholar]
- 11. United Nations High Commissioner for Refugees (UNHCR). Refugees in Iran 2020 [available at: https://www.unhcr.org/ir/refugees-in-iran/]
- 12.Salmani I, Seddighi H, Nikfard M. Access to health care services for Afghan refugees in Iran in the COVID-19 pandemic. Disaster Med Public Health Prep. 2020;14(4):e13. doi: 10.1017/dmp.2020.240. [DOI] [PMC free article] [PubMed] [Google Scholar]
- 13.Hahn K, Steinhäuser J, Wilfling D, Goetz K. Quality of health care for refugees–a systematic review. BMC Int Health Hum Rights. 2019;19:1–10. doi: 10.1186/s12914-019-0205-7. [DOI] [PMC free article] [PubMed] [Google Scholar]
- 14.Hynie M. The social determinants of refugee mental health in the post-migration context: A critical review. Can J Psychiatry. 2018;63(5):297–303. doi: 10.1177/0706743717746666. [DOI] [PMC free article] [PubMed] [Google Scholar]
- 15.Iqbal M, Walpola R, Harris‐Roxas B, Li J, Mears S, Hall J. et al. Improving primary health care quality for refugees and asylum seekers: A systematic review of interventional approaches. Health Expect. 2022;25(5):2065. doi: 10.1111/hex.13365. [DOI] [PMC free article] [PubMed] [Google Scholar]
- 16.Marchetti F, Preziosi J, Zambri F, Tambascia G, Di Nolfi, Scardetta P. et al. Health needs and perception of health care quality among Asylum Seekers and Refugees in an Italian local health authority: A qualitative study. Front Public Health. 2023;11 doi: 10.3389/fpubh.2023.1125125. [DOI] [PMC free article] [PubMed] [Google Scholar]
- 17.Hosseini Divkolaye, Burkle FM, Jr. The Enduring Health Challenges of Afghan Immigrants and Refugees in Iran: A Systematic Review. PLoS Curr. 2017;9 doi: 10.1371/currents.dis.449b4c549951e359363a90a7f4cf8fc4. [DOI] [PMC free article] [PubMed] [Google Scholar]
- 18.Takbiri A, Takian A, Rahimi Foroushani, Jaafaripooyan E. The challenges of providing primary health care to Afghan immigrants in Tehran: a key global human right issue. Int J Hum Rights Healthc. 2018;13(3):259. [Google Scholar]
- 19.Azizi N, Delgoshaei B, Aryankhesal A. Barriers and facilitators of providing primary health care to Afghan refugees: A qualitative study from the perspective of health care providers. Med J Islam Repub Iran. 2021;35:1. doi: 10.47176/mjiri.35.1. [DOI] [PMC free article] [PubMed] [Google Scholar]
- 20.Ghotbabadi AR, Feiz S, Baharun R. Service quality measurements: A review. IJ-ARBSS. 2015;5(2):267. [Google Scholar]
- 21.Gorji HA, Royani S, Mohseni M, Azami-Aghdash S, Moosavi A, Sheyklo SG. Primary health care quality in Iran: a systematic review and meta-analysis. Fam Med Prim Care Rev. 2019;21(1):71. [Google Scholar]
- 22.Lee D. HEALTHQUAL: a multi-item scale for assessing healthcare service quality. Serv Bus. 2017;11(3):491–516. [Google Scholar]
- 23.Mosadeghrad AM, Sokhanvar M. Measuring quality of services in Tehran teaching hospitals using HEALTHQUAL instrument. Razi Journal of Medical Sciences. 2018;25(3):10–20. [Google Scholar]
- 24.Aoki T, Inoue M, Nakayama T. Development and validation of the Japanese version of Primary Care Assessment Tool. Fam Pract. 2016;33(1):112. doi: 10.1093/fampra/cmv087. [DOI] [PubMed] [Google Scholar]
- 25.Rezapour R, Tabrizi JS, Farahbakhsh M, Saadati M, Abdolahi HM. Developing Iranian primary health care quality framework: a national study. BMC public health. 2019;19(1):1–10. doi: 10.1186/s12889-019-7237-8. [DOI] [PMC free article] [PubMed] [Google Scholar]
- 26.Hair JF. 7th. Pearson; 2009. Multivariate data analysis. [Google Scholar]
- 27.Rahmani H, Maleki R, Ghanbari MK, Behzadifar M. Quality Assessment of Services in Primary Healthcare in Iran: A Systematic Review and Meta-analysis. Ethiop J Health Sci. 2022;32(2):453. doi: 10.4314/ejhs.v32i2.26. [DOI] [PMC free article] [PubMed] [Google Scholar]
- 28.Sharifi T, Hosseini SE, Mohammadpour S, Javan-Noughabi J, Ebrahimipour H, Hooshmand E. Quality assessment of services provided by health centers in Mashhad, Iran: SERVQUAL versus HEALTHQUAL scales. BMC Health Serv Res. 2021;21(1):397. doi: 10.1186/s12913-021-06405-4. [DOI] [PMC free article] [PubMed] [Google Scholar]
- 29.Kijima T, Matsushita A, Akai K, Hamano T, Takahashi S, Fujiwara K. et al. Patient satisfaction and loyalty in Japanese primary care: a cross-sectional study. BMC Health Serv Res. 2021;21:1–12. doi: 10.1186/s12913-021-06276-9. [DOI] [PMC free article] [PubMed] [Google Scholar]
- 30.Al-Abri R, Al-Balushi A. Patient satisfaction survey as a tool towards quality improvement. Oman Med J. 2014;29(1):3. doi: 10.5001/omj.2014.02. [DOI] [PMC free article] [PubMed] [Google Scholar]
- 31.Batbaatar E, Dorjdagva J, Luvsannyam A, Savino MM, Amenta P. Determinants of patient satisfaction: a systematic review. Perspect Public Health. 2017;137(2):89–101. doi: 10.1177/1757913916634136. [DOI] [PubMed] [Google Scholar]
- 32.Tabrizi JS, Pourasghar F, Nikjoo RG. Status of Iran’s primary health care system in terms of health systems control knobs: a review article. Iran J Public Health. 2017;46(9):1156. [PMC free article] [PubMed] [Google Scholar]
- 33.Moghadam MN, Sadeghi V, Parva S. Weaknesses and challenges of primary healthcare system in Iran: a review. Int J Health Plan Manag. 2012;27(2):e121. doi: 10.1002/hpm.1105. [DOI] [PubMed] [Google Scholar]
- 34.Farrokhi P, Bagherzadeh R, Arab-Zozani M, Zarei E. Assessing the quality of hospital outpatient services in Iran: a systematic review and meta-analysis. BMC Health Serv Res. 2023;23(1):508. doi: 10.1186/s12913-023-09506-4. [DOI] [PMC free article] [PubMed] [Google Scholar]
- 35.Jahn R, Ziegler S, Nöst S, Gewalt SC, Straßner C, Bozorgmehr K. Early evaluation of experiences of health care providers in reception centers with a patient-held personal health record for asylum seekers: a multi-sited qualitative study in a German federal state. Glob Health. 2018;14:1–12. doi: 10.1186/s12992-018-0394-1. [DOI] [PMC free article] [PubMed] [Google Scholar]
- 36.Atinga RA, Abekah‐Nkrumah G, Domfeh KA. Managing healthcare quality in Ghana: a necessity of patient satisfaction. Int J Health Care Qual. 2011;24(7):548. doi: 10.1108/09526861111160580. [DOI] [PubMed] [Google Scholar]
- 37.Abbasi-Moghaddam MA, Zarei E, Bagherzadeh R, Dargahi H, Farrokhi P. Evaluation of service quality from patients’ viewpoint. BMC Health Serv Res. 2019;19(1):1–7. doi: 10.1186/s12913-019-3998-0. [DOI] [PMC free article] [PubMed] [Google Scholar]
- 38.Aghamolaei T, Eftekhaari TE, Rafati S, Kahnouji K, Ahangari S, Shahrzad ME. et al. Service quality assessment of a referral hospital in Southern Iran with SERVQUAL technique: patients’ perspective. BMC Health Serv Res. 2014;14(1):1–5. doi: 10.1186/1472-6963-14-322. [DOI] [PMC free article] [PubMed] [Google Scholar]
- 39.Mohammadi A, Mohammadi J. Evaluating quality of health services in health centres of Zanjan district of Iran. Indian J Public Health. 2012;56(4):308. doi: 10.4103/0019-557X.106422. [DOI] [PubMed] [Google Scholar]
- 40.Mosadeghrad AM. Factors influencing healthcare service quality. Int J Health Policy Manag. 2014;3(2):77. doi: 10.15171/ijhpm.2014.65. [DOI] [PMC free article] [PubMed] [Google Scholar]
- 41.Alhassan RK, Duku SO, Janssens W, Nketiah-Amponsah E, Spieker N, van Ostenberg. et al. Comparison of perceived and technical healthcare quality in primary health facilities: implications for a sustainable National Health Insurance Scheme in Ghana. PloS one. 2015;10(10):e0140109. doi: 10.1371/journal.pone.0140109. [DOI] [PMC free article] [PubMed] [Google Scholar]
- 42.Farrokhi P, Aryankhesal A, Bagherzadeh R, Aghaei Hashjin. Evaluation of outpatient service quality: What do patients and providers think. Int J Healthc Manag. 2022:1–10. doi: 10.1080/20479700.2022.2110195. [DOI]