Abstract
Objective.
Proton pencil beam scanning (PBS) treatment fields needs to be verified before treatment deliveries to ensure patient safety. In current practice, treatment beam quality assurance (QA) is measured at a few selected depths using film or a 2D detector array, which is insensitive and time-consuming. A QA device that can measure all key dosimetric characteristics of treatment beams spot-by-spot within a single beam delivery is highly desired.
Approach.
We developed a multi-layer strip ionization chamber (MLSIC) prototype device that comprises of two layers of strip ionization chambers (IC) plates for spot position measurement and 64 layers of plate IC for beam energy measurement. The 768-channel strip ion chamber signals are integrated and sampled at a speed of 3.125 kHz. It has a 25.6 cm × 25.6 cm maximum measurement field size and 2 mm spatial resolution for spot position measurement. The depth resolution and maximum depth were 2.91 mm and 18.6 cm for 1.6 mm thick IC plate, respectively. The relative weight of each spot was determined from total charge by all IC detector channels.
Main results.
The MLSIC is able to measure ionization currents spot-by-spot. The depth dose measurement has a good agreement with the ground truth measured using a water tank and commercial one-dimensional (1D) multi-layer plate chamber. It can verify the spot position, energy, and relative weight of clinical PBS beams and compared with the treatment plans.
Significance.
The MLSIC is a highly efficient QA device that can measure the key dosimetric characteristics of proton treatment beams spot-by-spot with a single beam delivery. It may improve the quality and efficiency of clinical proton treatments.
Keywords: proton therapy, quality assurance, multilayer ionization chamber, intensity modulated proton therapy
1. Introduction
Intensity-modulated proton therapy (IMPT) by pencil beam scanning (PBS) has largely replaced double-scattering proton therapy due to its ability to spatially modulate proton fluence and generate an optimal dose distribution via inverse treatment plan optimization (Oelfke and Bortfeld 2003, Muzik et al 2008). Patient safety is of paramount importance in radiotherapy. Quality assurance (QA) of the PBS treatment beams prior to treatment delivery is essential for proton therapy (Arjomandy et al 2019). A common patient-specific QA method in current clinical practice for PBS proton treatment is to use radiochromic film or a two-dimensional (2D) dosimetry device to measure the planar composite dose at 2–3 selected depths in water phantom (Trnkova et al 2016), which is a time-consuming process as the treatment beams need to be delivered multiple times. Measurement of dose distributions with film or 2D detectors is also insensitive and it is difficult to catch minor delivery errors in the composite dose distributions (Bizzocchi et al 2017, Chan et al 2017). With conventional QA measurement devices, small discrepancies in beam energies are usually not distinguishable due to lack of spatial-temporal measurement features. Accurate beam energy is extremely important for proton treatments as the organs-at-risk (OARs) are often located at the distal end of the proton beams and inaccurate beam energy may cause overdose to the OARs or underdose to targets. Multi-layer ionization chamber devices have been developed to measure the range of proton beams (Yajima et al 2009, Dhanesar et al 2013, Baumer et al 2015, Mirandola et al 2018, Vai et al 2019), but they do not have capacities to measure spot position in the same time. The 2D ionization chamber array (Arjomandy et al 2008, Lin et al 2015) or scintillation screen detector (Rana and Samuel 2019), on the other hand, can only measure spot profiles and positions.
In this study, we developed and validated a multi-layer strip ionization chamber (MLSIC) device that was developed in-house. Based on our knowledge, it is the first published QA device that can measure the full dosimetric characteristics of PBS treatment fields spot-by-spot, including proton spot profiles, positions, energies and outputs.
2. Materials and methods
2.1. Multi-layer strip ionization chamber (MLSIC) prototype
Figure 1 illustrates the diagram and a prototype MLSIC device set up to perform QA measurement at a proton therapy facility. The ionization chamber plates were made from standard fiberglass printed circuit board (PCB) material. Two MLSIC prototypes were developed, one with 1 mm thick and one with 1.6 mm thick plates for the evaluation of different energy resolutions. The maximum effective measurement area is 25.6 cm×25.6 cm, determined by the cross-sectional surface area of the device. The first two layers (layer X and Y indicated in figure 1(a)) of the MLSIC at its entrance, proximal to the beam, comprise 128 channels of strip ionization chambers, each 2 mm wide, that are positioned orthogonal to each other for spot profile and position (x, y) measurement. Following the X and Y plates, there are 64 layers of plate ionization chambers (Z1-Z64) for depth dose profile and range (z) measurement. The dimensions of the device are 26 cm × 38 cm × 40 cm and the total weight is about 29 kg. The charge collecting signal electrodes were etched on the front side of the PCB and the high voltage (HV) electrode was on the backside of the PCB. A ground plate was positioned between the signal electrodes and HV electrodes to prevent the leakage current. A bias voltage ranged from 150 to 450 V can be provided. The airgap between the PCBs is approximately 2 mm. In order to reduce the capacitance of the ionizaton chamber, the range measurement plate chambers have the same structure as the X and Y layers, except every 8th channel shares the same analog-to-digital converter (ADC) channel as illustrated in figure 2(b). This can reduce noise and also allow future development of 3D dose distribution measurement, proton radiography and CT. The MLSIC device comprises 768 (128 × 2 + 8 × 64) ADC channels in total. After calibration, a proton pencil beam spot generates Gaussian-shape profiles in the first two layers, which are used to determine spot position, and verify the beam sigma. The 64 layers of z-channel plates are used for range measurement.
Figure 1.
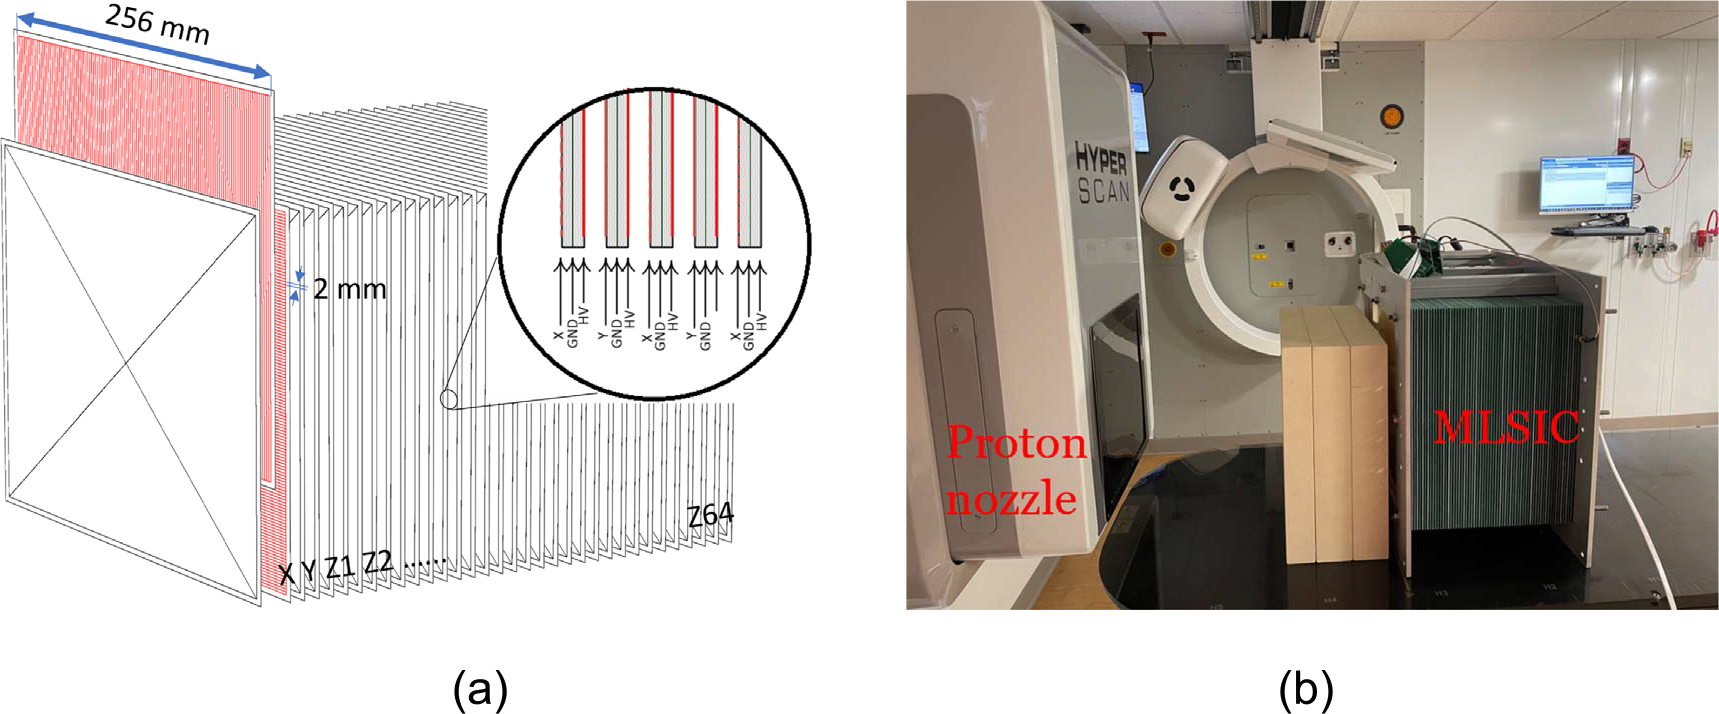
(a) The diagram and (b) the prototype of MLSIC device, dimensions 26 cm (L) × 38 cm (W) × 40 cm (H), weight 29 kg. It comprises 66 layers of ionization chamber arrays: two layers of strip ionization chambers X and Y at the entrance measure the spot position, and the following 64 layers of plate ionization chamber (Z1-Z64) measure the range of a proton beam.
Figure 2.
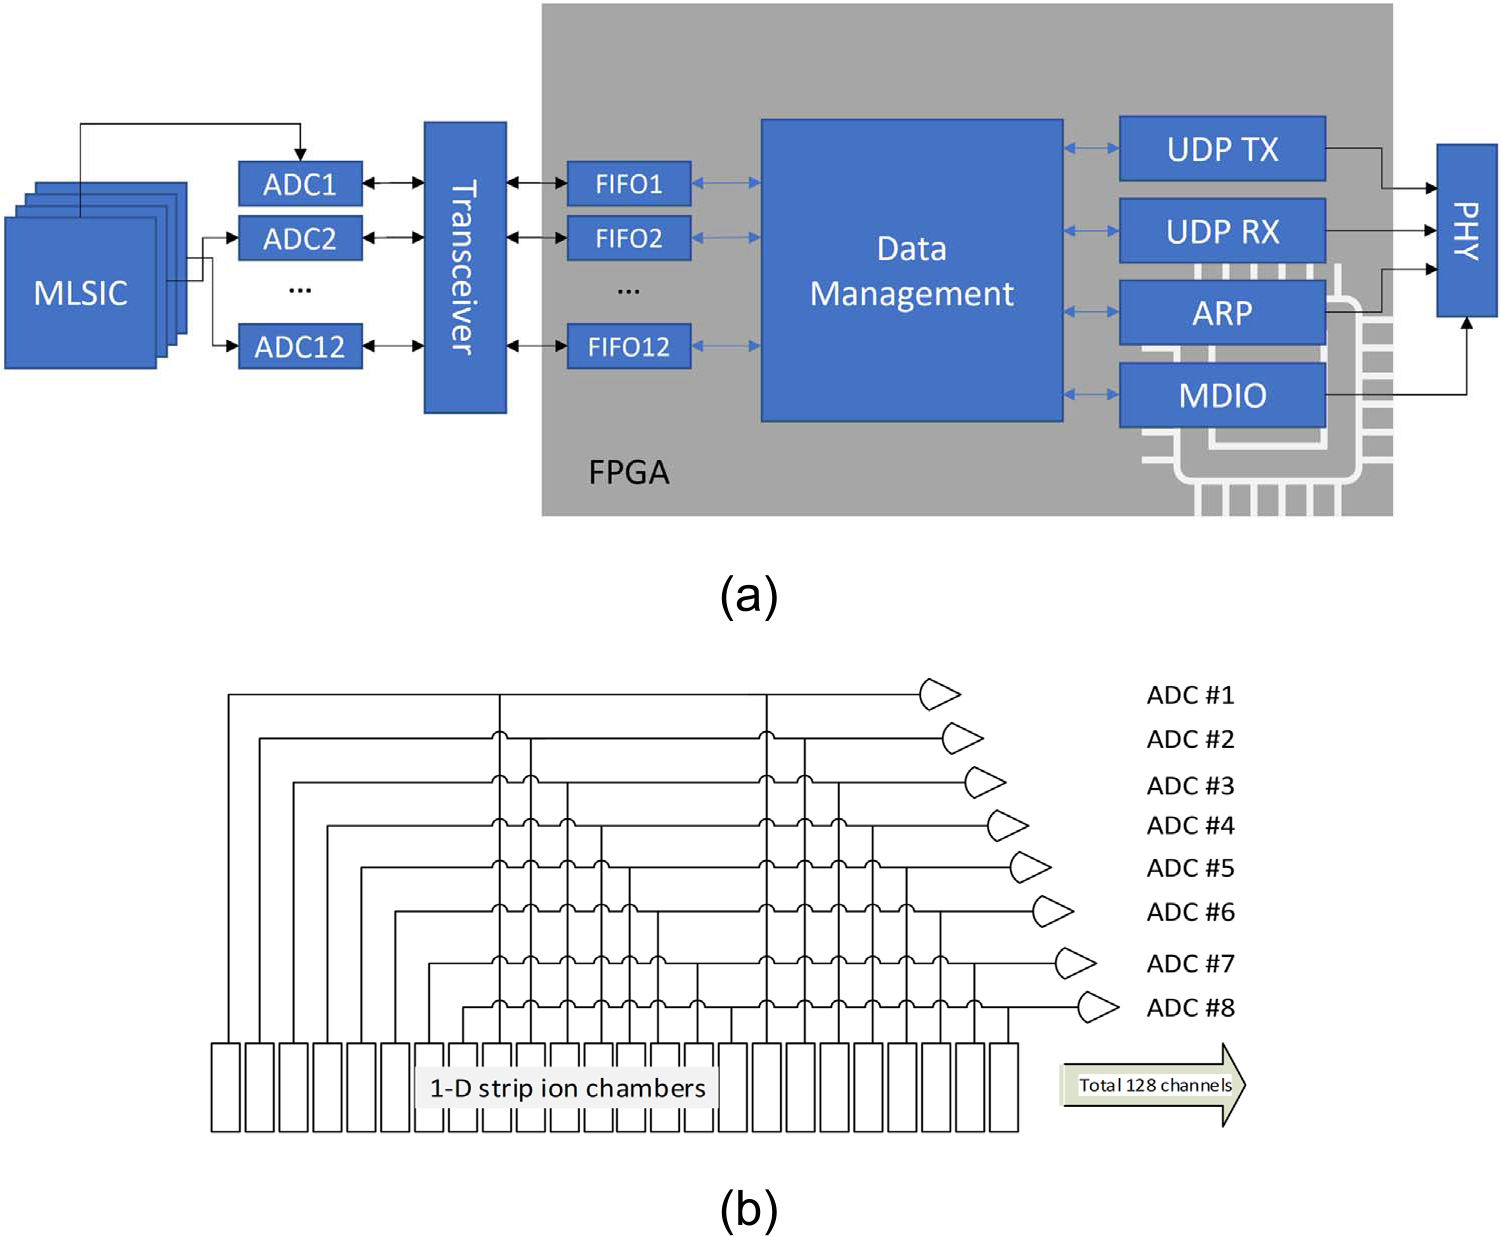
(a) Architecture of data acquisition (DAQ) system of the MLSIC device; (b) internal connectivity of the Z-channels. 768 total channels of ionization currents are integrated and sampled at a frequency of 3.125 kHz at 16-bit resolution. The Z plates were also made of the same strip chambers as X–Y plates, except every eighth channel was interconnected, ADC1(1:8:128), ADC2(2:8:128), etc.
2.2. Data acquisition (DAQ) system
Figure 2 illustrates the function diagram of the data acquisition (DAQ) system. The data acquisition system was designed based on the 64-channel current sensing ADC chips made by Texas Instruments (DDC 264, Dallas, Texas). Depending on the specific beam, the dwell duration of each spot may last from a few to a few hundred milliseconds. Thus high-speed data acquisition is necessary to separate the information from different spots. The 768 ADC channels were controlled by a Field Programming Gate Array (FPGA) device (Nexy 4 DDR, Digilent, Pullman, WA), and the ionization currents were sampled and digitized in 16-bit resolution at a frequency of 3.125 kHz. The raw data was exported to a computer through an ethernet port with a data rate of 4.8 MB s−1. We developed a Matlab program to process and analyze the data.
2.3. Calibration
2.3.1. Detector relative sensitivity calibration
The DDC 264 ADC chips have four programmable ranges for the measurement of different beam intensities. Due to manufacturing variations in ADC chips, each ion chamber channel may have slightly different sensitivities to ionization charge. A high energy PBS beam was used to scan across the maximum field size to calibrate the relative sensitivity of X and Y channels. Similarly, the relative sensitivity of the Z-channels also was calibrated with a proton beam by comparing the integral depth dose (IDD) curves measured with a commercial proton QA device (StingRay, IBA Dosimetry GmbH, Schwarzenbruck, Germany). The highest energy (~230 MeV) of the proton beam was used because it was able to penetrate the detector, depositing the dose to different Z-channels with a slow variation.
2.3.2. Water equivalent thickness (WET) measurement
The Z-channel boards in the two prototype devices were made of 1.0 mm and 1.6 mm thick FR4 type PCBs, respectively. The WET values of the Z-channel boards were calibrated using proton beams with different energies. The positions of Bragg peaks in the IDD curve were measured, and the WET of each board was determined by fitting the positions of the Bragg peaks with a linear function.
2.4. Determination of spot position and range
All IC channels were sampled at a frequency as high as 3.125 kHz. Figure 3(a) shows the raw measurement data by the X plate as an example. Because the integration time (0.32 ms) is much shorter than the pulse duration, the MLSIC device is able to differentiate individual pulses from the changes of spot positions. Each proton pulse at the same location may contain several macro pulses with a period of 1.54 ms. We trained a simple classifier to differentiate signals from background noise and identify the macro pulses (see figure 3(b)). The data within a pulse were summed up and used to determine spot position from profiles and range.
Figure 3.
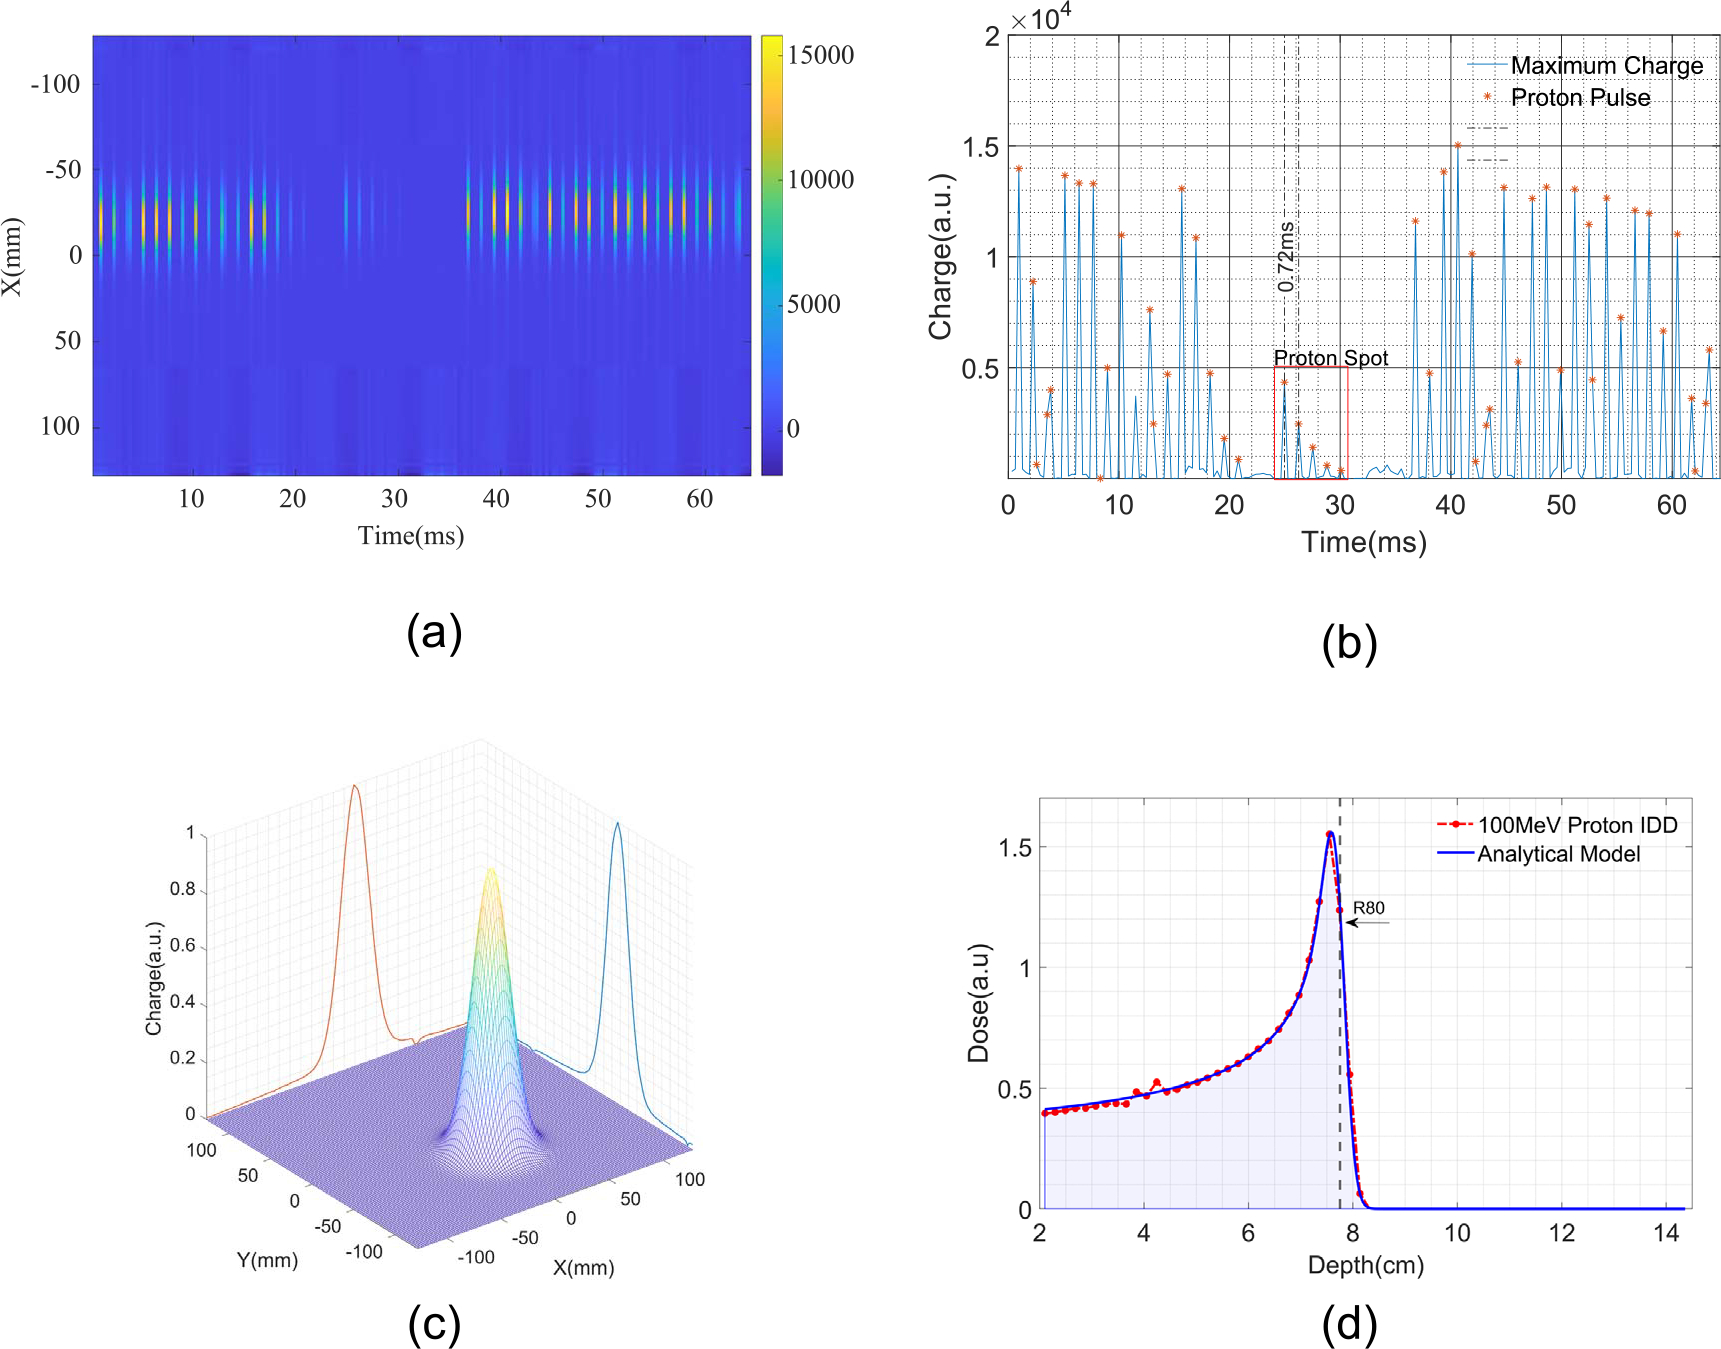
Measurement of a PBS beam and extract dosimetric information spot-by-spot. (a) Raw data of proton pulses measured by the X-channel plate; (b) classification results of the proton pulse from raw data; (c) determination of spot position from X–Y measurement; (d) determination of spot range and relative weight from Z measurement. Range is calculated by the depth at 80% of the maximum dose.
2.4.1. Measurement of spot position and size
A PBS proton beam is deflected to different X–Y positions rapidly by a bending magnet. The accuracy of spot position needs to be verified in QA process. The profile of spot dose distribution also needs to be consistent to match with the beam model in treatment planning system. Conventionally, spot position and size are measured by films or a scintillation screen. The X–Y channels of MLSIC can directly measure spot position and size. The incident proton pencil beam generates Gaussian-like dose profiles in X and Y strip chamber channels. After the charges within a spot are summed up, the center and width of each spot can be determined by fitting the x–y profile measurement with a Gaussian function, as shown in figure 3(c).
2.4.2. Measurement of beam energy
The beam energy is also an import dosimetric characteristic that needs to be measured in the QA process. The range of a proton spot is determined from the Bragg peak dose falloff in IDD. After WET measurement, the energy versus Bragg peak position was obtained. The charge measurement from the 64 Z-channels was fitted into an analytical Bragg curve model (Bortfeld 1997), and the range was determined from 80% of the distal dose falloff. The energy of each spot was thus obtained by looking up the calibrated curve. Proton beams at different energies are delivered layer-by-layer. The MLSIC is able to measure beam energy spot-by-spot.
2.4.3. Measurement of relative spot weight
Spot weight measurement is a very important dosimetric characteristic that needs to be measured. The MLSIC is able to verify the delivery accuracy of proton beams spot-by-spot. At each energy level, the total charges of all Z-channels were recorded and normalized by the beam monitor unit (MU). The relative MU of each spot of the same energy layer was calculated by the area under the IDD curve, and the relative MU was normalized by the energy layer (see figure 3(d)).
2.5. PBS field measurements
A Mevion Hyperscan™ system was used for PBS proton beam delivery (see figure 1(b)). Also, a Mevion S250™ system was used for passive scattering proton beam delivery. Mevion uses synchrocyclotron technology to deliver macro pulses of protons at a nominal 750 Hz pulse repetition frequency. The maximum proton energy of the Hyperscan™ system is 227 MeV with 5.3 mm sigma in air. In order to reduce beam energy, a series of range shifter plates of various thicknesses are incorporated in the nozzle. The beam energy is reduced to different energy levels by changing the combination of range shifter plates. These range shifters increase spot width (beam sigma) due to multiple Coulomb scattering. For example, at 147.4 MeV, the beam sigma increases to 11.2 mm. We delivered pristine proton beams with energy at 70, 80, 90, 100, and 110 MeV in order to evaluate the performance of our MLSIC devices in energy determination through an established lookup table associating the proton range to its energy.
3. Results
3.1. Calibration results
Figure 4(a) shows the actual segment of the IDD curve that was used for the measurement of Z-channel sensitivity. The full IDD curve was measured with a commercial parallel plate ionization chamber (StingRay™, IBA Dosimetry GmbH, Schwarzenbruck, Germany) for range measurement. Unlike the StingRay device, which can measure over the full range, the MLSIC is designed for measuring only partial depth at the price of full dosimetric characteristics. After relative sensitivity calibration, the MLSIC device was able to measure depth dose with minor variation. Figure 4(b) shows the depth dose measurements of 70, 80, 90, 100, and 110 MeV beams after relative sensitivity calibration. The range of a proton beam is defined as the depth of 80% of the Bragg peak dose. Figure 3(c) plots the layer index of the 80% dose profile versus nominal beam ranges. The data were fitted into a linear equation, by which the WET of a Z-channel board was obtained. The measurement indicated that the WET of the strip chamber board made of 1 mm PCB is 1.95 mm. The WET of the 1.6 mm PCB was measured as 2.91 mm. With 64 layers of Z-channels, the MLSIC device can measure about 12.5 cm and 18.6 cm for 1 mm and 1.6 mm PCB boards, respectively.
Figure 4.

(a) IDD (shown in red) of 230 MeV proton beam measured with StingRay device in water tank. Segment of IDD (shown in blue) measured by MLSIC that was used in Z-channel relative sensitivity calibration; (b) IDD curves of 70, 80, 90, 100, and 110 MeV beams after Z-channel sensitivity calibration and comparison with StingRay measurement; (c) the relation between measured range and nominal range of proton beams in water. The WET of Z-channel board was measured to be 1.95mmby fitting the data with a linear function.
3.2. Measurement of a square PBS field
Figure 5 shows the measurement of the square 227 MeV PBS calibration field with 41 × 41 spots and 5 mm spot spacing. The raster scanning started from (x, y) = (−100, −100) along the y-direction. First columns ended at (−100, 100). Then the next spot started at (−95, 100) and ended at (−95, −100). This pattern of scanning continued and ended at (x, y) = (100, 100). The X–Y channel images illustrate the trajectory of the raster scanning PBS spots, where the gaps between the spots have been eliminated. The locations of the spots were determined from the measurement by fitting the profile data to a skewed Normal function. The beam locations were used to calculate the rotation and translation of the detector from the isocenter of the proton nozzle by a simple iterative closest point registration method (Besl and McKay 1992, Chen and Medion 1992 ). Note that the proton pencil beams were not parallel to each other. The geometry is analogus to a cone beam x-ray geometry, where the maximum angle of deviation from a parallel beam is about 4.3° in the X or Y plane. The virtual source position was calculated at about 133 cm from the MLSIC surface.
Figure 5.
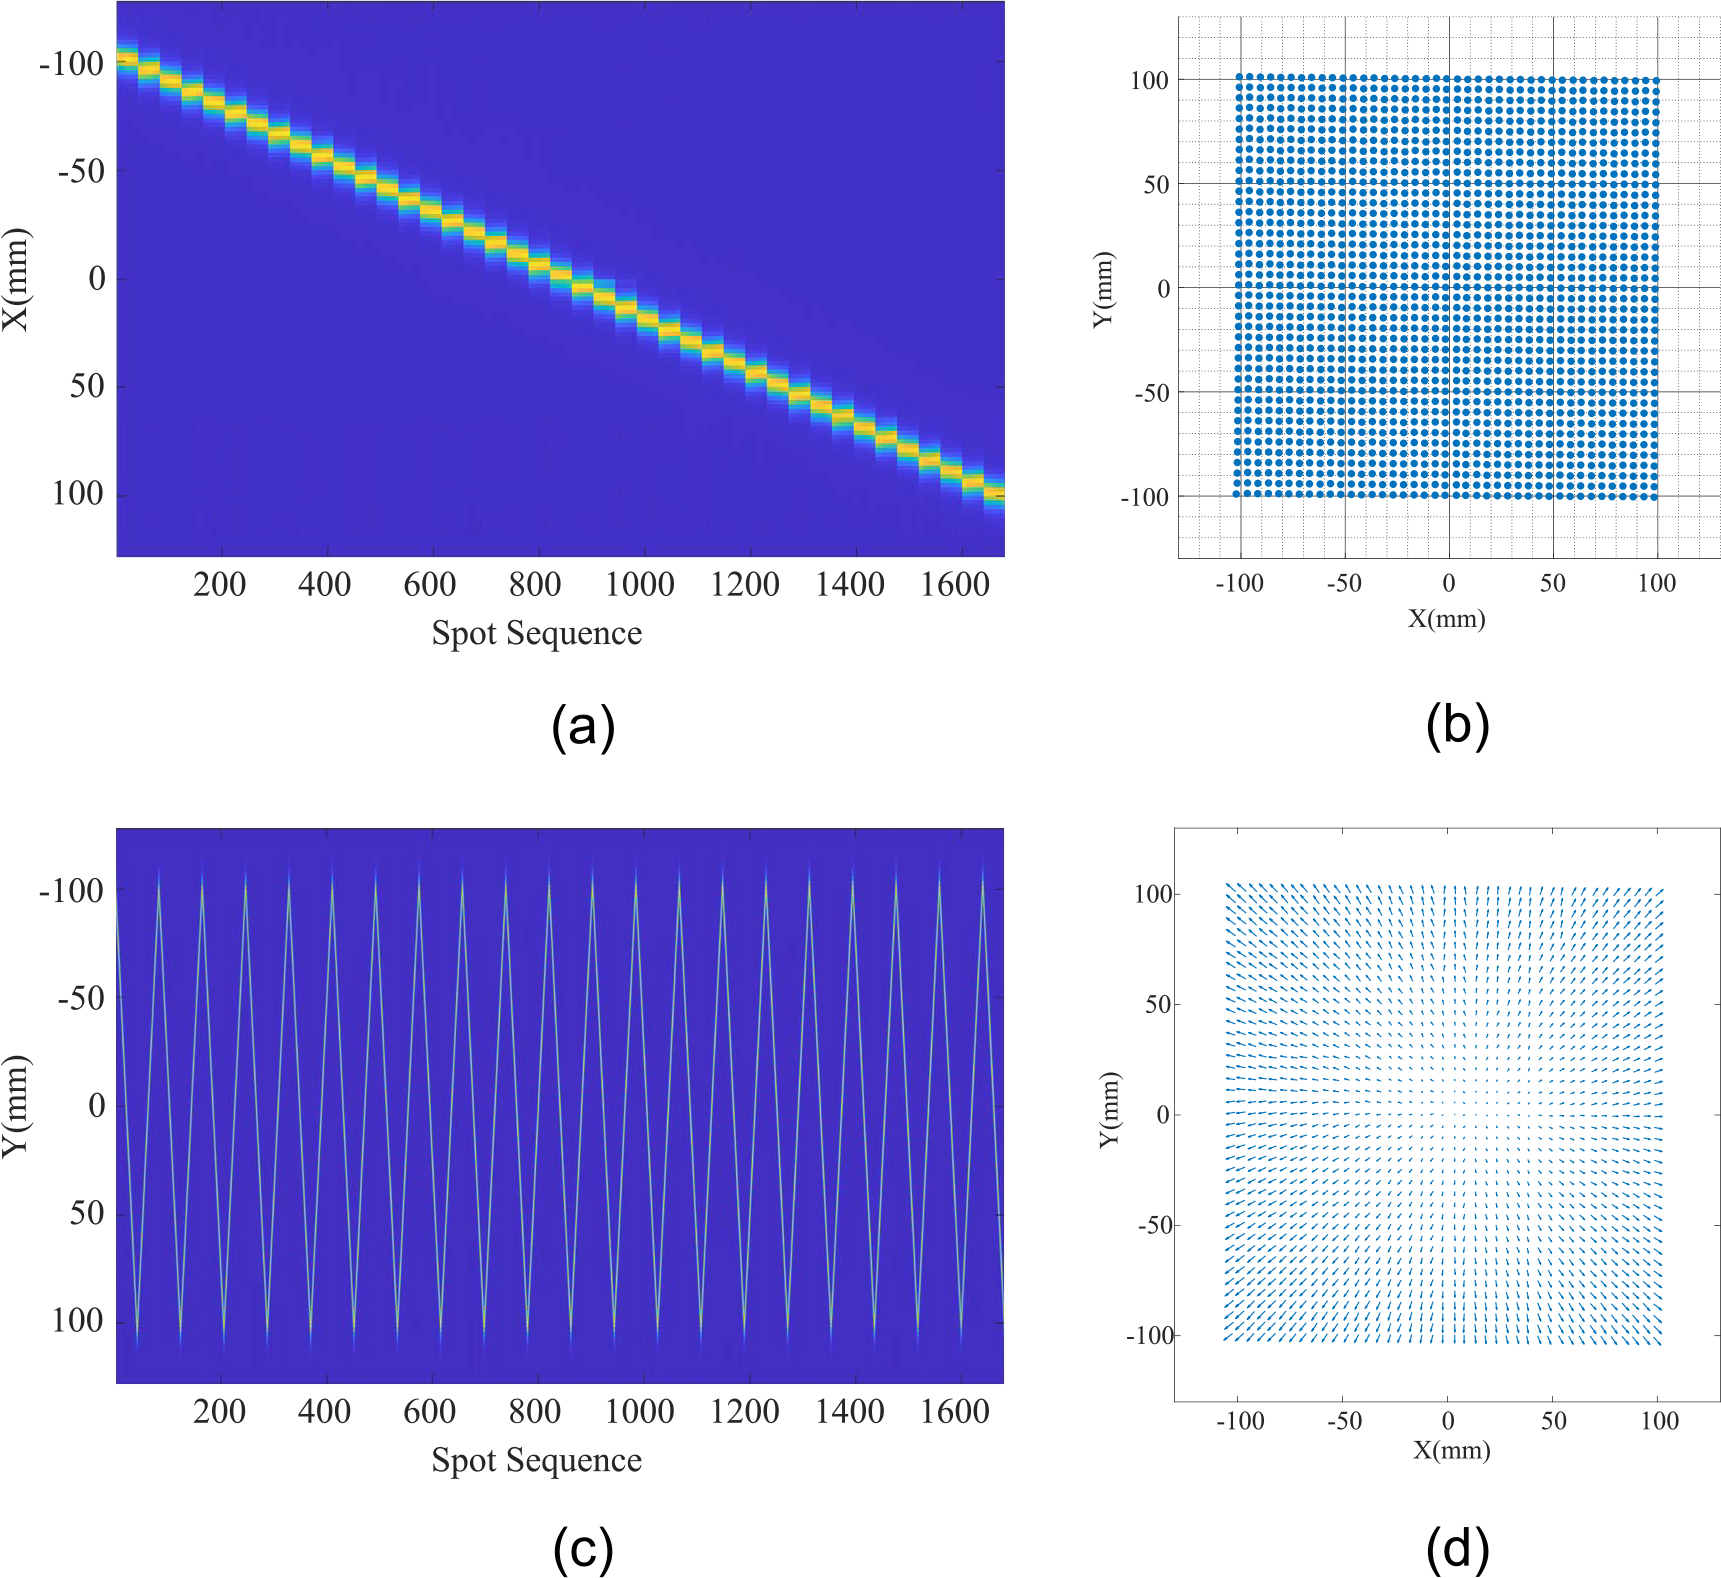
(a) The measured spot positions by the X channels of the MLSIC in which 41 groups of spots with the same x-values can be seen; (b) the spot location calculated from X–Y channels; (c) the measured spot position of Y-channels of the MLSIC. The raster scan pattern is clearly shown in this image (21 peaks and 20 valleys); (d) measured beam divergence of the cone beam geometry. The arrow denotes the vector-connected beam spot from the first layer to the last layer in relative scale.
3.3. Measurement of double-scatter proton beams
To test MLSIC performance in a passively scattered field, we performed measurements on a double-scattering proton machine (S250™, Mevion Medical Systems, Littleton, MA, USA). Passively scattered fields with various range and spread-out Bragg peak (SOBP) were delivered. The field was collimated to a 10 cm × 10 cm square field with a brass aperture. Figure 6(a) illustrates the measured dose profiles of several double-scattering proton beams. Note that the lateral profiles measured using the MLSIC are not equivalent to those measured by scanning an ionization chamber in a water tank, as the MLSIC profile measurement integrates the charges in x and y directions. Nevertheless, it can still be used as a quick consistency check of beam profile symmetry and flatness in comparison with an established baseline.
Figure 6.
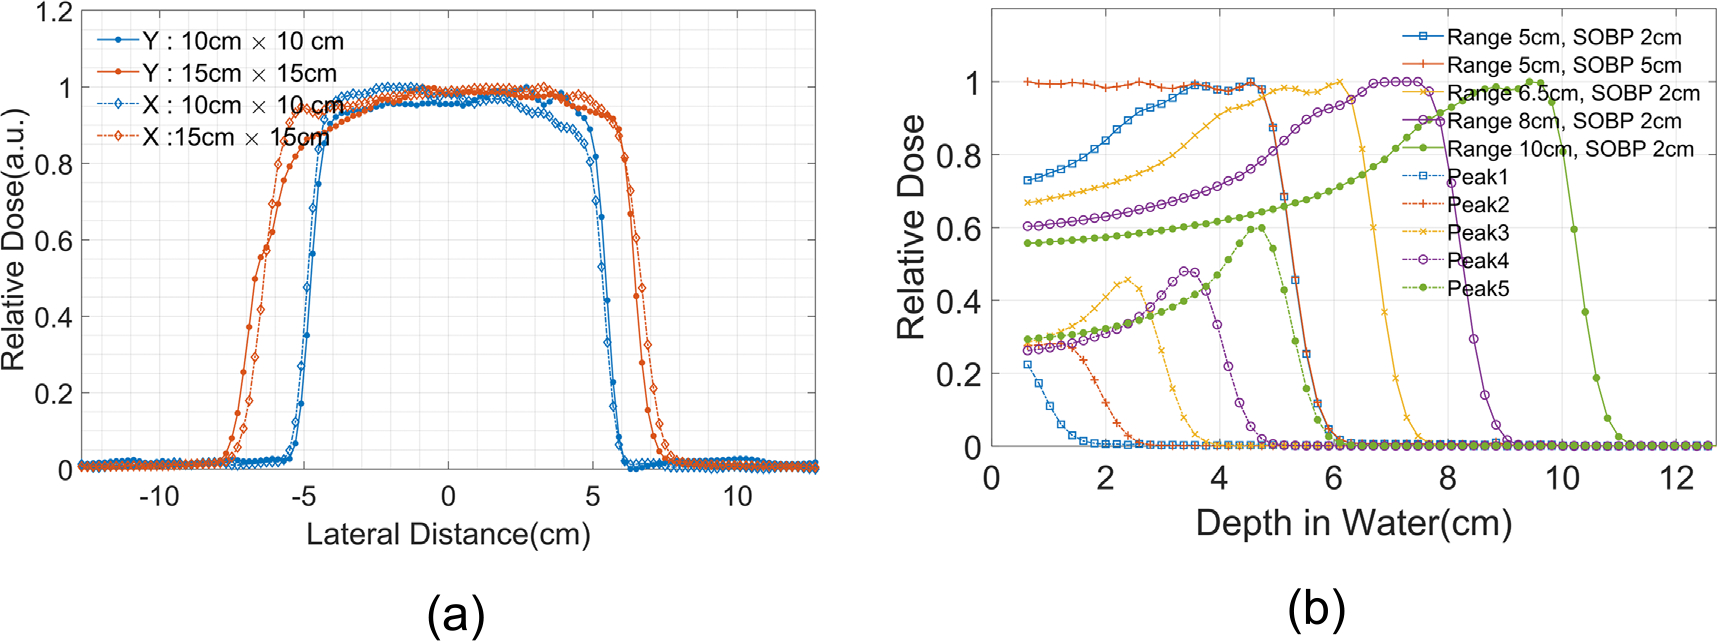
(a) Beam profile of double-scattering proton beams without buildup; (b) IDD measurements of several selected double-scattering beams. One beam (Range 5 cm, SOBP 5 cm) was decomposed into five Bragg peaks (Peak 1, 2K5) generated by the modulation wheel.
Figure 6(b) further demonstrates the depth dose measurements of several selected double-scattering beams. Because of its high native energy resolution (1.95 mm WET), the MLSIC device can measure the small dose variation within the SOBP region. Based on the data, we further decomposed one of the beams into five Bragg peaks (see figure 6(b)), which are generated by five different steps of the modulation wheel.
3.4. Measurement of clinical PBS beams
Figure 7 shows the measurement data of a clinical PBS treatment field for an IMPT brain treatment field delivered by Mevion’s Hyperscan™ system. It is noted that the beam was delivered layer by layer with a sequence optimized for range shifter changes. The beam delivery lasted more than 30 s. With a sampling rate of 3.125 kHz, more than 90 K data points were acquired. In order to display more data, the empty data from when the beam was off was omitted and not displayed.
Figure 7.
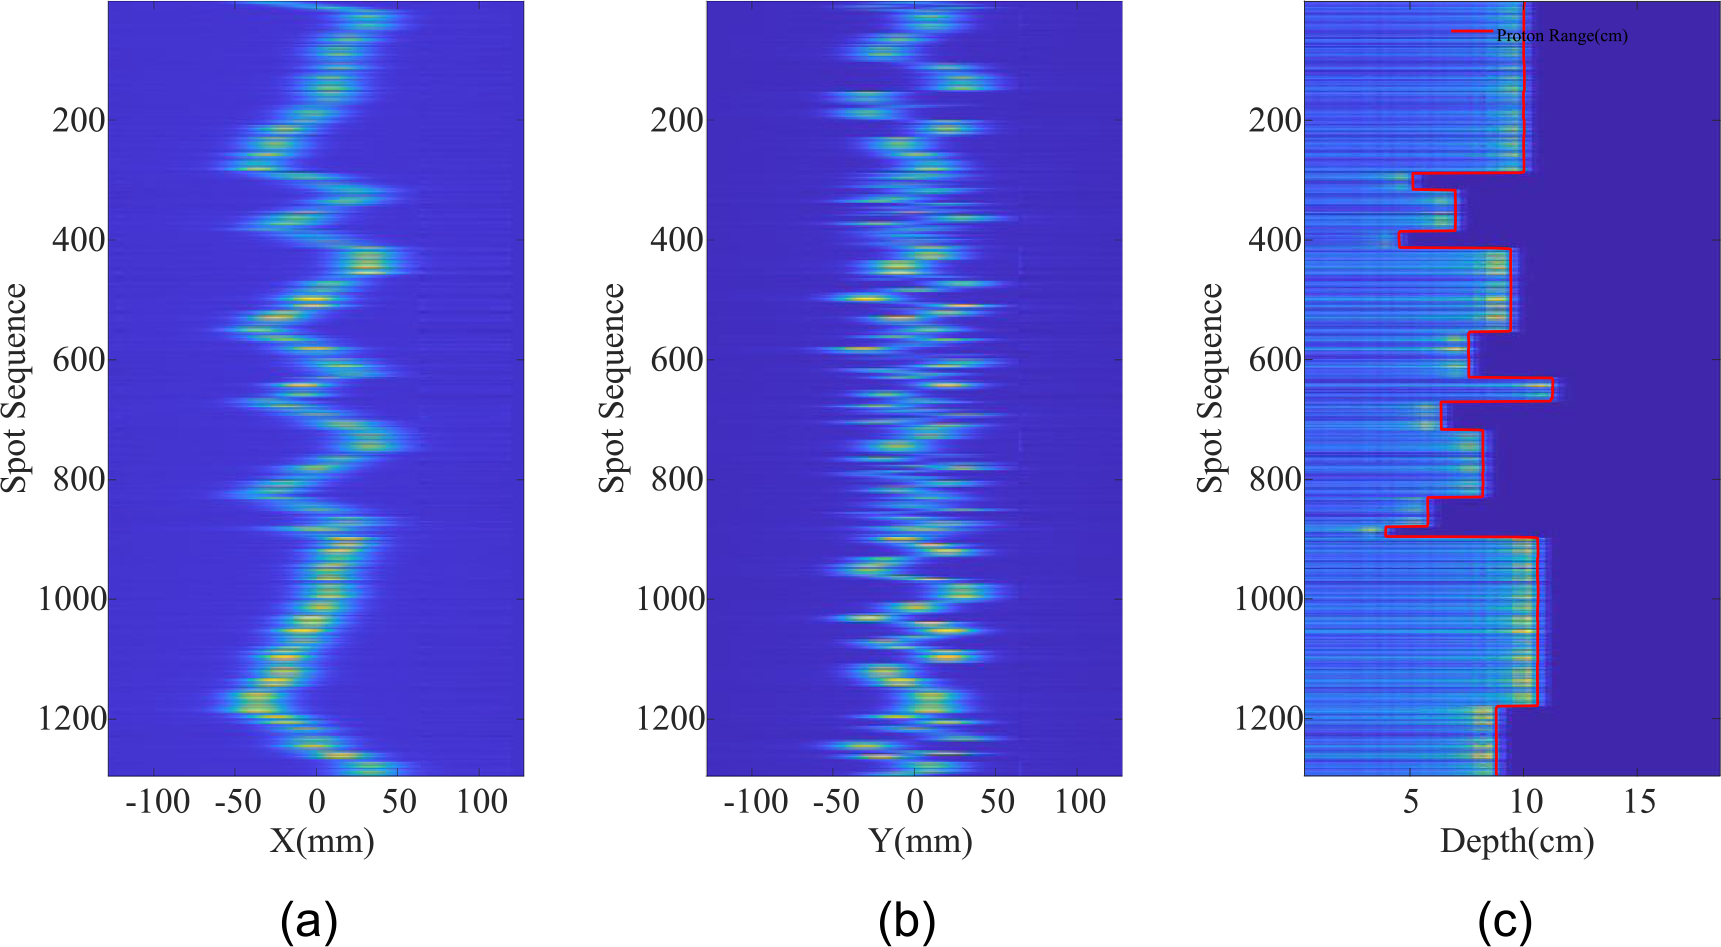
(a) and (b) the spot trajectories of the brain case on X and Y channels, respectively; (c) the nominal proton range measured by the MLSIC. The gaps between subsequent signals have been eliminated.
The position, dose, and energy of each spot were determined using the methods described previously and compared to the treatment plan as shown. The results are shown in figure 8. The spot weight (MU) was calculated as the area under the IDD curve and normalized to (0,1] for each energy layer. There were 13 energy layers and 354 beam spots in this treatment field; the first 8 layers are shown in figures 8(a)–(h). The Euclidean distance difference as well as the MU difference between the measurement and planned spot map were calculated. The error distributions were shown in figure 9, in which the relative MU was calculated by the area under the Bragg peak. The MLSIC device can measure the spot location precisely with sub-mm accuracy. The maximum difference between the measured spot location and treatment plan is less than 0.9 mm and the relative dose difference is less than 2.5% MU.
Figure 8.
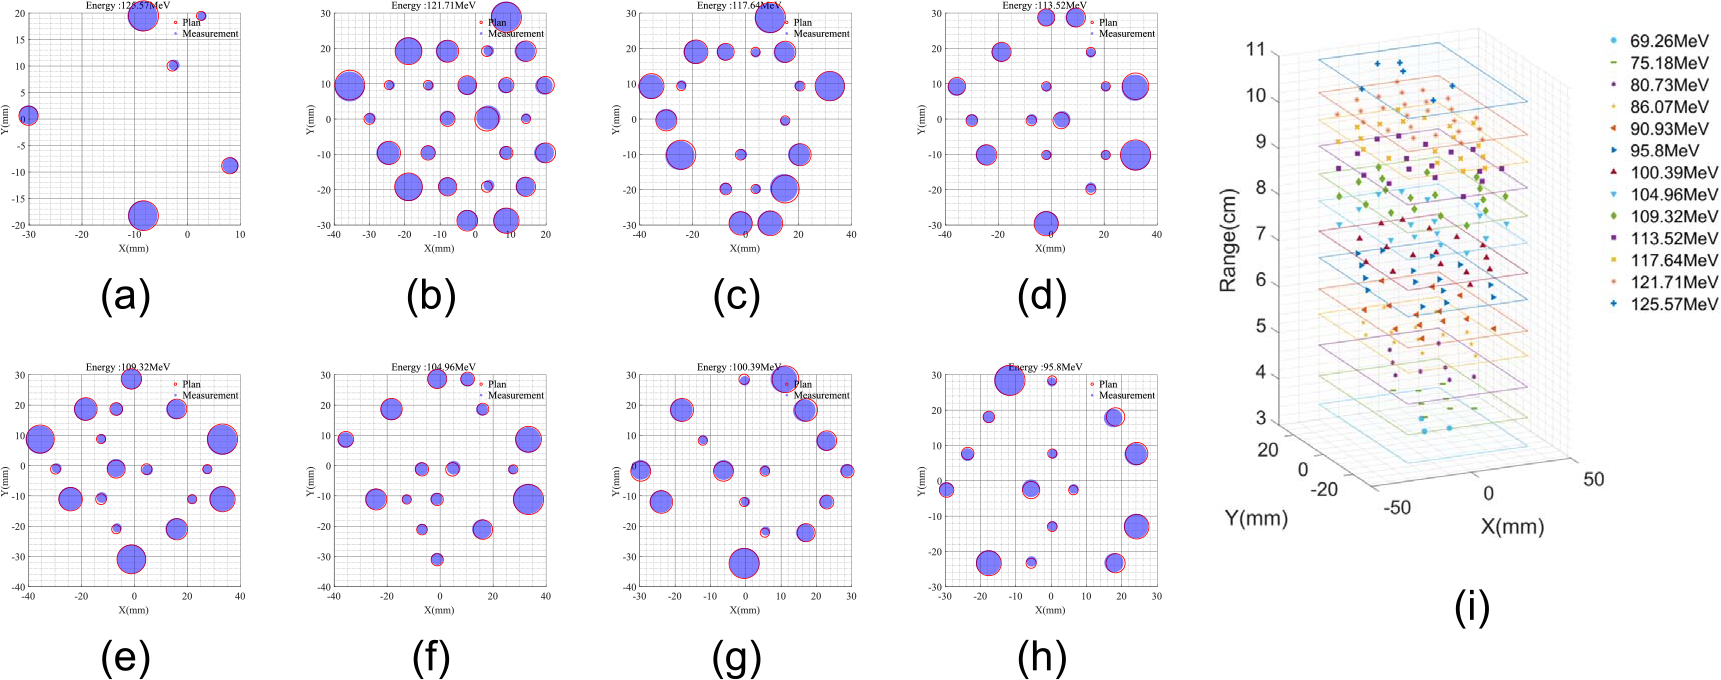
(a)–(h) Measurement of several selected energy layers and (i) all spot ranges and position information. Blue filled circles are measured spots and red circles are planned spots. Circle size denotes the relative dose in (0,1].
Figure 9.
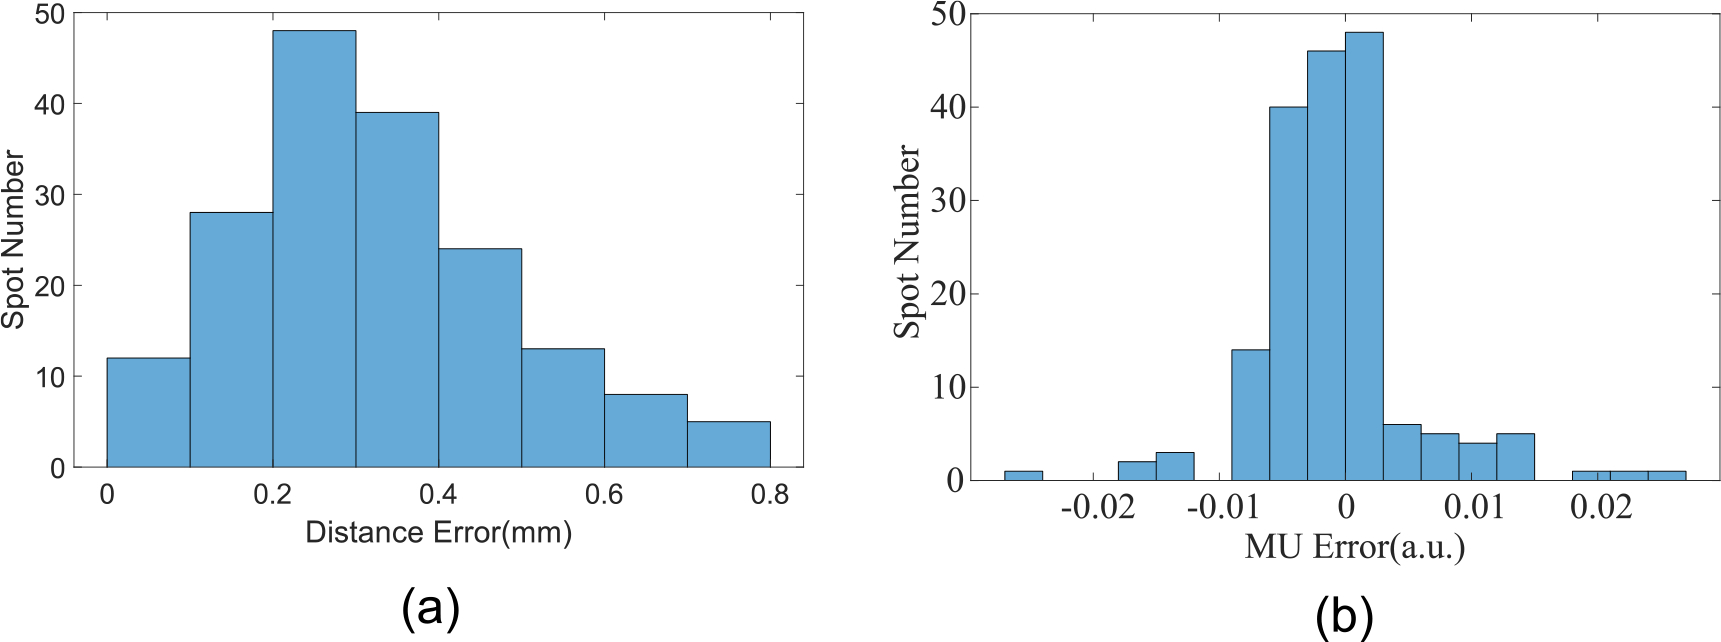
(a) Euclidean distance difference between measured and planned spots; (b) MU difference between measured and planned spots. The MU values were normalized to (0,1].
4. Discussion
The MLSIC is designed for both machine performance and patient treatment field QA. To our best knowledge, MLSIC is the first device that can measure the key dosimetric characteristics of proton treatment beams spot-by-spot. Although another commercial device (QUBEnext, DETECTOR-Devices & Technologies, Torino, Italy) claims to be able achieve similar function, no real measurement data have ever been reported and published. The MLSIC has a large sensitive area that allows the measurement of a field size as large as 25 cm × 25 cm. The MLSIC device has a sampling speed as high as 3.125 kHz, allowing fast moving spots to be discriminated.
To evaluate the dosimetric characteristics quantitatively, we compared the Euclidean distance and relative MU with the treatment plan. The maximum spot position difference was less than 0.9 mm and the MU difference was less than 2.5%. We developed two prototypes with 1.95 mm and 2.91 mm WET energy resolutions; with a total of 64 layers of Z-channels, the MLSIC has a maximum range of measurement about 12.5 cm or 18.6 cm, respectively. Based on the measurements, we believe that the 2.91 mm WET energy resolution is sufficient for clinical QA measurement.
For QA purposes, each Z-channel plate needs only one ADC channel principally. The noise level of the ADC is largely determined by input capacitance. Dividing the Z-channel plates as shown in figure 2(b) can reduce the detector capacitance by nearly 90%. Because the PBS beam only generates signals within a small area, the eight individual ADC channels would not interfere with each other if the spot were smaller than 1.6 cm. The information from strip chambers at different depths potentially can be used for reconstruction of 3D dose distribution or proton radiography.
In the current stage, the relative weights (MU) were verified within each energy layer. In the future, we can obtain the full IDD curve by fitting the raw data to an analytical model, i.e. Bortfeld function. Thus, measurement of absolute MU of the spots is possible, but it may be challenging for low energy beams as only a partial IDD curve can be obtained. This is especially true for Mevion’s HyperScan™ as its lowest energy is only 20 MeV, with a range less than 5 mm.
5. Conclusion
An MLSIC device has been developed and calibrated for efficient QA measurement of proton treatment beams. It comprises 768 total channels of strip ionization chambers that sample ionization current in x and y directions at different depths. The MLSIC device is capable of verification of full dosimetric characteristics of proton beams including spot position, range, and relative weight of PBS treatment field spot-by-spot.
Acknowledgments
This project in part was supported by The Foundation for Barnes-Jewish Hospital and their generous donors; and the Washington University Institute of Clinical and Translational Sciences which is, in part, supported by the NIH/National Center for Advancing Translational Sciences (NCATS), CTSA grant UL1 TR002345.
Footnotes
Ethical statement
No animal or human subject was involved in this research.
References
- Arjomandy B et al. 2019. AAPM task group 224: comprehensive proton therapy machine quality assurance Med. Phys. 46 6–8 [DOI] [PubMed] [Google Scholar]
- Arjomandy B, Sahoo N, Ding X and Gillin M 2008. Use of a two-dimensional ionization chamber array for proton therapy beam quality assurance Med. Phys. 35 3889–94 [DOI] [PubMed] [Google Scholar]
- Baumer C, Koska B, Lambert J, Timmermann B, Mertens T and Talla PT 2015. Evaluation of detectors for acquisition of pristine depth-dose curves in pencil beam scanning J. Appl. Clin. Med. Phys. 16 151–63 [DOI] [PMC free article] [PubMed] [Google Scholar]
- Besl PJ and McKay ND 1992. A method for registration of 3D shapes IEEE Trans. Pattern Anal. Mach. Intell. 14 239–56 [Google Scholar]
- Bizzocchi N, Fracchiolla F, Schwarz M and Algranati C 2017. A fast and reliable method for daily quality assurance in spot scanning proton therapy with a compact and inexpensive phantom Med. Dosim. 42 238–46 [DOI] [PubMed] [Google Scholar]
- Bortfeld T 1997. An analytical approximation of the Bragg curve for therapeutic proton beams Med. Phys. 24 2024–33 [DOI] [PubMed] [Google Scholar]
- Chan MF, Chen CC, Shi C, Li J, Tang X, Li X and Mah D 2017. Patient-specific QA of spot-scanning proton beams using radiochromic film Int. J. Med. Phys. Clin. Eng. Radiat. Oncol. 6 111–23 [DOI] [PMC free article] [PubMed] [Google Scholar]
- Chen Y and Medioni G 1992. Object modeling by registration of multiple range images Image and Vision Computing 10 145–55 [Google Scholar]
- Dhanesar S, Sahoo N, Kerr M, Taylor MB, Summers P, Zhu XR, Poenisch F and Gillin M 2013. Quality assurance of proton beams using a multilayer ionization chamber system Med. Phys. 40 092102. [DOI] [PubMed] [Google Scholar]
- Lin L, Kang M, Solberg TD, Mertens T, Baeumer C, Ainsley CG and McDonough JE 2015. Use of a novel two-dimensional ionization chamber array for pencil beam scanning proton therapy beam quality assurance J. Appl. Clin. Med. Phys. 16 5323. [DOI] [PMC free article] [PubMed] [Google Scholar]
- Mirandola A et al. 2018. Characterization of a multilayer ionization chamber prototype for fast verification of relative depth ionization curves and spread-out-Bragg-peaks in light ion beam therapy Med. Phys. 45 2266–77 [DOI] [PubMed] [Google Scholar]
- Muzik J, Soukup M and Alber M 2008. Comparison of fixed-beam IMRT, helical tomotherapy, and IMPT for selected cases Med. Phys. 35 1580–92 [DOI] [PubMed] [Google Scholar]
- Oelfke U and Bortfeld T 2003. Optimization of physical dose distributions with hadron beams: comparing photon IMRT with IMPT Technol. Cancer Res. Treat. 2 401–12 [DOI] [PubMed] [Google Scholar]
- Rana S and Samuel EJJ 2019. Feasibility study of utilizing XRV-124 scintillation detector for quality assurance of spot profile in pencil beam scanning proton therapy Phys. Med. 66 15–20 [DOI] [PubMed] [Google Scholar]
- Trnkova P, Bolsi A, Albertini F, Weber DC and Lomax AJ 2016. Factors influencing the performance of patient specific quality assurance for pencil beam scanning IMPT fields Med. Phys. 43 5998. [DOI] [PubMed] [Google Scholar]
- Vai A et al. 2019. Characterization of a MLIC detector for QA in scanned proton and carbon ion beams Int. J. Part. Ther. 6 50–9 [DOI] [PMC free article] [PubMed] [Google Scholar]
- Yajima K, Kanai T, Kusano Y and Shimojyu T 2009. Development of a multi-layer ionization chamber for heavy-ion radiotherapy Phys. Med. Biol. 54 N107–14 [DOI] [PubMed] [Google Scholar]


