Abstract
Background
The 2023 Obesity Fact Sheet aims to present an updated overview of obesity prevalence across all age groups, including children and adolescents.
Methods
This study included individuals aged ≥20 years (n=16,941,423 in 2021) who underwent health checkups provided by the Korean National Health Insurance Service between 2012 and 2021. The prevalence of obesity and abdominal obesity was standardized by age and sex using data from the 2010 population and housing census. For children and adolescents (6 to 18 years) (n=884 in 2021), we used the Korea National Health and Nutrition Examination Survey (2012 to 2021), and obesity was defined by the corresponding sex- and age-specific body mass index percentile of 95th or greater based on the 2017 Korean National Growth Chart for Children and Adolescents.
Results
The overall prevalence of obesity in 2021 is 38.4% (49.2% in men and 27.8% in women), which is a 1.27-fold increase from 30.2% in 2012. The prevalence of obesity has increased across all age groups, particularly among those aged 20, 30, and 80 years. The prevalence of class III obesity substantially increased from 0.35% (men) and 0.42% (women) in 2012 to 1.21% and 0.97% in 2021, with 3.46- and 2.31-fold increases, respectively. This increase was particularly pronounced in young adults. The prevalence of obesity in children and adolescents has surged from 9.7% in 2012 to 19.3% in 2021, with a greater increase among boys.
Conclusion
Our study provides information on the current status of obesity prevalence based on the 2023 Obesity Fact Sheet, emphasizing the urgency of implementing timely strategies to reverse this increasing trend.
Keywords: Obesity, Child, Adolescent, Young adult, Abdominal obesity, Obesity fact sheet
INTRODUCTION
Obesity, characterized by excessive fat accumulation, is attributed to significant morbidity and mortality ranging from major chronic diseases, including cardiovascular disease,1 type 2 diabetes mellitus,1 non-alcoholic fatty liver disease,2 several cancer types,1 and mental disorders,3 which may substantially impact an individual’s quality of life.4
The prevalence of overweight and obesity has increased worldwide over the past few decades. According to the World Obesity Atlas 2023, the estimated proportion of overweight and obesity (body mass index [BMI] ≥25 kg/m2) in 2020 among the global population aged >5 years was 38%, which is projected to 51% by 2035.5 In the United States (US), the obesity (BMI ≥30 kg/m2) prevalence increased from 30.5% in 1999–2000 to 41.9% in 2017–2020.6 By 2030, 48.9% of US adults may have obesity, with 24.2% falling into the category of severe obesity (BMI ≥35 kg/m2).7 Moreover, global disability-adjusted life years exhibited an annual increase of 0.48% from 2000 to 2019, indicating a worsening global burden.8 The 2021 Obesity Fact Sheet in Korea reported that steadily increased prevalence of obesity over past the past 11 years from 29.7% in 2009 to 36.3% in 2019.1 Along with increasing trend of obesity prevalence in adults, obesity among children and adolescents aged 2 to 19 years increased from 16.9% in 2011–2012 to 19.7% in 2017–2020, with a notable increase in children aged 2 to 5 years in the US.9 In Korea, the prevalence of obesity in children increased from 8.7% in 2007 to 15% in 2017 in those aged 6 to 18 years.10
Since 2015, the Korean Society for the Study of Obesity (KSSO) has published annual Obesity Fact Sheets based on the statistics provided by the Korean National Health Insurance Corporation. The Obesity Fact Sheets are intended to enhance awareness of obesity and its related comorbidities as well as to provide evidence for the development of national health policies on obesity. Thus, this study sought to update the recent trends in obesity prevalence in adults and children/adolescents in Korea based on the 2023 Obesity Fact Sheet.
METHODS
Data resources and study participants
In this study, the national health checkup database provided by the Korean National Health Insurance Service (NHIS) was analyzed to determine trends in the prevalence of obesity among adults. The NHIS provides universal health insurance coverage for 97% of the Korean population, except for 3% of Koreans in the lowest-income bracket, who are covered by medical aid. The NHIS offers a biennial national health checkup for all citizens aged ≥20 years. The national health checkup includes anthropometric measurements, laboratory tests, and self-questionnaires on lifestyle habits.11 To assess the trend in obesity prevalence among adults, we included individuals aged ≥20 years who underwent the national health checkup from 2012 to 2021 (n=16,941,423 in 2021). Korea National Health and Nutrition Examination Survey (KNHANES) data from 2012 to 2021 were used to assess the prevalence of obesity among children and adolescents aged 6 to 18 years. The KNHANES, conducted by the Korea Disease Control and Prevention Agency, represents non-institutionalized citizens in Korea through multistage and clustered probability design sampling.12 The study protocol was approved by the Institutional Review Board of Soongsil University (IRB no. SSU-202202-HR-455-1). Written informed consent by the patients was waived due to a retrospective nature of our study.
Definitions of obesity and abdominal obesity
To define obesity and abdominal obesity, BMI, and waist circumference (WC) were measured at the national health checkup (for adults) or those provided by the KNHANES (for children and adolescents). BMI was calculated as body weight in kilogram divided by the square of the height in meter. Obesity among adults was defined as those with a BMI of ≥25 kg/m2 according to the Asia-Pacific criteria of the World Health Organization guidelines.13 Obesity class was further classified into class I obesity: BMI 25.0 to 29.9 kg/m2; class II obesity: BMI 30.0 to 34.9 kg/m2; and class III obesity: BMI ≥35 kg/m2 according to the 2022 KSSO Obesity Guidelines for the Management of Obesity.14 Abdominal obesity was defined as those with a WC of ≥90 cm for men or ≥85 cm for women.15 For children and adolescents (n=884 in 2021), obesity was defined by corresponding sex- and age-specific BMI percentile of 95th or greater based on 2017 Korean National Growth Chart for Children and Adolescents.16 Abdominal obesity among children and adolescents was defined as those with sex- and age-specific WC percentile of 90th or greater based on the 2007 Korean National Growth Chart for Children and Adolescents.17
Statistical analysis
The prevalence of obesity and abdominal obesity from 2012 to 2021 was standardized by age and sex using data from the 2010 population and housing census from Statistics Korea. The prevalence of obesity and abdominal obesity was confirmed across the subgroups according to sex and age. Age groups were classified into seven categories: 20, 30, 40, 50, 60, 70, and 80 years. All statistical analyses were performed using SAS version 9.4 (SAS Institute Inc.).
RESULTS
Prevalence of obesity and abdominal obesity by sex and age among adults
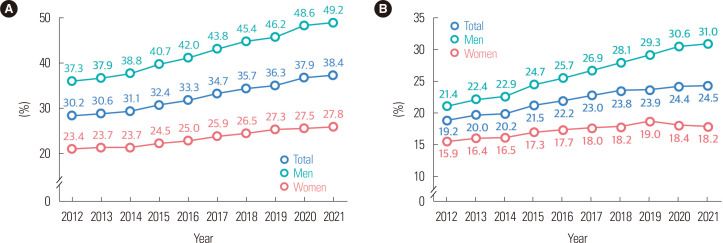
In 2021, the overall prevalence of obesity was 38.4%, a 1.27-fold increase from 30.2% in 2012 (Fig. 1A). The prevalence of obesity in men and women has continued to increase over the past decade, reaching 49.2% and 27.8% in 2021, respectively. The prevalence of obesity in men significantly increased by 1.32-fold compared to 1.19-fold in women from 2012 to 2021. Moreover, the overall prevalence of abdominal obesity has persistently increased over the past decade, reaching 19.2% in 2012, 23.0% in 2017, and 24.5% in 2021 (Fig. 1B). The increase in the prevalence of abdominal obesity is more prominent among men, with rates of 21.4% in 2012 and 31.0% in 2021. The prevalence of abdominal obesity in women gradually increased from 15.9% in 2012 to 18.2% in 2021.
Figure 1.
Prevalence of (A) obesity and (B) abdominal obesity from 2012 to 2021 in adults.
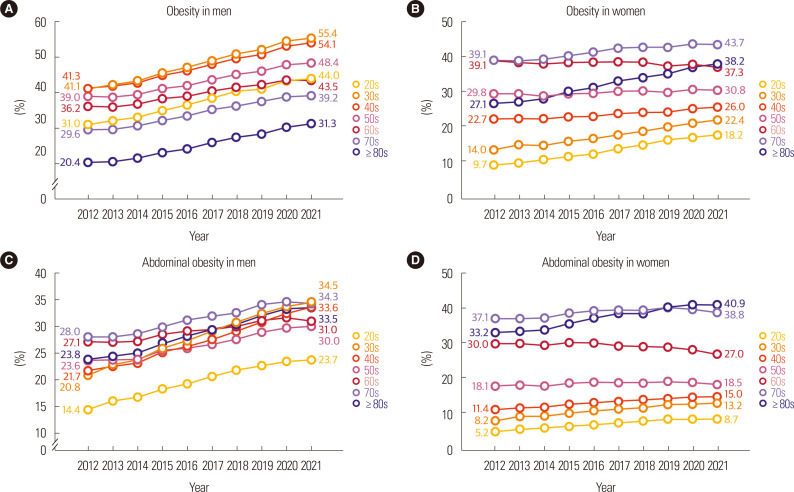
From 2012 to 2021, the prevalence of obesity increased across all age groups, particularly in those aged 20, 30, and ≥80 years. In 2021, the prevalence of obesity in the total population was 30.4%, 41.4%, 41.2%, 39.6%, 40.2%, 41.6%, and 35.2% among those in their 20s, 30s, 40s, 50s, 60s, 70s, and ≥80s, respectively. Among men, the obesity prevalence in 2021 was highest in those in their 30s (55.4%), followed by those in their 40s (54.1%) (Fig. 2A). The prevalence in men increased across all age groups, particularly in those in their 20s and 80s and older. Among women, the prevalence of obesity was the highest in those in their 70s (43.7%) in 2021 (Fig. 2B). The prevalence tended to increase in all age groups except for those in their 50s and 60s. Women in their 20s exhibited the greatest increase in the prevalence of obesity over the past decade, from 9.7% in 2012 to 18.2% in 2021.
Figure 2.
Age-specific prevalence of obesity and abdominal obesity in (A, C) men and (B, D) women from 2012 to 2021 in adults.
The overall prevalence of abdominal obesity increased across all age groups from 2012 to 2021, particularly among those in their 20s and 30s. In 2021, the prevalence of abdominal obesity in the total population was 15.8%, 25.5%, 25.1%, 24.3%, 28.9%, 36.7%, and 37.6% among those in their 20s, 30s, 40s, 50s, 60s, 70s, and 80s or older, respectively. The prevalence of abdominal obesity in men in their 30s was the highest in 2021 (34.5%) (Fig. 2C). The most significant increase was observed in men in their 20s and 30s, with more than a 1.6-fold increase from 14.4% and 20.8% in 2012 to 23.7% and 34.5% in 2021, respectively. Women in their 80s and older demonstrated the highest prevalence of abdominal obesity in 2021 (40.9%) (Fig. 2D). Similar to men, women in their 20s and 30s exhibited a substantial increase in abdominal obesity prevalence of more than 1.6-fold, increasing from 5.2% and 8.2% in 2012 to 8.7% and 13.2% in 2021, respectively.
Prevalence of obesity according to obesity class among adults
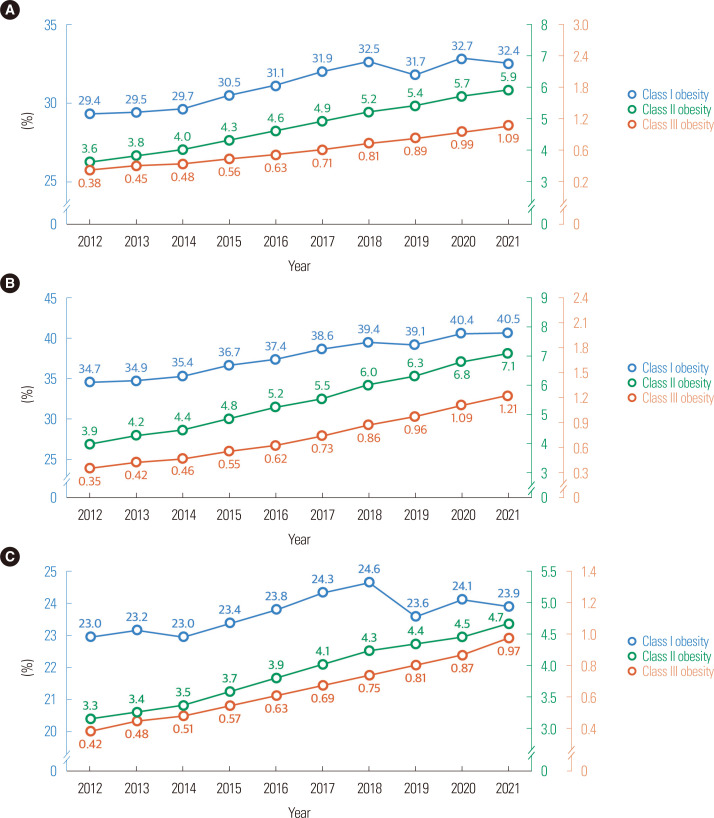
From 2012 to 2021, the prevalence of obesity increased across all obesity classes, especially class II and class III obesity with 1.64- and 2.86-fold increases, respectively (Fig. 3A). In 2021, the prevalence of class I, II, and III obesity was 32.4%, 5.9%, and 1.09%, respectively. In particular, the prevalence of class III obesity increased by 3.5-fold from 0.35% in 2012 to 1.21% in 2021 among men (Fig. 3B); and by 2.31-fold from 0.42% in 2012 to 0.97% in 2021 among women (Fig. 3C).
Figure 3.
Prevalence of obesity by obesity class in the (A) total population, (B) men, and (C) women from 2012 to 2021 in adults.
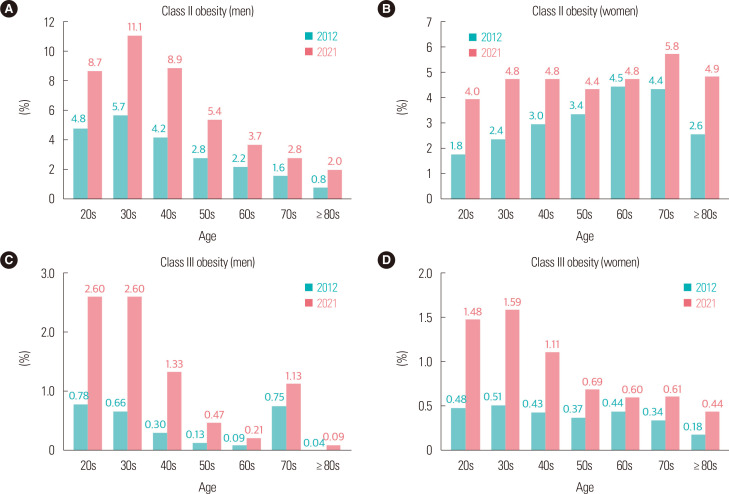
Regarding age groups, the prevalence of class II obesity in 2021 was highest in men in their 30s (11.1%) and women in their 70s (5.8%) (Fig. 4A and B). The prevalence of class III obesity was highest in men in their 20s (2.6%) and 30s (2.6%) and in women in their 30s (1.59%) (Fig. 4C and D). Among those in their 30s, the prevalence of class III obesity increased by 3.94-fold from 0.66% in 2012 to 2.6% in 2021 among men, and by 3.12-fold from 0.51% in 2012 to 1.59% in 2021 among women.
Figure 4.
Prevalence of class (A, B) II and (C, D) III obesity in men and women in 2012 and 2021 in adults.
Prevalence of obesity and abdominal obesity among children and adolescents
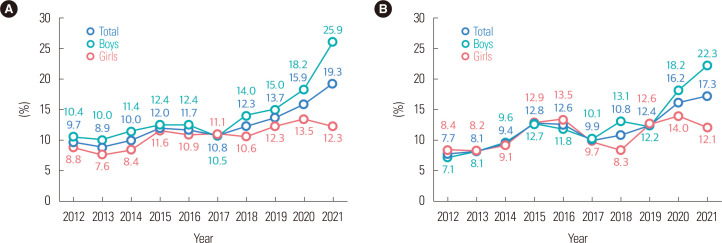
The prevalence of obesity in children and adolescents substantially increased from 9.7% in 2012 to 19.3% in 2021 (Fig. 5A). During the coronavirus disease 2019 (COVID-19) pandemic period of 2020 to 2021, the prevalence of obesity sharply increased from 13.7% in 2019. Over the past decade, the prevalence of obesity has consistently been higher in boys than in girls. In 2021, the prevalence of obesity in boys significantly increased to 25.9%, whereas in girls, it decreased from 13.5% in 2020 to 12.3%. The prevalence of abdominal obesity in children and adolescents also significantly increased from 7.7% in 2012 to 17.3% in 2021, with a more pronounced increase observed in boys, from 7.1% in 2012 to 22.3% in 2021 (Fig. 5B).
Figure 5.
Prevalence of (A) obesity and (B) abdominal obesity in children and adolescents from 2012 to 2021.
DISCUSSION
According to the 2023 Obesity Fact Sheet, the overall prevalence of obesity has continued to increase over the past decade, increasing from 30.2% in 2012 to 38.4% in 2021 by 1.27-fold. The overall prevalence of abdominal obesity also has increased from 19.2% in 2012 to 24.5% in 2021. The prevalence of obesity in men and women has continued to increase over the past decade, reaching 49.2% and 27.8%, respectively, in 2021. The increase in obesity prevalence was greater in men than women and in young-aged (20s and 30s) or elderly (≥80 years old) individuals than middle-aged individuals. The prevalences of class I, II, and III obesity were 32.4%, 5.9%, and 1.09%, respectively, in 2021, and the prevalence of class III obesity increased by 2.86-fold between 2012 and 2021. The prevalence of class III obesity has sharply increased in both men and women, particularly in those in their 30s. The prevalence of obesity in children and adolescents has increased substantially from 9.7% in 2012 to 19.3% in 2021, with the greatest increase among boys.
Trends in the global prevalence of obesity (BMI ≥30 kg/m2) among adults have consistently increased from 4.6% in 1980 to 14.0% in 2019.18 This obesity prevalence varies by geographical region and country, with the highest prevalence observed in the Americas and the lowest in the West Pacific region. Despite regional variations, the prevalence of obesity has increased globally. In the US, approximately 41.9% of adults had obesity in 2017, reflecting an upward trend in obesity prevalence from 20.5% in 1999 to 2000.19 The prevalence of severe obesity (BMI ≥40 kg/m2) was 9.2% in 2017 to 2018, which increased from 4.7% in 1999 to 2000. No significant difference in the prevalence of obesity was observed between men (43.0%) and women (41.9%); however, the prevalence of severe obesity was higher in women (11.5%) than in men (6.9%). The prevalence of severe obesity was highest among adults aged 40 to 59 years (11.5%), followed by adults aged 20 to 39 years (9.1%).
A recent meta-analysis including 259 articles has reported a persistent increase in the prevalence of abdominal obesity from 31.3% in 1985–1999 to 48.3% in 2010–2014.20 In the US, both women and men had a significant increase in the prevalence of abdominal obesity, rising from 57.6 to 67.3% in women and from 39.1 to 49.7% in men during 2001–2018.21 In Korea, as indicated by the 2023 Obesity Fact Sheet, the prevalence of abdominal obesity has increased over the past decade, with a greater increase in men and young adults aged in their 20s and 30s. In contrast to the higher prevalence of obesity and abdominal obesity among men in their 30s, women in their 70s and 80s had the highest prevalence of obesity and abdominal obesity according to the 2023 Obesity Fact Sheet. This disparity between sexes, particularly the notable prevalence in older women, may be attributed to physiological changes associated with menopause in women. During menopausal transition, 60% to 70% of women experience weight gain, changes in body composition, and shifts in fat distribution, primarily due to hormonal changes.22
The 2023 Obesity Fact Sheet highlights a remarkable increase in the prevalence of class II and III obesity, particularly among young adults aged 20 to 39 years. The risk of mortality and comorbidities such as type 2 diabetes mellitus, hypertension, cardiovascular diseases has been well documented, and several types of cancer escalate with the severity of obesity.23 Compared to individuals with normal weight, those with obesity experience higher all-cause and coronary heart disease mortality, demonstrating a dose-dependent relationship with the severity of obesity.23 Furthermore, having severe obesity from young adulthood can easily lead to obesity in later adulthood, thereby extending the duration of susceptibility to obesity-related comorbidities.24 Young adults may gain weight more rapidly than any other age group, partly because of lifestyle transitions such as starting a new family, changes in food intake, and reduced physical activity. Millennials born in the mid-1980s and early 2000s had a significantly higher incidence of obesity than their previous generation.25 Problematic smartphone use was relatively higher in millennials than in other age groups, which is related to a highly sedentary lifestyle.26 Increased Internet and computer use during leisure or at work may also contribute to obesity.27 Additionally, young adults are less likely to prioritize their healthcare needs, often focusing on other achievements in their lives, making receiving proper management more challenging. Therefore, health policies aimed at reducing the burden of obesity and related comorbidities would be effective with targeted interventions for young adults.28
The prevalence of childhood and adolescent obesity varies depending on the economic status of each country. It has plateaued in high-income countries, and continued to increase in low-middle income countries.29 Childhood obesity is one of the most important public health issues because it can be linked to lifelong obesity, contributing to adverse health outcomes throughout the life course.30 A previous epidemiological study in Korea based on data from KNHANES has reported a 9.8% prevalence of child and adolescent obesity (2–18 years) in 2017, with a higher prevalence in boys and high school students.10 This previous study applied the 2007 Korean National Growth Chart for Children and Adolescents, which might have underestimated the prevalence of obesity compared to using the 2017 updated version.31 A national report from the National School Health Examination has also indicated a 5.7% increase in prevalence of obesity from 11.6% in 2007 to 17.7% in 2017 among the school-age population.32 The Korean Youth Health Risk Behavior On-line Survey revealed an increasing trend in unhealthy food consumption (e.g., instant noodles, sugar-sweetened beverages, and fast food) and a decreasing trend in healthy food consumption (e.g., mild, fruit, and vegetables).32 Moreover, breakfast skipping for ≥5 days per week tended to increase reaching at 32.0% among high school students.32 The amount of daily sedentary time for studying and resting has steadily increased.32 According to the 2023 Obesity Fact Sheet in this study, a sharp increase in the prevalence of obesity during the COVID-19 pandemic period was noted, particularly in boys, rising from 15.0% in 2019 to 25.9% in 2021. This increase was closely related to physical inactivity owing to school closures and social distancing.33
This study has several limitations and strengths. Although we included the entire Korean population who voluntarily underwent national health checkups, those who participated in these checkups might be more actively engaged in healthy lifestyles. In addition, before 2019, when the national health checkup was expanded to include all individuals in their 20s and 30s, it was available only to insured employees and self-employed beneficiaries. However, using a large-scale nationwide database, our study investigated the prevalence of obesity across all age groups and sexes, providing new insights and suggesting appropriate policies and individualized interventions to address the increasing trend in obesity prevalence.
In conclusion, the 2023 Obesity Fact Sheet reveals a persistent increase in the prevalence of obesity across all age groups, including children and adolescents. The prevalence of class II and III obesity has increased dramatically over the past decade, particularly in young adults. Our study provides information on the current prevalence of obesity and emphasizes the need for timely strategies to reverse this increasing trend.
ACKNOWLEDGMENTS
This study was partially supported by the Korean Society for the Study of Obesity. We thank the National Health Insurance Service and the Korean Society for the Study of Obesity for their support.
Footnotes
CONFLICTS OF INTEREST
Ga Eun Nam is an associate editor of the journal, but she was not involved in the peer reviewer selection, evaluation, or decision process of this article. No other potential conflicts.
AUTHOR CONTRIBUTIONS
Study concept and design: SMJ, JHJ, GEN, and KH; acquisition of data: JHJ and KH; analysis and interpretation of data: all authors; drafting of the manuscript: SMJ, JHJ, GEN, and KH; critical revision of the manuscript: all authors; statistical analysis: JHJ and KH; and study supervision: KH.
REFERENCES
- 1.Yang YS, Han BD, Han K, Jung JH, Son JW Taskforce Team of the Obesity Fact Sheet of the Korean Society for the Study of Obesity, author. Obesity fact sheet in Korea, 2021: trends in obesity prevalence and obesity-related comorbidity incidence stratified by age from 2009 to 2019. J Obes Metab Syndr. 2022;31:169–77. doi: 10.7570/jomes22024. [DOI] [PMC free article] [PubMed] [Google Scholar]
- 2.Huh Y, Cho YJ, Nam GE. Recent epidemiology and risk factors of nonalcoholic fatty liver disease. J Obes Metab Syndr. 2022;31:17–27. doi: 10.7570/jomes22021. [DOI] [PMC free article] [PubMed] [Google Scholar]
- 3.Luppino FS, de Wit LM, Bouvy PF, Stijnen T, Cuijpers P, Penninx BW, et al. Overweight, obesity, and depression: a systematic review and meta-analysis of longitudinal studies. Arch Gen Psychiatry. 2010;67:220–9. doi: 10.1001/archgenpsychiatry.2010.2. [DOI] [PubMed] [Google Scholar]
- 4.Stephenson J, Smith CM, Kearns B, Haywood A, Bissell P. The association between obesity and quality of life: a retrospective analysis of a large-scale population-based cohort study. BMC Public Health. 2021;21:1990. doi: 10.1186/s12889-021-12009-8. [DOI] [PMC free article] [PubMed] [Google Scholar]
- 5.Lobstein T, Jackson-Leach R, Powis J, Brinsden H, Gray M. World Obesity Atlas 2023 [Internet] World Obesity Federation; 2023. [cited 2024 Mar 26]. Available from: https://www.worldobesity.org/resources/resource-library/world-obesity-atlas-2023 . [Google Scholar]
- 6.Stierman B, Afful J, Carroll MD, Chen TC, Davy O, Fink S, et al. National Health and Nutrition Examination Survey 2017-March 2020 prepandemic data files: development of files and prevalence estimates for selected health outcomes. Natl Health Stat Report. 2021;158:1–20. doi: 10.15620/cdc:106273. [DOI] [PMC free article] [PubMed] [Google Scholar]
- 7.Ward ZJ, Bleich SN, Cradock AL, Barrett JL, Giles CM, Flax C, et al. Projected U.S. state-level prevalence of adult obesity and severe obesity. N Engl J Med. 2019;381:2440–50. doi: 10.1056/NEJMsa1909301. [DOI] [PubMed] [Google Scholar]
- 8.Chong B, Jayabaskaran J, Kong G, Chan YH, Chin YH, Goh R, et al. Trends and predictions of malnutrition and obesity in 204 countries and territories: an analysis of the Global Burden of Disease Study 2019. EClinicalMedicine. 2023;57:101850. doi: 10.1016/j.eclinm.2023.101850. [DOI] [PMC free article] [PubMed] [Google Scholar]
- 9.Hu K, Staiano AE. Trends in obesity prevalence among children and adolescents aged 2 to 19 years in the US from 2011 to 2020. JAMA Pediatr. 2022;176:1037–9. doi: 10.1001/jamapediatrics.2022.2052. [DOI] [PMC free article] [PubMed] [Google Scholar]
- 10.Kim JH, Moon JS. Secular trends in pediatric overweight and obesity in Korea. J Obes Metab Syndr. 2020;29:12–7. doi: 10.7570/jomes20002. [DOI] [PMC free article] [PubMed] [Google Scholar]
- 11.Seong SC, Kim YY, Khang YH, Park JH, Kang HJ, Lee H, et al. Data resource profile: the National Health Information Database of the National Health Insurance Service in South Korea. Int J Epidemiol. 2017;46:799–800. doi: 10.1093/ije/dyw253. [DOI] [PMC free article] [PubMed] [Google Scholar]
- 12.Kweon S, Kim Y, Jang MJ, Kim Y, Kim K, Choi S, et al. Data resource profile: the Korea National Health and Nutrition Examination Survey (KNHANES) Int J Epidemiol. 2014;43:69–77. doi: 10.1093/ije/dyt228. [DOI] [PMC free article] [PubMed] [Google Scholar]
- 13.World Health Organization, author. The Asia-Pacific perspective: redefining obesity and its treatment. WHO; 2000. [Google Scholar]
- 14.Haam JH, Kim BT, Kim EM, Kwon H, Kang JH, Park JH, et al. Diagnosis of obesity: 2022 update of clinical practice guidelines for obesity by the Korean Society for the Study of Obesity. J Obes Metab Syndr. 2023;32:121–9. doi: 10.7570/jomes23031. [DOI] [PMC free article] [PubMed] [Google Scholar]
- 15.Lee SY, Park HS, Kim DJ, Han JH, Kim SM, Cho GJ, et al. Appropriate waist circumference cutoff points for central obesity in Korean adults. Diabetes Res Clin Pract. 2007;75:72–80. doi: 10.1016/j.diabres.2006.04.013. [DOI] [PubMed] [Google Scholar]
- 16.Kim KK, Haam JH, Kim BT, Kim EM, Park JH, Rhee SY, et al. Evaluation and treatment of obesity and its comorbidities: 2022 update of clinical practice guidelines for obesity by the Korean Society for the Study of Obesity. J Obes Metab Syndr. 2023;32:1–24. doi: 10.7570/jomes23016. [DOI] [PMC free article] [PubMed] [Google Scholar]
- 17.Lee J, Kang SC, Kwon O, Hwang SS, Moon JS, Chae HW, et al. Temporal trends of the prevalence of abdominal obesity and metabolic syndrome in Korean children and adolescents between 2007 and 2020. J Obes Metab Syndr. 2023;32:170–8. doi: 10.7570/jomes22059. [DOI] [PMC free article] [PubMed] [Google Scholar]
- 18.Boutari C, Mantzoros CS. A 2022 update on the epidemiology of obesity and a call to action: as its twin COVID-19 pandemic appears to be receding, the obesity and dysmetabolism pandemic continues to rage on. Metabolism. 2022;133:155217. doi: 10.1016/j.metabol.2022.155217. [DOI] [PMC free article] [PubMed] [Google Scholar]
- 19.Hales CM, Carroll MD, Fryar CD, Ogden CL. Prevalence of obesity and severe obesity among adults: United States, 2017-2018. NCHS Data Brief. 2020;360:1–8. [PubMed] [Google Scholar]
- 20.Wong MC, Huang J, Wang J, Chan PS, Lok V, Chen X, et al. Global, regional and time-trend prevalence of central obesity: a systematic review and meta-analysis of 13.2 million subjects. Eur J Epidemiol. 2020;35:673–83. doi: 10.1007/s10654-020-00650-3. [DOI] [PMC free article] [PubMed] [Google Scholar]
- 21.Sun JY, Huang WJ, Hua Y, Qu Q, Cheng C, Liu HL, et al. Trends in general and abdominal obesity in US adults: evidence from the National Health and Nutrition Examination Survey (2001-2018) Front Public Health. 2022;10:925293. doi: 10.3389/fpubh.2022.925293. [DOI] [PMC free article] [PubMed] [Google Scholar]
- 22.Kodoth V, Scaccia S, Aggarwal B. Adverse changes in body composition during the menopausal transition and relation to cardiovascular risk: a contemporary review. Womens Health Rep (New Rochelle) 2022;3:573–81. doi: 10.1089/whr.2021.0119. [DOI] [PMC free article] [PubMed] [Google Scholar]
- 23.Hensrud DD, Klein S. Extreme obesity: a new medical crisis in the United States. Mayo Clin Proc. 2006;81(10 Suppl):S5–10. doi: 10.1016/S0025-6196(11)61175-0. [DOI] [PubMed] [Google Scholar]
- 24.Cheng HL, Medlow S, Steinbeck K. The health consequences of obesity in young adulthood. Curr Obes Rep. 2016;5:30–7. doi: 10.1007/s13679-016-0190-2. [DOI] [PubMed] [Google Scholar]
- 25.Martinson ML, Lapham J, Ercin-Swearinger H, Teitler JO, Reichman NE. Generational shifts in young adult cardiovascular health?: millennials and generation X in the United States and England. J Gerontol B Psychol Sci Soc Sci. 2022;77(Suppl 2):S177–88. doi: 10.1093/geronb/gbac036. [DOI] [PMC free article] [PubMed] [Google Scholar]
- 26.Jeong A, Ryu S, Kim S, Park HK, Hwang HS, Park KY. Association between problematic smartphone use and physical activity among adolescents: a path analysis based on the 2020 Korea Youth Risk Behavior Web-Based Survey. Korean J Fam Med. 2023;44:268–73. doi: 10.4082/kjfm.22.0154. [DOI] [PMC free article] [PubMed] [Google Scholar]
- 27.Vandelanotte C, Sugiyama T, Gardiner P, Owen N. Associations of leisure-time internet and computer use with overweight and obesity, physical activity and sedentary behaviors: cross-sectional study. J Med Internet Res. 2009;11:e28. doi: 10.2196/jmir.1084. [DOI] [PMC free article] [PubMed] [Google Scholar]
- 28.Willmott TJ, Pang B, Rundle-Thiele S, Badejo A. Weight management in young adults: systematic review of electronic health intervention components and outcomes. J Med Internet Res. 2019;21:e10265. doi: 10.2196/10265. [DOI] [PMC free article] [PubMed] [Google Scholar]
- 29.NCD Risk Factor Collaboration (NCD-RisC), author Worldwide trends in body-mass index, underweight, overweight, and obesity from 1975 to 2016: a pooled analysis of 2416 population-based measurement studies in 128·9 million children, adolescents, and adults. Lancet. 2017;390:2627–42. doi: 10.1016/S0140-6736(17)32129-3. [DOI] [PMC free article] [PubMed] [Google Scholar]
- 30.Rundle AG, Factor-Litvak P, Suglia SF, Susser ES, Kezios KL, Lovasi GS, et al. Tracking of obesity in childhood into adulthood: effects on body mass index and fat mass index at age 50. Child Obes. 2020;16:226–33. doi: 10.1089/chi.2019.0185. [DOI] [PMC free article] [PubMed] [Google Scholar]
- 31.Kim JH, Yun S, Hwang SS, Shim JO, Chae HW, Lee YJ, et al. The 2017 Korean National Growth Charts for children and adolescents: development, improvement, and prospects. Korean J Pediatr. 2018;61:135–49. doi: 10.3345/kjp.2018.61.5.135. [DOI] [PMC free article] [PubMed] [Google Scholar]
- 32.Oh YM, Cho AR, Lee DH. Obesity fact sheet 2013-2017. Korea Health Promotion Institute; 2018. [Google Scholar]
- 33.Kang HM, Jeong DC, Suh BK, Ahn MB. The impact of the coronavirus disease-2019 pandemic on childhood obesity and vitamin D status. J Korean Med Sci. 2021;36:e21. doi: 10.3346/jkms.2021.36.e21. [DOI] [PMC free article] [PubMed] [Google Scholar]


