

Visual Abstract

Keywords: ANCA, GN, kidney, kidney disease, lymphocytes, vasculitis, glomerular diseases
Abstract
Significance Statement
Early identification of patients at risk of renal flares in ANCA vasculitis is crucial. However, current clinical parameters have limitations in predicting renal relapse accurately. This study investigated the use of urinary CD4+ T lymphocytes as a predictive biomarker for renal flares in ANCA vasculitis. This study, including urine samples from 102 patients, found that the presence of urinary CD4+ T cells was a robust predictor of renal relapse within a 6-month time frame, with a sensitivity of 60% and a specificity of 97.8%. The diagnostic accuracy of urinary CD4+ T cells exceeded that of ANCA titers, proteinuria, and hematuria. Monitoring urinary CD4+ T lymphocytes could help assess the risk of future renal relapse, enabling early preventive measures and tailored treatment strategies.
Background
In ANCA-associated vasculitis, there is a lack of biomarkers for predicting renal relapse. Urinary T cells have been shown to differentiate active GN from remission in ANCA-associated vasculitis, but their predictive value for renal flares remains unknown.
Methods
The PRE-FLARED study was a prospective multicenter biomarker study including 102 individuals with ANCA-associated vasculitis in remission aimed to predict renal relapse by quantifying urinary CD4+ T-cell subsets using flow cytometry at baseline and monitoring clinical outcomes over a 6-month follow-up.
Results
Among the participants, ten experienced renal relapses, two had non–renal flares, and 90 remained in stable remission. The median baseline urinary CD4+ T-cell count was significantly higher in patients who relapsed compared with those in remission. Receiver operating characteristic curve analysis of urinary CD4+ T-cell counts showed an area under the curve value of 0.88 for predicting renal flares, outperforming ANCA titers, hematuria, and proteinuria. Using a cutoff of 490 CD4+ T cells per 100 ml urine, the sensitivity and specificity in identifying patients with future renal flares were 60% and 97.8%, respectively. In a post hoc analysis, combining urinary CD4+ T-cell counts with proteinase-3 ANCA levels suggested improved predictive performance in the PR3+ subgroup. In addition, the number of urinary CD4+ T cells showed a limited correlation with a decline in GFR and an increase in proteinuria over the follow-up period.
Conclusions
This study concluded that urinary CD4+ T-cell counts could identify patients with ANCA-associated vasculitis at a substantial risk of renal relapse within 6 months. Combining these counts with ANCA levels further improved the prediction of relapse.
Clinical Trial registry name and registration number:
Urinary T Lymphocytes Predict Renal Flares in Patients With Inactive ANCA-associated Glomerulonephritis (PRE-FLARED), NCT04428398.
Introduction
ANCA-associated vasculitis is an autoimmune disease characterized by small- to medium-sized blood vessel damage, leading to inflammation and organ injury. Clinical manifestations of ANCA-associated vasculitis include systemic symptoms such as fever, rash, weight loss, and specific organ involvement, most commonly in the upper airway, pulmonary, and renal system.1–4 GN in ANCA-associated vasculitis occurs in approximately 50%–80% of patients within the first 2 years of disease onset and is a major cause of kidney failure.5–7 Early renal findings include hematuria, acanthocytes in urine, elevated serum creatinine, and proteinuria, with kidney biopsy and histopathology being the gold standard for detection and classification of kidney involvement.8–10
A significant challenge in the management of ANCA-associated vasculitis is the recurrence of active vasculitis after achieving remission, which occurs in approximately 30%–50% of patients with ANCA-associated vasculitis over 5 years.11 In a recent study of 166 patients with ANCA-associated vasculitis followed-up for a median time of 4 years, the incidence of renal relapse was approximately 42%.12 Other studies estimate relapse rates ranging from 4% at year 1 to 37% at 5 years.13 Currently, there are no standardized blood or urine tests, including ANCA titers, serum creatinine, albuminuria, or erythrocyturia, that have been shown to reliably predict renal relapse.13–16 Previous studies suggest that a rise in ANCA titers may be associated with worsening kidney function but lacks specificity.11,12,17–21 Repeated kidney biopsies are not recommended for standard monitoring because of their invasive nature and associated risks. Therefore, accurate prediction of renal relapse remains a crucial diagnostic challenge in ANCA-associated vasculitis.16 Early identification of renal relapse is vital for prompt initiation of immunosuppressive therapy, which can prevent or delay the progression of CKD and progression to kidney failure.14,22
Urinary T lymphocytes have been reported to reliably distinguish active renal involvement from stable remission and active ANCA-associated vasculitis without kidney involvement in previous studies.23,24 However, it remains uncertain whether urinary CD4+ T cells have the potential to predict future renal outcomes among patients in stable remission. Given the strong association between inflammation and the pathogenesis of kidney damage in ANCA-associated vasculitis, we hypothesized that urinary CD4+ T-lymphocyte count could serve as a novel noninvasive biomarker to predict renal flares in patients with ANCA-associated vasculitis in remission. Here, we report the results of our prospective multicenter PRE-FLARED biomarker study evaluating the potential role of urinary T cells for renal flare prediction in ANCA-associated vasculitis.
Methods
Study Design and Patients
The primary objective of this multicenter study was to assess the predictive value of urinary CD4+ T-cell counts for the development of renal flares over a 6-month period in patients with ANCA-associated vasculitis who were in remission. This study included 112 patients with ANCA-associated vasculitis in remission who were followed at three clinics in two tertiary care centers in Berlin, Germany, between May 2020 and September 2021. Ten patients were excluded on the basis of predefined criteria, resulting in a total cohort of 102 patients for the final analysis (Figure 1).
Figure 1.
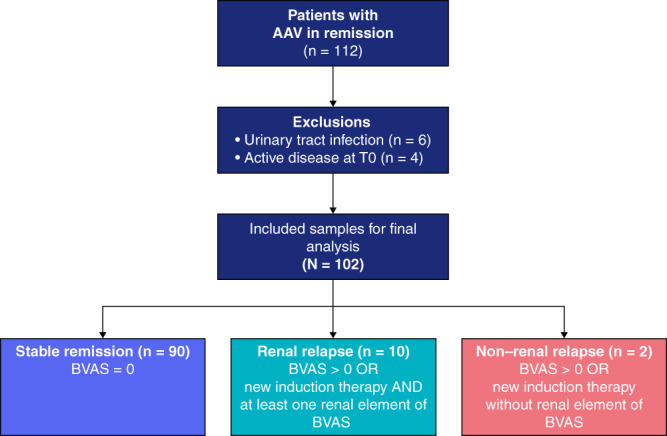
PRE-FLARED study population. A total of 102 patients with AAV in remission were included in this study. After 6-month follow-up, patients were grouped into stable remission, renal relapse, or non–renal relapse. AAV, ANCA-associated vasculitis; BVAS, Birmingham Vasculitis Activity Score.
Renal relapse was defined as a Birmingham Vasculitis Activity Score (BVAS V3) of ≥1 point or newly started induction therapy, including steroids and cyclophosphamide or rituximab in addition to the presence of at least one renal element of the BVAS score.25 These included proteinuria >1+ on urinalysis or >0.2 g/24 hours, moderate hematuria (defined as 2+ positive on dipstick urine analysis), or ≥10 red blood cell per high power field, usually accompanied by red cell casts or >30% rise in creatinine or >25% fall in creatinine clearance, excluding hypertension alone. The BVAS items listed above were scored only in case of worsening or new onset of the respective item, all attributable to active vasculitis, during follow-up. Worsened proteinuria or hematuria was defined as an increase of at least 1+ in urine dipstick analysis. Patients with persistent proteinuria or hematuria more than 3 months before study inclusion were not scored as renal relapse but considered as persistent signs of kidney damage according to the BVAS manual and glossary.25
To account for the potential imprecision of the BVAS to detect renal relapses, all flares identified on the basis of the predefined criteria (BVAS ≥1 or new induction therapy) were additionally assessed by four clinicians blinded to the identity of the patient and the amount of urinary T cells. Patients who were classified as flare by at least three of the four clinicians were regarded as clinical flare.
Remission was defined as BVAS=0 independent of prednisone. Inclusion criteria were patients with a clinical diagnosis of ANCA-associated vasculitis (Chapel-Hill consensus definition) in remission (BVAS=0) for at least 3 months who were age 18 years or older. Patients with persistent proteinuria or hematuria more than 3 months before study inclusion were categorized as inactive according to the BVAS V3 definition and, therefore, also included.26–28 Exclusion criteria were concurrent urinary tract infection, active menstrual bleeding, or active renal inflammation (BVAS>0). In the study's preregistration, treatment with rituximab was defined as exclusion criteria. However, on closer examination, we recognized that this exclusion criterion was overly restrictive and may have inadvertently excluded eligible participants who met our other inclusion criteria. As a result of this reassessment, we revised our exclusion criteria to no longer exclude individuals solely on the basis of receiving rituximab treatment. This modification allowed us to capture a more diverse patient population while maintaining the scientific integrity of our study. Clinical data of patients were collected from routine visits at an outpatient clinical setting, and the assignment to the outcome group was determined using the BVAS form 6 months after study inclusion. The study was approved by the institutional review board (Ethics Committee of the Charité EA1/284/19) in accordance with the Declaration of Helsinki and was registered in June 2020 (trial registry number: NCT04428398). All participants provided written informed consent before participation. This study followed the Standards for Reporting of Diagnostic Accuracy reporting guideline.
Sample Handling and Flow Cytometric Analysis
Spontaneously voided mid-stream urine samples (median volume 60 ml) were obtained at baseline, followed by immediate dipstick analysis and on-site fixation using our previously reported urine cup preservation set with 3-(N-morpholino)propanesulfonic acid (MOPS, Carl Roth GmbH+ Co. KG) buffer and imidazolidinyl urea (IU, Sigma-Aldrich), enabling storage at 4°C for a maximum of 7 days.29 For conservation of urine samples, we combined liquid MOPS buffer (1 mol/L) and powdered IU (20 g/L of total volume) in a ratio of 1:3 relative to the total volume. The MOPS buffer was prepared as follows: 20.95 g MOPS, 0.82 g of sodium acetate (Carl Roth), and 1.85 g of ethylenediamine tetraacetic acid (Sigma-Aldrich) were dissolved in 100 ml of deionized water. The pH was adjusted to 7 using sodium hydroxide (Carl Roth). Specimens were subsequently transported to a central laboratory where they were centrifuged at 600 g for 8 minutes at 4°C. The cell pellet was resuspended in 1 ml of freezing medium, consisting of 90% FCS and 10% DMSO, and then cryopreserved at −80°C for a median of 1 year.
The protocol for flow cytometric analysis included careful defrosting of samples in phosphate-buffered saline, pH 7.2, 0.2% bovine serum albumine, and 2 mM ethylenediamine tetraacetic acid (phosphate-buffered saline) before filtering them through a 30-µm cell strainer (Miltenyi Biotech). To prevent nonspecific binding, fragment crystallizable receptors were inhibited using a human fragment crystalliazble receptors blocking solution (Miltenyi Biotech). Subsequently, the samples were incubated with fluorochrome-conjugated monoclonal antibodies on ice and in darkness for at least 15 minutes.
The following antibodies were used for staining: anti-CD3-APCeF780 (eBioscience, SK7, mo IgG1k), -CD4-PEVio770 (Miltenyi Biotec, REA623, REA) -CD8-A647 (German Rheumatism Research Center Berlin) -CD45RO-PE (Biolegend, UCHL1, mo IgG1k2), -CCR7-BV421 (Biolegend, G043H7, mo IgG2ak), CD28-FITC (Biolegend, G46-6, mo IgG2ak), and human leukocyte antigen - DR-isoytpe (HLA-DR)-BV711 (Biolegend, L243, mo IgG2ak). Antibody titration was performed for optimal concentration using the following dilutions: CD3, CD4, CD45RO, HLA-DR, and CD28 at 1:100; CD8 at 1:2000; and CCR7 at 1:50. Appropriate unstained and fluorescence-minus-one controls were used as negative controls, and longitudinal cytometer performance was monitored using rainbow calibration particles (eight peaks; 3.0–3.4 µm; BD Bioscience). Flow cytometry was performed using the BD LSRFortessa Cell Analyzer at the Flow Cytometry Core Facility at the German Rheumatism Research Center Berlin. For the assessment of absolute counts of events, the total volume of the specimen was measured and normalized to 100 ml of urine. Data were analyzed using FlowJo v10.8 Software (BD Life Sciences) for Windows. The gating strategy used for the identification of T-lymphocyte populations is shown in Figure 2A.
Figure 2.

Urinary CD4+ T lymphocytes predict renal relapse in patients with ANCA-associated vasculitis in remission during a 6-month follow-up. (A) Flow cytometric gating strategy of T-lymphocyte subsets shown in one patient with subsequent renal relapse and one patient in continued stable remission. (B) Comparison of absolute CD4+ T-cell counts per 100 ml of urine between renal relapse and stable remission. (C) Selection of patients with renal relapse. Shown are the corresponding urinary CD4+ T-cell counts and the timing of renal relapse over the follow-up period. (D) ROC curve analysis showing the diagnostic performance of urinary CD4+ T lymphocytes in predicting renal relapse in patients with ANCA-associated vasculitis. (E) Kaplan–Meier analysis on renal relapse-free survival. AUC value, 0.88. Significance levels: ns, no significance, ***P < 0.001. AUC, area under the curve; FSC, forward scatter; ROC, receiver operating characteristic; SSC, side scatter.
Routine Laboratory Data
Routine laboratory data were retrieved from our digital file system as measured by diagnostic laboratory (Labor Berlin). Specifically, ANCA antibodies levels were determined using ELISA to specify target antigens (PR3 or myeloperoxidase [MPO]). Hematuria was identified through urine dipstick analysis and, if available, further quantified using fuorescence-activated cell sorting. Proteinuria was assessed via dipstick analysis, whereas the protein-to-creatinine ratio in urine samples was calculated to provide a quantitative measure of protein excretion.
Statistical Analysis
All statistical analyses were conducted using R statistical software (v 4.1.1; The R Foundation for Statistical Computing, Vienna, Austria). Normally distributed data were presented as mean±SD, while skewed data were expressed as median and interquartile range (IQR). Logarithmic transformation was applied, where applicable, to normalize the distribution of continuous variables. Categorical variables were described in terms of frequencies and percentages and compared using the chi-squared test or Fisher exact test, as appropriate. Continuous variables with nonparametric distribution were compared between two independent groups using the Mann–Whitney U test. Correlations among continuous variables were assessed using Spearman rank correlation coefficients. Receiver operating characteristic (ROC) curves were constructed to determine optimal cutoff values and to calculate the area under the curve (AUC) for different T-cell subsets, ANCA ELISA, proteinuria, albuminuria, and hematuria. Kaplan–Meier survival analysis was performed to estimate clinical outcomes in patients with different cutoff values for urinary CD4+ T lymphocytes. All reported P values were considered statistically significant at an alpha level of <0.05.
Results
Patient Characteristics
A total of 112 patients with ANCA-associated vasculitis in remission at baseline were enrolled in this study, of whom ten had to be excluded because of urinary tract infection (n=6) or active kidney disease at the time of inclusion (n=4). This resulted in a final study population of 102 participants, including 75 (74%) who were proteinase-3 ANCA (PR3-ANCA) positive and 27 (26%) who were MPO-ANCA positive. The mean (SD) age of the participants was 63 (13) years, with men (54%) and women (46%) equally represented in the cohort. During the median (IQR) follow-up time of 6 (6–7) months, renal relapse occurred in ten patients (9.8%), of whom six (60%) had PR3-ANCA positivity and four (40%) had MPO-ANCA positivity, while 90 patients (88%) remained in stable remission (see Supplemental Table 1 for characteristic of participants with renal relapse). Two patients (1.9%) experienced a non–renal relapse, including pulmonary involvement. These two patients with non–renal relapse were excluded from the prediction or renal relapse analysis. The baseline clinical characteristics of the study participants are summarized in Table 1.
Table 1.
Summary table of PRE-FLARED study cohort
| Characteristic at Baseline | Overall, N=102a | Outcome after 6 mo | |||
|---|---|---|---|---|---|
| Non–Renal Relapse, n=2a | Renal Relapse, n=10a | Stable Remission, n=90a | P Valueb | ||
| AAV serotype | 0.5 | ||||
| PR3-AAV | 74 (73) | 2 (100) | 6 (60) | 66 (73) | |
| MPO-AAV | 28 (27) | 0 (0) | 4 (40) | 24 (27) | |
| Age | 0.2 | ||||
| Mean (SD) | 63 (13) | 44 (11) | 65 (10) | 64 (13) | |
| Median (IQR) | 64 (55–73) | 44 (41–48) | 62 (58–72) | 65 (56–74) | |
| Sex | 0.2 | ||||
| Female | 47 (46) | 2 (100) | 3 (30) | 42 (47) | |
| Male | 55 (54) | 0 (0) | 7 (70) | 48 (53) | |
| History of kidney involvement | 84 (82) | 0 (0) | 10 (100) | 74 (82) | 0.015 |
| Kidney biopsy at initial diagnosis | 73 (72) | 0 (0) | 10 (100) | 63 (70) | 0.009 |
| History of relapsing disease | 52 (51) | 2 (100) | 7 (70) | 43 (48) | 0.2 |
| Months of first renal event until study inclusion | 0.4 | ||||
| Median (range) | 60 (6–1382) | 42 (11–72) | 122 (20–278) | 57 (6–1382) | |
| Months of last renal event until study inclusion | >0.9 | ||||
| Median (range) | 38 (6–282) | 42 (11–72) | 38 (6–145) | 38 (6–282) | |
| Follow-up time, mo | 0.001 | ||||
| Median (range) | 6 (2–8) | 6 (6–6) | 6 (2–6) | 6 (5–8) | |
| Stages of CKD (KDIGO 2012) | 0.5 | ||||
| G1 | 3 (2.9) | 0 (0) | 0 (0) | 3 (3.3) | |
| G2 | 20 (20) | 0 (0) | 2 (20) | 18 (20) | |
| G3a | 24 (24) | 0 (0) | 1 (10) | 23 (26) | |
| G3b | 18 (18) | 0 (0) | 3 (30) | 15 (17) | |
| G4 | 13 (13) | 0 (0) | 2 (20) | 11 (12) | |
| G5 | 5 (4.9) | 0 (0) | 1 (10) | 4 (4.4) | |
| None | 19 (19) | 2 (100) | 1 (10) | 16 (18) | |
| Albuminuria categories (KDIGO 2012) | 0.032 | ||||
| A1 | 50 (49) | 2 (100) | 1 (10) | 47 (52) | |
| A2 | 36 (35) | 0 (0) | 6 (60) | 30 (33) | |
| A3 | 16 (16) | 0 (0) | 3 (30) | 13 (14) | |
| BVAS score | |||||
| Median (range) | 0 (0–0) | 0 (0–0) | 0 (0–0) | 0 (0–0) | |
| PR3-ANCA, U/ml | 0.3 | ||||
| Mean (SD) | 30 (52) | 34 (38) | 74 (80) | 25 (46) | |
| MPO-ANCA, U/ml | 0.4 | ||||
| Mean (SD) | 6 (18) | 0 (0) | 15 (35) | 5 (16) | |
| C-reactive protein, mg/L | 0.080 | ||||
| Mean (SD) | 4.7 (6.4) | 6.4 (6.7) | 11.9 (14.6) | 3.7 (3.8) | |
| eGFR, ml/min per 1.73 m2 | 0.028 | ||||
| Mean (SD) | 55 (24) | 100 (15) | 44 (24) | 56 (23) | |
| Serum creatinine, mg/dl | 0.015 | ||||
| Mean (SD) | 1.49 (0.87) | 0.69 (0.02) | 1.87 (1.07) | 1.47 (0.84) | |
| Urine albumin-creatinine ratio, mg/g | 0.016 | ||||
| Mean (SD) | 189 (441) | 12 (5) | 434 (725) | 166 (400) | |
| UPCR, mg/g | 0.011 | ||||
| Mean (SD) | 287 (538) | 35 (35) | 681 (991) | 249 (457) | |
| Erythrocyturia, RBC/µl | <0.001 | ||||
| Median (range) | 0 (0–50) | 0 (0–0) | 5 (0–50) | 0 (0–20) | |
| Leukocyturia, WBC/µl | 0.3 | ||||
| Median (range) | 0 (0–500) | 62 (0–125) | 0 (0–75) | 0 (0–500) | |
| Induction therapy | 0.3 | ||||
| GC+CYC | 29 (28) | 1 (50) | 1 (10) | 27 (30) | |
| GC+CYC+infliximab | 1 (1.0) | 0 (0) | 0 (0) | 1 (1.1) | |
| GC+CYC+MMF+RTX | 4 (3.9) | 0 (0) | 0 (0) | 4 (4.4) | |
| GC+CYC+RTX | 26 (25 | 0 (0) | 6 (60) | 20 (22) | |
| GC+RTX | 13 (13) | 1 (50) | 0 (0) | 12 (13) | |
| GC+RTX+avacopan | 1 (1.0) | 0 (0) | 0 (0) | 1 (1.1) | |
| TPE+GC+CYC | 14 (14) | 0 (0) | 2 (20) | 12 (13) | |
| TPE+GC+CYC+RTX | 6 (5.9) | 0 (0) | 0 (0) | 6 (6.7) | |
| TPE+GC+RTX | 2 (2.0) | 0 (0) | 1 (10) | 1 (1.1) | |
| Unknown | 6 (5.9) | 0 (0) | 0 (0) | 6 (6.7) | |
| Maintenance therapy | 0.2 | ||||
| AZA | 22 (22) | 0 (0) | 1 (10) | 21 (23) | |
| MMF | 2 (2.0) | 0 (0) | 1 (10) | 1 (1.1) | |
| MTX | 6 (5.9) | 0 (0) | 1 (10) | 5 (5.6) | |
| PRED monotherapy | 4 (3.9) | 0 (0) | 1 (10) | 3 (3.3) | |
| RTX | 40 (39) | 0 (0) | 3 (30) | 37 (41) | |
| None | 28 (27) | 2 (100) | 3 (30) | 23 (26) | |
| PRED dose per day | 0.14 | ||||
| RED 1 mg | 2 (7.7) | 0 (NA) | 0 (0) | 2 (8.7) | |
| PRED 2 mg | 7 (27) | 0 (NA) | 1 (33) | 6 (26) | |
| PRED 3 mg | 2 (7.7) | 0 (NA) | 0 (0) | 2 (8.7) | |
| PRED 4 mg | 3 (12) | 0 (NA) | 0 (0) | 3 (13) | |
| PRED 5 mg | 8 (31) | 0 (NA) | 0 (0) | 8 (35) | |
| PRED 10 mg | 3 (12) | 0 (NA) | 1 (33) | 2 (8.7) | |
| PRED 15 mg | 1 (3.8) | 0 (NA) | 1 (33) | 0 (0) | |
AAV, ANCA-associated vasculitis; AZA, azathioprine; BVAS, Birmingham Vasculitis Activity Score; CYC, cyclophosphamide; GC, glucocorticoid; IQR, interquartile range; KDIGO, Kidney Disease Improving Global Outcomes; MMF, mycophenolate mofetil; MPO, myeloperoxidase; MTX, methotrexate; NA, not applicable; PR3, proteinase-3; PRED, prednisone; RBC, red blood cell; RTX, rituximab; TPE, therapeutic plasma exchange; UPCR, urine protein-to-creatinine ratio; WBC, white blood cell.
No. (%); mean (SD); median (interquartile range or range).
Fisher exact test; Kruskal–Wallis rank sum test.
Urinary CD4+ T Lymphocytes Predict Subsequent Renal Relapse
The primary objective of our study was to investigate the potential of urinary CD4+ T cells in predicting renal relapse 6 months in advance in patients with AAV in remission. At baseline, overall cell counts of CD3+CD4+ T cells ranged widely, from zero cells to 2077 cells per 100 ml of urine. We found that participants who experienced a subsequent relapse frequently had detectable CD3+CD4+ T cells in their urine, in contrast to patients without relapse, who had no or very few urinary T cells. Figure 2A shows a representative flow cytometry plot of two patients: one who developed renal relapse after 6 months and the other who remained in stable remission. Patients with a subsequent renal relapse had a median (IQR) of 811 (158–1493) cells per 100 ml of urine, which was significantly higher compared with patients in stable remission, who had a median (IQR) of 38 (8–123) cells per 100 ml of urine (P < 0.0001; Figure 2B). The amount of urinary CD3+CD4+ T cells compared with the time to the flare is depicted in Figure 2C. In addition, all flares were reviewed by four clinicians experienced in treating patients with ANCA-associated vasculitis and blinded for the amount or urinary T cells and patient identity. Patients who were classified as flare by at least three of four clinicians (n=6) likewise showed significantly higher amounts or urinary T cells compared with patients who remained in stable remission (P < 0.0001; Supplemental Figure 1).
Next, we performed a ROC curve analysis to assess the performance of urinary CD4+ T lymphocytes in predicting future renal events. We found that the AUC for the model was 0.88 (95% confidence interval [CI], 76.62% to 98.94%), indicating good predictive power for future renal events (Figure 2D). A cutoff value corresponding to the optimal trade-off between sensitivity and specificity was determined using the Youden's index, which yielded a value of 50 cells/100 ml of urine with a sensitivity of 100% (95% CI, 69.15% to 100%) and a specificity of 57.8% (95% CI, 46.91% to 68.12%). An alternative cutoff value of 490 cells/100 ml of urine was determined as the closest point to the upper left corner of the ROC curve analysis, resulting in a specificity of 98% (95% CI, 92.20% to 99.73%), with a sensitivity of 60% (95% CI, 26.24% to 87.84%). The positive likelihood ratio was 27 (95% CI, 6.26 to 116.37), and the negative likelihood ratio was 0.41 (95% CI, 0.19 to 0.87).
Further biomarker characteristics, such as positive predictive value and negative predictive value, with a flare prevalence of 10%, are summarized for both cutoff values in Table 2.
Table 2.
Diagnostic performance of urinary CD4+ lymphocyte counts for predicting renal relapse at the 6-month follow-up in ANCA-associated vasculitis
| Biomarker | Sensitivitya | Specificitya | PPVa | NPVa |
|---|---|---|---|---|
| >490 CD4+ T cells | 60 (26.24 to 87.84) | 97.8 (92.2 to 99.73) | 75.2 (34.91 to 96.81) | 95.7 (89.24 to 98.8) |
| >50 CD4+ T cells | 100 (69.15 to 100) | 57.8 (46.91 to 68.12) | 20.9 (10.47 to 34.99) | 100 (93.15 to 100) |
NPV, negative predictive value; PPV, positive predictive value.
No. in percentage, (95% confidence interval).
Finally, we conducted a Kaplan–Meier analysis using a cutoff value of 490 cells/100 ml of urine (Figure 2E). The study population was divided into two groups, namely the low-risk (<490 CD4+ T cells/100 ml) and high-risk (≥490 CD4+ T cells/100 ml) groups, to assess the subsequent risk of flare. Among the patients assigned to the high-risk group (n=8), the median time to renal event was 6 months, whereas in the low-risk group (n=92), the median time to event could not be determined as most individuals (88 [95.6%]) remained in stable remission. Within the observation time, six patients (75%) in the high-risk group experienced a renal relapse, compared with only four (4.4%) in the low-risk cohort. Furthermore, the log-rank test revealed that the risk of renal flare was significantly higher in the high-risk group (P < 0.0001). The hazard ratio for renal relapse in this group was 28.9 (95% CI, 8.0 to 104; P < 0.001).
Predictive Performance of Other T-Lymphocyte Phenotypes
In addition to CD3+CD4+ T cells, we also quantified CD3+CD8+ T cells and assessed the phenotype of urinary T cells. Figure 3A displays an example of our gating strategy, which involved quantification of T effector memory (CCR7+CD45RO+), T central memory (CCR7−CD45RO+), effector memory cells re-expressing CD45RA (CCR7−CD45RO−), and naive (CCR7+CD45RO−) cells in urine. In addition, CD28 and HLA-DR markers (not shown here) were stained to identify previous activation of the T cells.
Figure 3.

Predictive performance of different T-lymphocyte phenotypes. (A) Gating strategy of flow cytometric analysis for detection of additional T-lymphocyte populations. FMO control is shown in blue, and full stain is displayed in red. (B) Selection of T-cell populations with significant difference in absolute cell counts per 100 ml of urine between renal relapse and stable remission. (C) ROC curve analysis of selected T-cell populations to distinguish renal relapse from stable remission. Corresponding ROC curves and AUC values shown in distinct color shades, in pink CD4+ subpopulations, in green CD8+ subpopulations. Significance levels: ns, ***P < 0.001. FMO, fluorescence-minus-one; ns, no significance; TCM, T central memory cells; TEM, T effector memory cells; TEMRA, T effector memory cells reexpressing CD45RA; TNV, naive T cells.
Differences in cell counts between patients with renal relapse and stable remission were not limited to CD4+ T cells alone but were also observed in other subsets of T lymphocytes (Figure 3B). These included CD8+, T effector memory (CD4+ and CD8+), T central memory (CD4+), T effector memory cells re-expressing CD45RA (CD4+ and CD8+), HLA-DR–negative (CD4+ and CD8+), and CD28-positive (CD4+ and CD8+) T cells. In all these phenotypes, cell counts were significantly higher in patients who subsequently experienced renal relapse compared with those with stable remission (P value < 0.0001 for all comparisons). However, all these subsets were found to be less effective than CD4+ T cells in predicting subsequent renal relapse (Figure 3, B and C).
Relationship between Change in Kidney Function and Urinary CD4+ T Lymphocytes
To investigate whether high urinary T-cell counts are associated with loss of kidney function over time, we examined the relationship between urinary CD4+ T-cell counts and change in eGFR, as determined by the Chronic Kidney Disease Epidemiology Collaboration equation 2009, from baseline to follow-up time point. All 102 study participants, involving those with non–renal relapse, were included to analysis. Spearman rank correlation was used to assess the association between these variables. We found a significant negative correlation between baseline urinary CD4+ T-cell counts and change in eGFR in the subsequent months (ρ=−0.24; 95% CI, −0.42 to −0.04; P = 0.01) (Figure 4A). Furthermore, there was a positive correlation between the increase in urine protein-to-creatinine ratio (UPCR) and the initial number of urinary CD4+ T cells (ρ=0.24; 95% CI, 0.04 to 0.42; P = 0.01) (Figure 4B). Thus, patients with higher CD4+ cell counts at baseline exhibited a greater decline in eGFR and increased in UPCR over the follow-up period.
Figure 4.

Relationship between change in kidney function and urinary CD4+ T lymphocytes. (A) Spearman correlation scatter plot between CD4+ cell counts per 100 ml urine and loss of GFR in ml/min from baseline to follow-up time point after 6 months. Black line represents linear regression with 95% CI. In addition to renal relapse and stable remission, patients with non–renal relapse were also considered for analysis (N=102). (B) Spearman correlation between CD4+ cell counts per 100 ml urine and change in UPCR in mg/g from baseline to follow-up time point at 6 months. Black line represents linear regression with 95% CI. Tow outliers are also displayed with the respective value for change in protein/creatinine ratio indicated. CI, confidence interval; UPCR, urine protein-to-creatinine ratio.
Urinary CD4+ T Cells Outperform Other Biomarkers for Predicting Renal Relapses
We compared urinary CD4+ T cells with standard markers currently used for monitoring patients with ANCA-associated vasculitis in remission. ANCA ELISA, UPCR, urine albumin-creatinine ratio, and erythrocyturia all had lower AUC values in the ROC analysis for predicting renal flares compared with CD4+ T cells (AUC=0.88) (Figure 5A). The corresponding AUC values were 0.79 for ANCA titers, 0.74 for both PCR and ACR, and 0.71 for erythrocyturia.
Figure 5.

Enhanced diagnostic performance of urinary CD4+ T lymphocytes over current clinical screening parameters, with improved diagnostic yield in PR3+ subgroup analysis, at the 6-month follow-up. (A) ROC curve analysis to distinguish renal relapse from stable remission of CD4+ T-cell biomarker compared with serum ANCA levels, proteinuria, albuminuria, and erythrocyturia. ROC curves and AUC values are shown in different shades. (B) Selection of PR3+ subgroup (n=72). All relapses cluster in the depicted upper left quadrant. PR3, proteinase-3.
Enhanced Predictive Value in Subgroup Analysis through a Post Hoc Analysis of Combined Urinary CD4+ T Cells and PR3-ANCA ELISA
In a post hoc analysis, we evaluated whether the diagnostic performance of urinary CD4+ T cells could be enhanced by combining them with ANCA levels. For this purpose, we conducted a subgroup analysis in patients with PR3-ANCA–positive ANCA-associated vasculitis (n=72). Combining PR3-ANCA levels with urinary CD4+ T-cell counts resulted in improved discrimination between patients with subsequent renal relapse and those in stable remission (Figure 5B).
Extended Follow-Up at 12 Months Does Not Demonstrate Additional Predictive Value of Urinary CD4+ T Cells
An extended follow-up 12 months after study inclusion was performed for the cohort of 90 patients with ANCA-associated vasculitis who had remained in stable remission at the 6-month visit. A total of seven patients were lost to follow-up. Among the remaining patients, two individuals experienced a renal relapse and one developed a non–renal relapse. Most patients (80 of 90) maintained their remission status. Our analysis (Supplemental Figure 2) of urinary CD4+ T-cell counts, presented in supplemental data, revealed no significant difference between patients with renal relapse and those in stable remission. These findings indicate that the CD4+ biomarker did not demonstrate additional value for predicting outcomes during the extended follow-up period beyond 6 months.
Discussion
The main finding of this prospective observational study in a large cohort of patients with ANCA-associated vasculitis in remission is that the numbers of urinary CD4+ T cells are increased in patients with subsequent renal relapse compared with patients who remain in stable remission. Within a median follow-up of 6 months in our primary analysis, 75% of patients with high urinary CD4+ T-cell counts (>490 cells/100 ml of urine) experienced a renal flare, compared with only 4% of patients with lower counts, suggesting that the absence of urinary CD4+ T cells can reliably rule out relapsing disease (negative predictive value, 96%).
Previous studies have already demonstrated that urinary T lymphocytes detected by flow cytometry are excellent discriminators between active and inactive states of inflammation in various types of GN, such as lupus nephritis or GN with ANCA-associated vasculitis.23,24,30 This study extends these findings, showing that urinary T cells may also detect subclinical silent inflammation in the kidneys. Although direct correlation with histology is pending, the association of mildly elevated urinary T-cell counts with subsequent flares and loss of kidney function suggests that this subclinical kidney inflammation may have clinical relevance.
Arguably, the clinical scenario where a marker predicting future risk is most needed is the care for patients with GN with ANCA-associated vasculitis in stable remission. On one hand, there is a rationale to minimize immunosuppression in these patients to reduce side effects, but on the other hand, these patients are at considerable risk for relapse and further organ damage. In clinical practice, measuring ANCA ELISA, serum creatinine, proteinuria, hematuria, and urine sediment remain the most common methods of detecting relapse in patients with ANCA-associated vasculitis. However, none of these methods reliably predicts relapses, which may be detected too late for effective management. Persistent hematuria and proteinuria imply a risk for renal relapse, but alone are insufficient to predict relapse and guide treatment.31 Observational studies suggest that the rise of serum PR3-ANCA and MPO-ANCA correlate with the risk of renal relapse.12,18,32 However, data from larger cohort studies have found that a rise in ANCA titer is not necessarily a reliable biomarker for predicting disease flare, with the most credible information derived from a meta-analysis.21 The authors concluded that ANCA titers are not sufficiently reliable to direct therapy decisions, as an increase in ANCA titer showed a sensitivity of 56% and specificity of 82% in the detection of an impending relapse, whereas continuously high titers showed even poorer sensitivity and specificity (38% and 78%, respectively).21,33,34 Notably, urinary T cells outperformed all other clinical markers for flare prediction.
Despite our enthusiasm regarding the predictive potential of urinary T cells for renal relapse, we acknowledge that they were not able to accurately predict all subsequent flares. To further enhance flare prediction, we propose two strategies. First, considering that any biomarker can only predict the clinical course for a limited period in the future and that 6 months may be too long, repeated measurements every 3 months may offer better flare prediction, as our data also suggest. Second, incorporating additional biomarkers, such as sCD163, monocyte chemoattractant protein-1, and CD25, alongside urinary T cells, reflecting diverse aspects of pathogenesis, may augment risk stratification for renal relapse. In our post hoc analysis of the PR3-ANCA subgroup, we observed that the combined assessment of PR3-ANCA ELISA and urinary T cells may result in enhanced flare prediction; however, it should be emphasized that this approach has not yet undergone formal validation for diagnostic utility. Moreover, as this analysis was not a predefined end point, further prospective trials are warranted to validate whether the combination of immune biomarkers could provide improved predictive accuracy and whether it may also be beneficial in the MPO positive ANCA-associated vasculitis subgroup.
In our analysis of the correlation between urinary CD4+ T-cell levels and the loss of eGFR and change in proteinuria, we observed Spearman correlation coefficients (ρ) that indicated a very weak degree of correlation, with all ρ values being <0.3. Although we find this correlation of interest from a pathophysiological point of view, these findings also show that urinary T cells are no sufficient biomarker to predict changes in eGFR and proteinuria in our study population.
Although our study has provided valuable insights into the utility of urinary T-cell counts as a potential biomarker in patients with vasculitis, it is important to acknowledge that the applicability of our findings may be limited to certain subsets of this diverse patient population. Specifically, our research may not directly apply to individuals with low-level hematuria or those presenting with persistent low-level ANCA titers. It is essential to recognize that the utility and reliability of urinary T-cell counts as a diagnostic or prognostic tool have not been rigorously examined in these specific patient groups. Therefore, further investigations are warranted to explore the potential role of urinary T-cell counts in such contexts and to elucidate their clinical significance.
One important limitation of our study design is the potential suboptimal definition of renal relapse based on the BVAS score. Although the BVAS is commonly employed as gold standard to define relapses, this definition may not be ideal because an isolated change in a single BVAS parameter may not necessarily imply a clinically relevant change. Therefore, our definition of relapse may have been oversensitive. Moreover, the BVAS score may not adequately capture subtle inflammatory changes, particularly in its assessment of persistent hematuria and proteinuria. This poses a risk of underestimating ongoing renal inflammation, potentially misrepresenting remission. This oversight could categorize subclinically active disease as remission, affecting relapse assessments. Hence, urinary T cells might indicate ongoing inflammation evolving into clinically apparent relapses rather than predicting true relapses. This highlights the need for nuanced evaluation beyond BVAS to distinguish evolving inflammation from actual relapses postremission.
Another limitation is that due to constraints related to our sample size, it is probable that our study lacked the necessary statistical power to effectively identify or establish a significant variance in relapse rates between the 6- and 12-month follow-up.
In conclusion, we have identified the quantification of urinary T cells as a novel biomarker with the potential to significantly optimize the management of patients with renal ANCA-associated vasculitis. Urinary T cells can predict renal flares and correlate with future changes in kidney function before these events become clinically evident. This may have a substantial impact on clinical practice in two key aspects. First, by using urinary T cells as a screening tool, preventive measures can be initiated before renal flares occur. Second, by identifying patients with minimal risk of relapse, immunosuppression may be tapered in these individuals.
Supplementary Material
Acknowledgments
The funding source for this study was not involved in study design; collection, analysis, and interpretation of data; in the writing of the report; and in the decision to submit the paper for publication. The authors would like to acknowledge the Flow Cytometry and Cell Sorting Facility and laboratory managers at Deutsches Rheuma-Forschungszentrum Berlin for their technical assistance and helpful input. They would also like to express gratitude to the staff at the study centers for assisting with sample collection, as well as to the patients for their participation.
Footnotes
A.S. and P.E. jointly supervised and contributed equally to this work and also share senior authorship.
See related editorial, “The Challenge of Assessing Remission and Relapse in ANCA Kidney Disease,” on pages 395–397.
Disclosures
M. Bieringer reports employment with Helios Klinikum Berlin-Buch and speakers bureau for Vifor Pharma Deutschland GmbH. K.-U. Eckardt reports employment with Charité - Universitätsmedizin Berlin; consultancy for Akebia, AstraZeneca, Boehringer Ingelheim, GSK, Novartis, and Otsuka; research funding from Bayer, Evotec, and Travere; honoraria from Akebia, AstraZeneca, Bayer, Boehringer Ingelheim, GSK, Novartis, Sanofi, and Otsuka; and role on the Editorial Boards of BMJ and Kidney International. P. Enghard reports employment with Charité; consultancy for GlaxoSmithKline Advisory Board; ownership interest in Gilead (stocks); research funding from Hansa Biopharm; and honoraria from Akademie der Nieren, AstraZeneca, BDI, GlaxoSmithKline, NAWBerlin, and NephroUpdate. P. Enghard has submitted a patent for conserving urinary cells for subsequent analysis using flow cytometry. P. Freund reports employment with Charité and Alexianer St. Hedwig Kliniken Berlin; consultancy for Aware Health GmbH; and patents or royalties for US2022/0003748A1 and EP2019/086433. P. Freund has submitted a patent for conserving urinary cells for subsequent analysis using flow cytometry. E. Grothgar, J. Klocke, and L. Wagner report employment with Charité Universitätsmedizin Berlin. F. Hiepe reports consultancy for AstraZeneca; ownership interest in Methuselah Bio AG; research funding from Sanofi; patents or royalties from Methuselah Bio AG; advisory or leadership roles for AstraZeneca and Methuselah Bio AG; and speakers bureau for AstraZeneca. D. Metzke reports employment with Charité and patents or royalties from Charité. D. Metzke has submitted a patent for conserving urinary cells for subsequent analysis using flow cytometry. L. Prskalo reports report employment with Charité Universitätsmedizin Berlin and has received funding from the Berlin Institute of Health and the German Academic Exchange Service (BIH-MD-TRENAL Stipend). A.D. Salama reports consultancy for Hansa Medical and Vifor; research funding from Chiesi; honoraria from AnaptysBio, AstraZeneca, Hansa Medical, and Vifor Pharmaceuticals; patent application number 2301306.3 February 2023: Treatment of Granulomatous diseases; and advisory or leadership role for UK Kidney Association. U. Schneider reports employment with Charité Universitaetsmedizin Berlin; consultancy for Boehringer-Ingelheim, Germany, and Vifor, Germany; honoraria from AstraZeneca, Germany, Boehringer-Ingelheim, Germany, GSK, Germany, and Vifor Pharma, Germany; and speakers bureau for Boehringer-Ingelheim, Germany, GSK, Germany, and Sobi, Germany. A. Schreiber reports employment with Charite Berlin; consultancy for Alexion, Hansa Biopharm, Otsuka, Sanofi, Stadapharm, Travere, and Vifor Pharma; research funding from Biontech, eleva GmbH, and Lempo; advisory or leadership roles for Alexion, Hansa Biopharm, Otsuka, Sanofi, and Travere; and other interests or relationships with Dt. Gesellschaft für Nephrologie. C.M. Skopnik reports employment with Charité Universitaetsmedizin Berlin and has submitted a patent for conserving urinary cells for subsequent analysis using flow cytometry. All remaining authors have nothing to disclose.
Funding
This study has received financial support from the Berlin Institute of Health.
Author Contributions
Conceptualization: Philipp Enghard, Luka Prskalo, Adrian Schreiber.
Data curation: Markus Bieringer, Luka Prskalo, Adrian Schreiber.
Formal analysis: Luka Prskalo.
Funding acquisition: Philipp Enghard.
Investigation: Pouneh Mirkheshti, Luka Prskalo.
Methodology: Emil Grothgar, Diana Metzke, Luka Prskalo, Christopher M. Skopnik.
Project administration: Philipp Enghard, Jan Klocke, Diana Metzke, Pouneh Mirkheshti, Adrian Schreiber.
Resources: Philipp Enghard.
Supervision: Philipp Enghard, Adrian Schreiber.
Validation: Markus Bieringer, Kai-Uwe Eckardt, Philipp Enghard, Paul Freund, Nina Goerlich, Emil Grothgar, Falk Hiepe, Jan Klocke, Diana Metzke, Luka Prskalo, Alan D. Salama, Udo Schneider, Adrian Schreiber, Christopher M. Skopnik, Janis Sonnemann, Leonie Wagner.
Visualization: Luka Prskalo.
Writing – original draft: Luka Prskalo.
Writing – review & editing: Markus Bieringer, Kai-Uwe Eckardt, Philipp Enghard, Paul Freund, Nina Goerlich, Emil Grothgar, Falk Hiepe, Jan Klocke, Diana Metzke, Luka Prskalo, Alan D. Salama, Udo Schneider, Adrian Schreiber, Christopher M. Skopnik, Janis Sonnemann, Leonie Wagner.
Data Sharing Statement
Upon reasonable request, the data supporting the findings presented in this article will be shared while ensuring the anonymity of the patients involved. Requests for the data can be sent to luka.prskalo@charite.de. The data will be available for a period of 3 years from the publication of this article. Interested parties will need to submit a proposal outlining their study objectives and statistical analysis plan, which will then be subject to approval. After approval, access to the data will be provided via a secure online platform, and a data access agreement will need to be signed before gaining access.
Supplemental Material
This article contains the following supplemental material online at http://links.lww.com/JSN/E576.
Supplemental Table 1. Summary of participants experiencing renal relapse during the 6-month follow-up period.
Supplemental Figure 1. Urinary CD4+ T lymphocytes predict clinical flares in ANCA-associated vasculitis (AAV).
Supplemental Figure 2. Extended follow-up at 12 months does not demonstrate additional predictive value of urinary CD4+ T cells.
References
- 1.Kitching AR Anders H-J Basu N, et al. ANCA-associated vasculitis. Nat Rev Dis Primers. 2020;6(1):71. doi: 10.1038/s41572-020-0204-y [DOI] [PubMed] [Google Scholar]
- 2.Hoffman GS Kerr GS Leavitt RY, et al. Wegener granulomatosis: an analysis of 158 patients. Ann Intern Med. 1992;116(6):488–498. doi: 10.7326/0003-4819-116-6-488 [DOI] [PubMed] [Google Scholar]
- 3.Jennette JC, Falk RJ. Small-vessel vasculitis. N Engl J Med. 1997;337(21):1512–1523. doi: 10.1056/NEJM199711203372106 [DOI] [PubMed] [Google Scholar]
- 4.Falk RJ, Hogan S, Carey TS, Jennette JC. Clinical course of anti-neutrophil cytoplasmic autoantibody-associated glomerulonephritis and systemic vasculitis. The Glomerular Disease Collaborative Network. Ann Intern Med. 1990;113(9):656–663. doi: 10.7326/0003-4819-113-9-656 [DOI] [PubMed] [Google Scholar]
- 5.Fauci AS, Haynes BF, Katz P, Wolff SM. Wegener’s granulomatosis: prospective clinical and therapeutic experience with 85 patients for 21 years. Ann Intern Med. 1983;98(1):76–85. doi: 10.7326/0003-4819-98-1-76 [DOI] [PubMed] [Google Scholar]
- 6.Sinico RA, Di Toma L, Radice A. Renal involvement in anti-neutrophil cytoplasmic autoantibody associated vasculitis. Autoimmun Rev. 2013;12(4):477–482. doi: 10.1016/j.autrev.2012.08.006 [DOI] [PubMed] [Google Scholar]
- 7.Kronbichler A Shin JI Lee KH, et al. Clinical associations of renal involvement in ANCA-associated vasculitis. Autoimmun Rev. 2020;19(4):102495. doi: 10.1016/j.autrev.2020.102495 [DOI] [PubMed] [Google Scholar]
- 8.Hauer HA Bajema IM van Houwelingen HC, et al. Renal histology in ANCA-associated vasculitis: differences between diagnostic and serologic subgroups. Kidney Int. 2002;61(1):80–89. doi: 10.1046/j.1523-1755.2002.00089.x [DOI] [PubMed] [Google Scholar]
- 9.Salmela A, Törnroth T, Poussa T, Ekstrand A. Prognostic factors for survival and relapse in ANCA-associated vasculitis with renal involvement: a clinical long-term follow-up study. Int J Nephrol. 2018;2018:6369814. doi: 10.1155/2018/6369814 [DOI] [PMC free article] [PubMed] [Google Scholar]
- 10.Berden AE Ferrario F Hagen EC, et al. Histopathologic classification of ANCA-associated glomerulonephritis. J Am Soc Nephrol. 2010;21(10):1628–1636. doi: 10.1681/ASN.2010050477 [DOI] [PubMed] [Google Scholar]
- 11.King C Druce KL Nightingale P, et al. Predicting relapse in anti-neutrophil cytoplasmic antibody-associated vasculitis: a Systematic review and meta-analysis. Rheumatol Adv Pract. 2021;5(3):rkab018. doi: 10.1093/rap/rkab018 [DOI] [PMC free article] [PubMed] [Google Scholar]
- 12.Kemna MJ Damoiseaux J Austen J, et al. ANCA as a predictor of relapse: useful in patients with renal involvement but not in patients with nonrenal disease. J Am Soc Nephrol. 2015;26(3):537–542. doi: 10.1681/ASN.2013111233 [DOI] [PMC free article] [PubMed] [Google Scholar]
- 13.Wester Trejo MAC Floßmann O Westman KW, et al. Renal relapse in antineutrophil cytoplasmic autoantibody-associated vasculitis: unpredictable, but predictive of renal outcome. Rheumatology (Oxford). 2019;58(1):103–109. doi: 10.1093/rheumatology/key260 [DOI] [PubMed] [Google Scholar]
- 14.Morris AD, Rowbottom AW, Martin FL, Woywodt A, Dhaygude AP. Biomarkers in ANCA-associated vasculitis: potential pitfalls and future prospects. Kidney360. 2021;2(3):586–597. doi: 10.34067/KID.0006432020 [DOI] [PMC free article] [PubMed] [Google Scholar]
- 15.Free ME, Falk RJ. The search for a biomarker of relapse in ANCA-associated vasculitis. J Am Soc Nephrol. 2016;27(9):2551–2553. doi: 10.1681/ASN.2016030347 [DOI] [PMC free article] [PubMed] [Google Scholar]
- 16.O’Reilly VP Wong L Kennedy C, et al. Urinary soluble CD163 in active renal vasculitis. J Am Soc Nephrol. 2016;27(9):2906–2916. doi: 10.1681/ASN.2015050511 [DOI] [PMC free article] [PubMed] [Google Scholar]
- 17.Al-Soudi A, Vegting Y, Klarenbeek PL, Hilhorst ML. Do relapses follow ANCA rises? A systematic review and meta-analysis on the value of serial ANCA level evaluation. Front Med (Lausanne). 2022;9:844112. doi: 10.3389/fmed.2022.844112 [DOI] [PMC free article] [PubMed] [Google Scholar]
- 18.Han WK, Choi HK, Roth RM, McCluskey RT, Niles JL. Serial ANCA titers: useful tool for prevention of relapses in ANCA-associated vasculitis. Kidney Int. 2003;63(3):1079–1085. doi: 10.1046/j.1523-1755.2003.00821.x [DOI] [PubMed] [Google Scholar]
- 19.Land J Abdulahad WH Arends S, et al. Prospective monitoring of in vitro produced PR3-ANCA does not improve relapse prediction in granulomatosis with polyangiitis. PLoS One. 2017;12(8):e0182549. doi: 10.1371/journal.pone.0182549 [DOI] [PMC free article] [PubMed] [Google Scholar]
- 20.Nowack R, Grab I, Flores-Suarèz LF, Schnülle P, Yard B, van der Woude FJ. ANCA titres, even of IgG subclasses, and soluble CD14 fail to predict relapses in patients with ANCA-associated vasculitis. Nephrol Dial Transplant. 2001;16(8):1631–1637. doi: 10.1093/ndt/16.8.1631 [DOI] [PubMed] [Google Scholar]
- 21.Tomasson G, Grayson PC, Mahr AD, Lavalley M, Merkel PA. Value of ANCA measurements during remission to predict a relapse of ANCA-associated vasculitis—a meta-analysis. Rheumatology (Oxford). 2012;51(1):100–109. doi: 10.1093/rheumatology/ker280 [DOI] [PMC free article] [PubMed] [Google Scholar]
- 22.Draibe JB, Fulladosa X, Cruzado JM, Torras J, Salama AD. Current and novel biomarkers in anti-neutrophil cytoplasm-associated vasculitis. Clin Kidney J. 2016;9(4):547–551. doi: 10.1093/ckj/sfw056 [DOI] [PMC free article] [PubMed] [Google Scholar]
- 23.Sonnemann J Klocke J Bieringer M, et al. THU0321 urinary T cells identify active renal ANCA associated vasculitis. Ann Rheum Dis. 2020;79(suppl 1):390.2–390. doi: 10.1136/annrheumdis-2020-eular.3534 [DOI] [Google Scholar]
- 24.Abdulahad WH, Kallenberg CGM, Limburg PC, Stegeman CA. Urinary CD4+ effector memory T cells reflect renal disease activity in antineutrophil cytoplasmic antibody-associated vasculitis. Arthritis Rheum. 2009;60(9):2830–2838. doi: 10.1002/art.24747 [DOI] [PubMed] [Google Scholar]
- 25.Mukhtyar C Lee R Brown D, et al. Modification and validation of the Birmingham vasculitis activity score (version 3). Ann Rheum Dis. 2009;68(12):1827–1832. doi: 10.1136/ard.2008.101279 [DOI] [PubMed] [Google Scholar]
- 26.Geetha D, Seo P, Ellis C, Kuperman M, Levine SM. Persistent or new onset microscopic hematuria in patients with small vessel vasculitis in remission: findings on renal biopsy. J Rheumatol. 2012;39(7):1413–1417. doi: 10.3899/jrheum.111608 [DOI] [PubMed] [Google Scholar]
- 27.Chen TK, Murakami C, Manno RL, Geetha D. Hematuria duration does not predict kidney function at 1 year in ANCA-associated glomerulonephritis. Semin Arthritis Rheum. 2014;44(2):198–201. doi: 10.1016/j.semarthrit.2014.03.008 [DOI] [PMC free article] [PubMed] [Google Scholar]
- 28.Magrey MN, Villa-Forte A, Koening CL, Myles JL, Hoffman GS. Persistent hematuria after induction of remission in Wegener granulomatosis: a therapeutic dilemma. Medicine (Baltimore). 2009;88(6):315–321. doi: 10.1097/MD.0b013e3181c101cc [DOI] [PubMed] [Google Scholar]
- 29.Freund P Skopnik CM Metzke D, et al. Addition of formaldehyde releaser imidazolidinyl urea and MOPS buffer to urine samples enables delayed processing for flow cytometric analysis of urinary cells: a simple, two step conservation method of urinary cells for flow cytometry. Cytometry B Clin Cytom. 2023;104(6):417–425. doi: 10.1002/cyto.b.22117 [DOI] [PubMed] [Google Scholar]
- 30.Enghard P Rieder C Kopetschke K, et al. Urinary CD4 T cells identify SLE patients with proliferative lupus nephritis and can be used to monitor treatment response. Ann Rheum Dis. 2014;73(1):277–283. doi: 10.1136/annrheumdis-2012-202784 [DOI] [PubMed] [Google Scholar]
- 31.Benichou N Charles P Terrier B, et al. Proteinuria and hematuria after remission induction are associated with outcome in ANCA-associated vasculitis. Kidney Int. 2023;103(6):1144–1155. doi: 10.1016/j.kint.2023.02.029 [DOI] [PubMed] [Google Scholar]
- 32.van Dam LS Dirikgil E Bredewold EW, et al. PR3-ANCAs predict relapses in ANCA-associated vasculitis patients after rituximab. Nephrol Dial Transplant. 2021;36(8):1408–1417. doi: 10.1093/ndt/gfaa066 [DOI] [PMC free article] [PubMed] [Google Scholar]
- 33.Kyndt X Reumaux D Bridoux F, et al. Serial measurements of antineutrophil cytoplasmic autoantibodies in patients with systemic vasculitis. Am J Med. 1999;106(5):527–533. doi: 10.1016/s0002-9343(99)00064-9 [DOI] [PubMed] [Google Scholar]
- 34.Kerr GS, Fleisher TA, Hallahan CW, Leavitt RY, Fauci AS, Hoffman GS. Limited prognostic value of changes in antineutrophil cytoplasmic antibody titer in patients with Wegener’s granulomatosis. Arthritis Rheum. 1993;36(3):365–371. doi: 10.1002/art.1780360312 [DOI] [PubMed] [Google Scholar]
Associated Data
This section collects any data citations, data availability statements, or supplementary materials included in this article.
Data Availability Statement
Upon reasonable request, the data supporting the findings presented in this article will be shared while ensuring the anonymity of the patients involved. Requests for the data can be sent to luka.prskalo@charite.de. The data will be available for a period of 3 years from the publication of this article. Interested parties will need to submit a proposal outlining their study objectives and statistical analysis plan, which will then be subject to approval. After approval, access to the data will be provided via a secure online platform, and a data access agreement will need to be signed before gaining access.