Detailed investigation of the NdGa–H(D)2 systems led to the unambiguous identification of two distinct phases. It was found that NdGaH(D) y (1.1 ≥ y ≥ 0.9) has a onefold structure while NdGaH(D) x (1.6 ≥ x ≥ 1.2) adopts a threefold superstructure.
Keywords: intermetallic compounds, metal hydrides, crystal structure, Zintl phases
Abstract
NdGa hydride and deuteride phases were prepared from high-quality NdGa samples and their structures characterized by powder and single-crystal X-ray diffraction and neutron powder diffraction. NdGa with the orthorhombic CrB-type structure absorbs hydrogen at hydrogen pressures ≤ 1 bar until reaching the composition NdGaH(D)1.1, which maintains a CrB-type structure. At elevated hydrogen pressure additional hydrogen is absorbed and the maximum composition recovered under standard temperature and pressure conditions is NdGaH(D)1.6 with the Cmcm LaGaH1.66-type structure. This structure is a threefold superstructure with respect to the CrB-type structure. The hydrogen atoms are ordered and distributed on three fully occupied Wyckoff positions corresponding to tetrahedral (4c, 8g) and trigonal–bipyramidal (8g) voids in the parent structure. The threefold superstructure is maintained in the H-deficient phases NaGaH(D) x until 1.6 ≥ x ≥ 1.2. At lower H concentrations, coinciding with the composition of the hydride obtained from hydrogenation at atmospheric pressure, the unit cell of the CrB-type structure is resumed. This phase can also display H deficiency, NdGaH(D) y (1.1 ≥ y ≥ 0.9), with H(D) exclusively situated in partially empty tetrahedral voids. The phase boundary between the threefold superstructure (LaGaH1.66 type) and the onefold structure (NdGaH1.1 type) is estimated on the basis of phase–composition isotherms and neutron powder diffraction to be x = 1.15.
1. Introduction
Zintl phases are compounds which constitute an active metal [alkali, alkaline earth (AE) or rare earth (RE)] and a more electronegative p-element component (Haussermann et al., 2011 ▸). Like less-polar intermetallic compounds, Zintl phases can react with hydrogen to form hydrides. Although the H content of Zintl phase hydrides is comparatively low (H/M < 1), the chemical structures and physical properties of Zintl phases can change profoundly upon H incorporation. The hydrogenation-induced metal–semiconductor transition for the systems AETt–AETtH (AE = Ba and Sr, Tt = Si, Ge, Sn and Pb) (Auer et al., 2017 ▸) and AETrTt–AETrTtH (Tr = Al, Ga, In; Tt = Si, Ge, Sn) (Häussermann, 2008 ▸) has been well investigated. More recently, interest has shifted to RE metal-containing Zintl phases because of hydrogenation-induced magnetic property changes (Werwein et al., 2018 ▸, 2019 ▸; Nedumkandathil et al., 2016 ▸). For example, NdGa, GdGa and Eu3Si4 are all ferromagnetic Zintl phases which, upon H incorporation, either become antiferromagnetic [NdGa (Ångström et al., 2016 ▸) and GdGa (Nedumkandathil et al., 2016 ▸)] or paramagnetic (Eu3Si4) hydrides (Ek et al., 2019 ▸). Our main interest resides in the explicit elucidation of the magnetic structures of NdGa and its hydrides, i.e. hydrogen-induced magnetic property changes. However, during attempts to prepare pure samples for neutron diffraction studies of the magnetic structure we encountered some peculiarities and deviations from previous work. Consequently, in this paper we want to focus on the structural analysis and provide an updated and clear view of the hydrogenation behavior and hydride phases of NdGa.
The structures of NdGa and its hydrides have previously been studied by Dwight et al. (1967 ▸) who concluded that NdGa crystallizes in an orthorhombic CrB-type structure. In the first report on hydrides (and deuterides) of NdGa by Ångström et al. (2016 ▸), the hydride NdGaH∼1.66 was produced after hydrogenation at 10–20 bar and near 573 K and a monoclinic structure was deduced from neutron powder diffraction (NPD) of its corresponding deuteride. In the NdGaH1.66 structure the arrangement of the metal atoms of the NdGa Zintl-phase precursor is essentially maintained while H is incorporated into two distinct positions: a fully occupied tetrahedral void defined by four Nd atoms and a partially occupied (66%) trigonal–bipyramidal void defined by three Nd and two Ga atoms. It was further shown that H desorption from NdGaH1.66 occurs in two discrete steps that correlate with the two types of H position. Later, Auer et al. (2019 ▸) studied the formation of NdGaD x by in situ NPD and concluded that the structure of NdGaH1.66 is an orthorhombic threefold superstructure of the CrB-type structure of the parent compound NdGa, with H atoms ordered on three fully occupied positions. In addition, Auer et al. (2019 ▸) found evidence of twofold superstructuring for lower H concentrations, 1.53 < x < 1.66, whereas phases with H compositions 1.10 < x < 1.22 attained the cell of the CrB-type structure and hydrides with H contents lower than NdGaH x (x < 1) were not reported.
In the previous reports on NdGa hydrides the authors have experienced difficulties with preparing impurity-free NdGa samples (Auer et al., 2019 ▸; Ångström et al., 2016 ▸). The presence of impurities can impede the structure characterization of hydrides from powder diffraction and may also lead to misinterpretation of magnetic properties from magnetometry measurements. In this article we report on the synthesis of (virtually) phase-pure and single-crystalline NdGa and NdGaH(D) x hydrides/deuterides (x = 0.9, 1.1, 1.2 and 1.6). The single-crystal nature and the phase purity of the samples allowed for more accurate structure refinements and a more reliable analysis of the superstructure phenomenon.
2. Experiment
2.1. Synthesis
NdGa was synthesized by arc melting pieces of pure Nd (Smart-elements, purity 99.9%) and Ga (99.999%) in an Ar atmosphere (99.999%) with several remelts. A 1% excess of Nd was used to avoid the presence of NdGa2 impurities. The sample was wrapped in Ta foil, sealed in a stainless steel tube under Ar, annealed at 1173 K for 5 d and quenched in cold water. The sample was then crushed, and small single crystals were manually collected from this powder. The powder and the single crystals were used for further characterization.
Hydrides and deuterides were synthesized similarly to previous work (Auer et al., 2019 ▸; Ångström et al., 2016 ▸). For the hydrogenation, coarse pieces of the sample were loaded into a stainless steel autoclave. Prior to the actual hydrogenation an activation procedure at 573 K in a vacuum was performed. The hydrogenation was started at 573 K and small portions of H2 (steps of 0.2–0.5 bar) were introduced into the autoclave. This procedure is needed to avoid hydrogen-induced disproportionation of NdGa, since the kinetics of absorption are fast at the beginning. This procedure also prevents the formation of any NdH x as observed for other RE-rich compounds (Shtender et al., 2015 ▸). After the active absorption at 573 K had finished, the temperature was lowered to room temperature and the H2 pressure was increased to 25 bar. The absorption process was considered complete when no obvious pressure changes could be observed after waiting for a couple of hours. Pressure–composition isotherms (PCIs) were measured in an in-house-built Sieverts-type instrument with thermostatically calibrated volumes at 298 K. Several coarse pieces of the sample were placed inside a stainless steel sample holder and activated by a heat treatment at 573 K under a dynamic vacuum for 6 h. The temperature was maintained at 573 K, and small doses of gaseous hydrogen were introduced to avoid hydrogen-induced disproportionation, as explained above. For the calculation of the hydrogen capacity, the real equation of state for hydrogen was used from the program GASPAK (Version 3.32; Cryodata Inc., Boulder, Colorado, USA). This apparatus was also used to prepare NdGaH x samples with x = 1.1, 1.2 and 1.6 at 1 bar and room temperature. The NdGaH(D) x single crystals were collected from the hydrogenated powder in a similar manner to the parent compound.
2.2. Thermal desorption experiments
The thermal desorption of NdGaH1.6 and NdGaD1.6 was studied by simultaneous differential scanning calorimetry (DSC). A small quantity (10–20 mg) of powder was placed into an Al2O3 crucible which was purged three times with Ar (99.999%). The desorption experiments were performed by heating the sample to 873 K in an Ar atmosphere at a heating rate of 20 K min−1. The same protocol was used to estimate the formation temperature for the NdGa compound.
Thermal desorption spectrometry (TDS) experiments were conducted on fully saturated hydrides and deuterides (up to 873 K at a heating rate of 10 K min−1) to measure the hydrogen/deuterium desorption profiles with temperature. Samples with intermediate hydrogen concentrations were prepared by partial desorption using TDS and DSC instruments (by heating to specific temperatures, e.g. 473, 523, 548, 573 and 648 K) for ex situ single-crystal X-ray diffraction. NdGaD0.9 deuteride for NPD diffraction was prepared by desorption of a fully saturated sample with the TDS technique by heating up to 648 K.
Thermal desorption from the fully saturated hydride was also studied with in situ synchrotron radiation powder X-ray diffraction (SRPXRD) on the P02.1 beamline at PETRA III at the German Electron Synchrotron (DESY, Hamburg, Germany) using a Varex XRD 4343CT detector, a sample-to-detector distance of 1150 mm and a fixed wavelength of 0.20734 Å as determined by an LaB6 standard. The powder was loaded into a quartz tube mounted on a gas cell as described previously (Höglin et al., 2015 ▸; Jensen et al., 2010 ▸) and heated under vacuum at 10 K min−1 using a filament wrapped around the quartz tube. In addition, SRPXRD patterns for NdGa, NdGaD0.9, NdGaH1.1, NdGaH1.2 and NdGaH1.6 were collected at room temperature (this was done to eliminate the strong preferred orientation present for the in-house diffractometer). The data were integrated using the software Dawn (Filik et al., 2017 ▸). Unit-cell parameters were extracted by sequential Pawley refinements in the software TOPAS (Version 6; Coelho, 2018 ▸) with the background described by a fifth-order Chebyschev polynomial and peak shapes by Thompson–Cox–Hastings pseudo-Voigt functions.
2.3. Phase analysis
The phase purity of the NdGa samples was checked with powder X-ray diffraction (PXRD) and a scanning electron microscope equipped with an energy-dispersive X-ray spectroscopy (EDS) detector. The powders were mounted on single-crystal Si sample holders and X-ray diffraction patterns were collected using a Bruker D8 Advance with Cu Kα radiation at room temperature. The Rietveld method (Rietveld, 1969 ▸) as implemented in TOPAS (Version 6; Coelho, 2018 ▸) was used for analysis of the diffraction data. The samples for electron microscopy analysis were prepared by standard metallographic techniques by grinding with SiC paper. For qualitative determination of the impurity, X-ray photoelectron spectroscopy (XPS) data were collected using a PHI Quantera II system with an Al Kα X-ray source and a hemispherical electron energy analyzer having a pass energy of 26.00 eV. Before recording an XPS spectrum the sample surface was cleaned by 500 eV Ar-ion sputtering for 30 s.
For all samples, single crystals were analyzed. A Bruker D8 single-crystal X-ray diffractometer with Mo Kα radiation (λ = 0.71073 Å) upgraded with an Incoatec Microfocus Source (IμS) and an APEXII CCD area detector was utilized to collect single-crystal X-ray diffraction (SCXRD) patterns at room temperature. The SCXRD data reduction and numerical absorption corrections were performed using SADABS (Krause et al., 2015 ▸) as implemented in the APEX3 software (Bruker, 2016 ▸). Initial models of the crystal structures were first obtained with the program SHELXT2019 (Sheldrick, 2015a ▸) and refined using the program SHELXL2019 (Sheldrick, 2015b ▸) within the APEX3 software package.
Neutron powder diffraction (NPD) patterns of the deuterides (NdGaD0.9 and NdGaD1.6) were collected using the instrument WISH at the ISIS Neutron and Muon Source (Didcot, UK) (Chapon et al., 2011 ▸). Around 3 g of each sample were placed in separate V cans and measured at 20 K. The obtained diffraction data were analyzed using the Rietveld method (Rietveld, 1969 ▸) implemented in the software FULLPROF (Rodriguez-Carvajal et al., 1999 ▸). The deuterium positions were determined using difference Fourier maps. In the refinements several structure parameters, including the atomic positions, atomic displacement and D occupancies, were allowed to vary.
3. Results and discussion
3.1. Synthesis of (nearly) phase-pure NdGa and its hydrogenation/desorption behavior
Some available phase diagrams of the Nd–Ga system (Villars et al., 2018 ▸) report that the binary NdGa compound forms from the peritectic reaction of NdGa2 and melt at around 1173 K (Okamoto, 1990 ▸; Manory et al., 1978 ▸). Thus, the synthesis of NdGa is typically performed by arc melting stoichiometric amounts of elemental metals and subsequent long annealing at temperatures below ∼1173 K, and yet the obtained NdGa products are notoriously accompanied by (unknown) impurities (Auer et al., 2019 ▸; Ångström et al., 2016 ▸). However, in the phase diagram proposed by Yatsenko et al. (1979 ▸) for the Nd–Ga system, the peritectic line is at a much higher temperature of 1361 K, which is in good agreement with the temperature found from our present DSC experiments (see Fig. S1 in the supporting information). Thus, higher annealing temperatures can be applied. It was found that an increase in the annealing temperature to 1173 K effectively removes the unknown impurities. It was also found that the purity of the Nd metal plays a very important role in the synthesis of high-quality NdGa samples (it should not be lower than 99.9%) and Nd should be strictly handled in an Ar-filled glove box to avoid oxidation. As a result, the NdGa alloy was synthesized with a much higher purity than in the previous reports, although the samples were still contaminated with up to ∼1.5 wt% of Nd1−x Ce x O1.75 (Ce is a common impurity in Nd and its presence was found by EDS). Another impurity was observed from XPS which detected peaks related to Ta (for EDS the Ta peaks are hidden in the background). Rietveld refinements of the PXRD data for NdGa, presented in Fig. 1 ▸(a), revealed the presence of ∼0.5 wt% TaGaO4 (most probably due to the synthesis in Ta foil). Fig. 1 ▸ also presents Rietveld refinements of PXRD data for the two hydrides NdGaH0.9 and NdGaH1.6. As shown in Fig. S2, our NdGa sample consisted of crystals with sizes ranging from 20 to 150 µm, and EDS analysis of the crystals gives an average composition of Nd1.02 (1)Ga0.98 (1), confirming that stoichiometric NdGa was synthesized.
Figure 1.
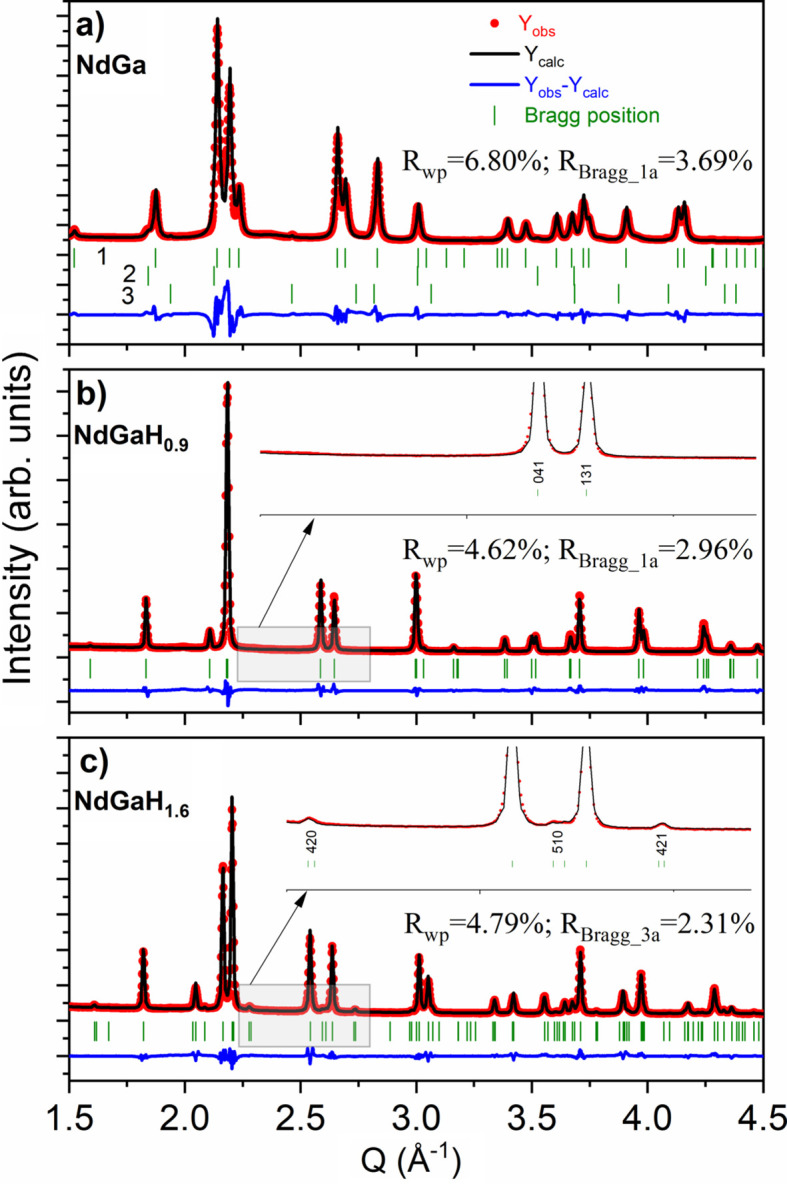
Rietveld refinement for the SRPXRD data profiles for NdGaH x (x = 0, 0.9 and 1.6) compounds. The insets show the absence and presence of the 3a superlattice peaks for x = 0.9 and x = 1.6, respectively. In panel (a), 1 stands for 98% NdGa, 2 is 1.5% Nd1−x Ce x O1.75 and 3 is 0.5% TaGaO4.
PCIs recorded at 573 K with H2 [Fig. 2 ▸(a)] confirmed the results from previous work: NdGa behaves as a hydrogen getter (i.e. it absorbs H without overpressure) until a composition of NdGaH1.1 is reached at around 1 bar. At 20 bar a hydrogen capacity of 1.56 H per formula unit (f.u.) is observed. Using the same conditions, Ångström et al. (2016 ▸) reported a limiting composition of NdGaH2 after 48 h. Auer et al. (2019 ▸) obtained 1.8 D f.u.−1 at 40 bar and 473 K in their in situ NPD study. However, compositions with >1.65 H f.u.−1 can only be observed in situ (i.e. at H2 pressure). The maximum H content in recovered NdGa hydride (under standard temperature and pressure conditions) has been consistently reported as ∼1.6 H f.u.−1 and henceforth this phase is termed NdGaH(D)1.6. The TDS and DSC results presented in Fig. 2 ▸(b) suggest a ‘two-step’ desorption process for NdGaH1.6 with maximum desorption rates at ∼523 and ∼723 K as proposed by Ångström et al. (2016 ▸). The temperature discrepancies between the two methods can be attributed to the fact that the TDS experiments were performed in a vacuum while the DSC experiments were done using an Ar atmosphere for which partial oxidation at higher temperatures might occur. The doublet feature of the first TDS peak is seen for both the hydride and the deuteride sample and appears to be independent of the heating rate (Ångström et al., 2016 ▸). This phenomenon will be addressed in more detail in the next section. The large temperature separation between the two desorption steps suggests that it should be possible to prepare the distinct monohydride phase NdGaH.
Figure 2.
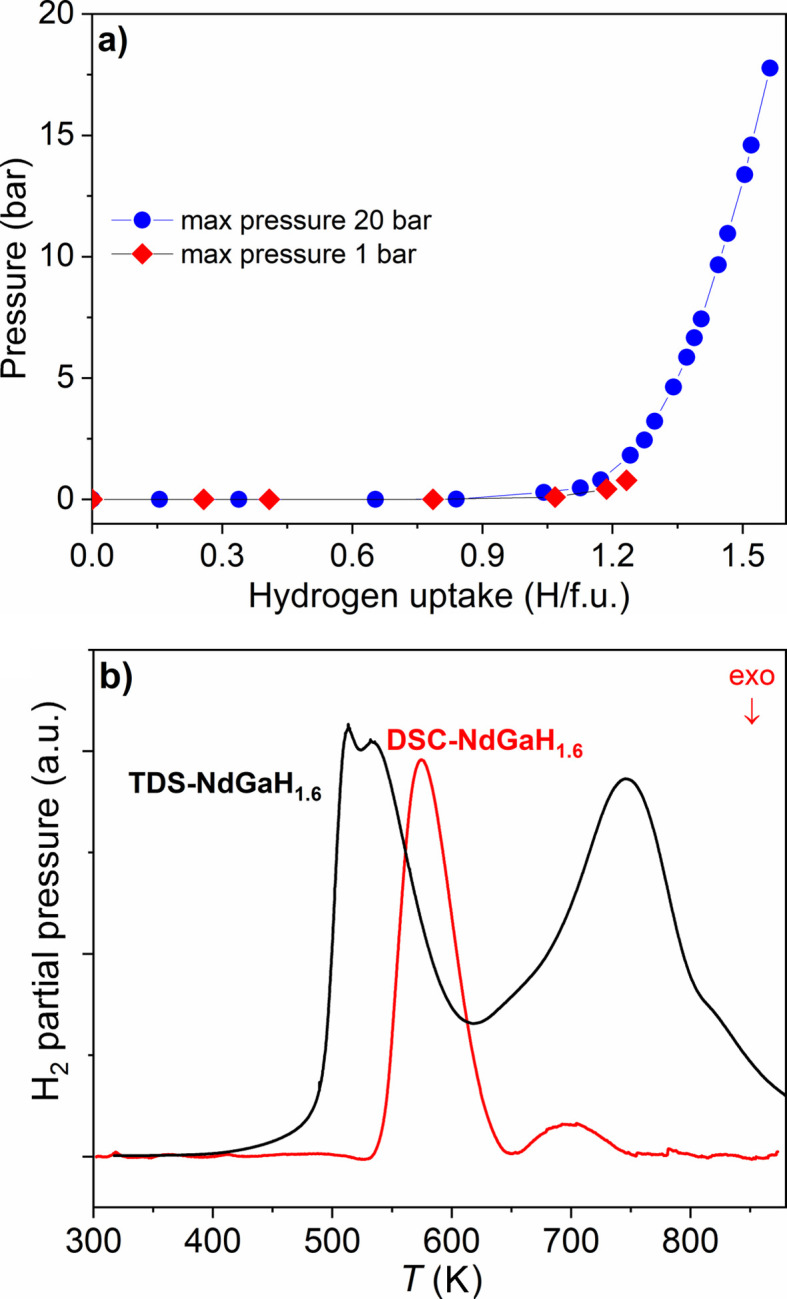
(a) PCI curves for NdGa at 573 K. (b) Combined TDS and DSC curves for NdGaH1.6.
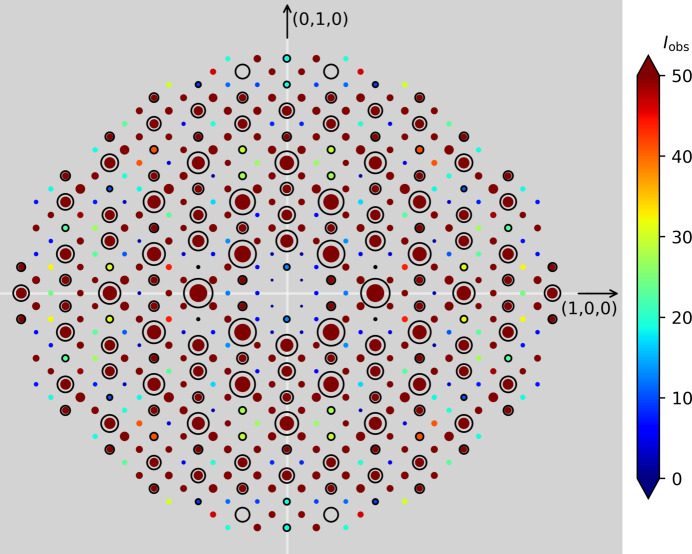
Interestingly, the single-crystalline nature of the Zintl-phase starting material is preserved after both hydrogenation and desorption for both the hydrides and the deuterides (Fig. S2), allowing conclusive SCXRD studies of both fully hydrogenated and partially desorbed samples. As previously described, the NPD study by Auer et al. (2019 ▸) found evidence of a threefold superstructure for NaGaD1.6 at 480 K and 98 bar D2 pressure, which corresponds to the LaGaH1.66 structure. From the PXRD and SCXRD patterns presented in Figs. 1 ▸(c) and 3 ▸ for NdGaH1.6, it can be concluded that this superstructure is maintained under ambient conditions. Thus, the monoclinic structure originally put forward for NdGaH(D)1.6 by Ångström et al. (2016 ▸) can be ruled out.
Figure 3.
Reconstructed reflections seen for a single crystal of NdGaH1.6. The size and color of the dots are correlated with the intensities. The circled reflections represent the CrB-type structure. As can be seen, in between two strong lines (with circles) there are two weaker lines of superstructure reflections related to the threefold structure.
In order to examine whether there are distinct intermediate hydride phases, as suggested by Auer et al. (2019 ▸), several controlled desorption experiments were performed using both DSC (Ar atmosphere, for hydrides) and TDS (vacuum, for deuterides) at various temperatures. The selection of temperatures for these experiments was based on the TDS peak evolution presented in Fig. 2 ▸(b). Desorption experiments up to 648 K in a dynamic vacuum, as described in the Experiment section, aimed at complete removal of the H atoms within the trigonal–bipyramidal Nd3Ga2 environment to produce the distinct stoichiometric phase NdGaH(D) [which was not achieved in the desorption experiment at 493 K by Auer et al. (2019 ▸)]. However, the hydrogen compositions of products obtained by partial desorption are uncertain and further characterization is needed to determine the hydrogen (deuterium) content. The NPD experiment on the sample NdGaD x prepared by desorption of NdGaD1.6 to 648 K revealed that the true composition is NdGaD0.9 and, on the basis of this result, it was assumed that the hydrogenated sample synthesized under identical conditions has the same composition. A more detailed analysis of the NPD results is presented in Section 3.3. To produce accurate compositions in the concentration range 1 < x < 1.6, NdGaH1.1 and NdGaH1.2 were synthesized in a Sievert-type apparatus acquiring PCI curves at low equilibrium pressures.
3.2. Crystal structure variations as a function of H content
Fig. 4 ▸ shows the crystal structures and summarizes the results from SCXRD experiments for NdGa, NdGaH0.9, NdGaH1.1, NdGaH1.2 and NdGaH1.6 (for which the H concentrations can be considered more or less reliable as discussed above). Details for the SCXRD-determined structures are presented in Tables 1 ▸ and 2 ▸.
Figure 4.
Crystal structures of (left) NdGa and (middle to right) its hydride phases NdGaH1.6−x (x < 0.5), NdGaH y (1 < y < 1.15) and NdGaH y (y < 1), respectively. Nd and Ga atoms are depicted as gray and red circles, respectively. H atoms and their metal coordination polyhedra are represented in green (trigonal–bipyramidal interstitial) and teal (tetrahedral interstitial). Light green indicates partial occupancy. Formation conditions for the hydride phases are indicated as arrows.
Table 1. Crystallographic data and experimental details of the structure determination for NdGaH x (x = 0–1.6) by single-crystal diffraction.
Experiments were carried out at 296 K with Mo Kα radiation. All compounds were found to have an orthorhombic structure with space group Cmcm (No. 63).
| Empirical formula | NdGa | NdGaH0.9 | NdGaH1.1 | NdGaH1.2 | NdGaH1.6 |
|---|---|---|---|---|---|
| CSD reference | 2265528 | 2265531 | 2265532 | 2265530 | 2265529 |
| Pearson symbol, Z | oC8, 4 | oC8, 4 | oC8, 4 | oC24, 12 | oC24, 12 |
| a (Å) | 4.4329 (12) | 4.1855 (6) | 4.1600 (3) | 12.3380 (6) | 12.332 (2) |
| b (Å) | 11.246 (3) | 11.914 (2) | 12.0374 (9) | 12.2710 (9) | 12.264 (2) |
| c (Å) | 4.1735 (11) | 4.1857 (6) | 4.1825 (3) | 4.1691 (2) | 4.1782 (7) |
| V (Å3) | 208.1 (1) | 208.7 (1) | 209.44 (3) | 631.2 (1) | 631.9 (2) |
| Calculated density ρ (g cm−3) | 6.83 | 6.81 | 6.79 | 6.75 | 6.75 |
| Absorption coefficient μ (mm−1) | 37.10 | 36.99 | 36.86 | 36.69 | 36.65 |
| θ range for data collection (°) | 3.623–31.719 | 3.420–31.609 | 3.385–32.069 | 2.341–32.472 | 2.342–39.415 |
| F(000) | 364 | 364 | 364 | 1092 | 1092 |
| Range in hkl | −6 ≤ h ≤ 6 | −5 ≤ h ≤ 6 | −6 ≤ h ≤ 5 | −18 ≤ h ≤ 18 | −21 ≤ h ≤ 21 |
| −15 ≤ k ≤ 16 | −17 ≤ k ≤ 16 | −17 ≤ k ≤ 17 | −18 ≤ k ≤ 14 | −21 ≤ k ≤ 21 | |
| −6 ≤ l ≤ 6 | −6 ≤ l ≤ 6 | −6 ≤ l ≤ 6 | −6 ≤ l ≤ 5 | −7 ≤ l ≤ 7 | |
| Total No. of reflections | 2217 | 1820 | 1779 | 7143 | 7329 |
| No. of independent reflections | 220 (R eq = 0.0296) | 221 (R eq = 0.0147) | 227 (R eq = 0.0289) | 635 (R eq = 0.0572) | 1070 (R eq = 0.0306) |
| No. of reflections with I > 2σ(I) | 187 (R sigma = 0.0180) | 220 (R sigma = 0.0091) | 214 (R sigma = 0.0182) | 511 (R sigma = 0.0325) | 919 (R sigma = 0.0217) |
| Data/parameters | 220/10 | 221/9 | 227/9 | 635/21 | 1070/21 |
| Goodness of fit on F 2 | 1.107 | 1.293 | 1.251 | 1.063 | 1.080 |
| Final R indices [I > 2σ(I)] | R 1 = 0.0147 | R 1 = 0.0105 | R 1 = 0.0156 | R 1 = 0.0276 | R 1 = 0.0295 |
| wR 2 = 0.0193 | wR 2 = 0.0256 | wR 2 = 0.0308 | wR 2 = 0.0510 | wR 2 = 0.0651 | |
| R indices (all data) | R 1 = 0.0225 | R 1 = 0.0107 | R 1 = 0.0179 | R 1 = 0.0470 | R 1 = 0.0376 |
| wR 2 = 0.0193 | wR 2 = 0.0257 | wR 2 = 0.0317 | wR 2 = 0.0567 | wR 2 = 0.0683 |
Table 2. Atomic coordinates and equivalent isotropic displacement parameters for NdGaH x (x = 0–1.6) from SCXRD at 296 K.
| Atom | Site | x | y | z | U eq × 100 (Å2) |
|---|---|---|---|---|---|
| NdGa | |||||
| Nd | 4c | 0 | 0.35806 (3) | 1/4 | 1.02 (1) |
| Ga | 4c | 0 | 0.07009 (6) | 1/4 | 1.13 (1) |
| NdGaH0.9 | |||||
| Nd | 4c | 0 | 0.34572 (2) | 1/4 | 0.77 (1) |
| Ga | 4c | 0 | 0.05794 (4) | 1/4 | 1.14 (1) |
| NdGaH1.1 | |||||
| Nd | 4c | 0 | 0.34524 (3) | 1/4 | 0.71 (1) |
| Ga | 4c | 0 | 0.05698 (7) | 1/4 | 1.00 (1) |
| NdGaH1.2 | |||||
| Nd1 | 4c | 0 | 0.33415 (5) | 1/4 | 0.71 (2) |
| Nd2 | 8g | 0.32999 (3) | 0.35426 (3) | 1/4 | 0.73 (1) |
| Ga1 | 4c | 0 | 0.05939 (10) | 1/4 | 0.83 (3) |
| Ga2 | 8g | 0.34928 (7) | 0.05844 (7) | 1/4 | 0.96 (2) |
| NdGaH1.6 | |||||
| Nd1 | 4c | 0 | 0.33632 (3) | 1/4 | 0.63 (1) |
| Nd2 | 8g | 0.33074 (2) | 0.35288 (2) | 1/4 | 0.60 (1) |
| Ga1 | 4c | 0 | 0.05919 (7) | 1/4 | 0.78 (2) |
| Ga2 | 8g | 0.34675 (6) | 0.05837 (6) | 1/4 | 0.99 (1) |
The crystal structure of the Zintl-phase NdGa features polyanionic zigzag chains of Ga atoms, which are formally in a reduced Ga3− state and thus singly bonded, while carrying two lone electron pairs that are hosted in the px and sp 2 orbitals. The chains run along the crystallographic c direction and are embedded in slabs of trigonal prisms formed by the Nd atoms which run along the a direction (Hyde & Andersson, 1989 ▸). The two types of voids for H, tetrahedral H@Nd4 and trigonal–bipyramidal H@Nd3Ga2, are 4c (0, ∼¾, ¼) and 4c (0, ∼0.55, ¼), respectively.
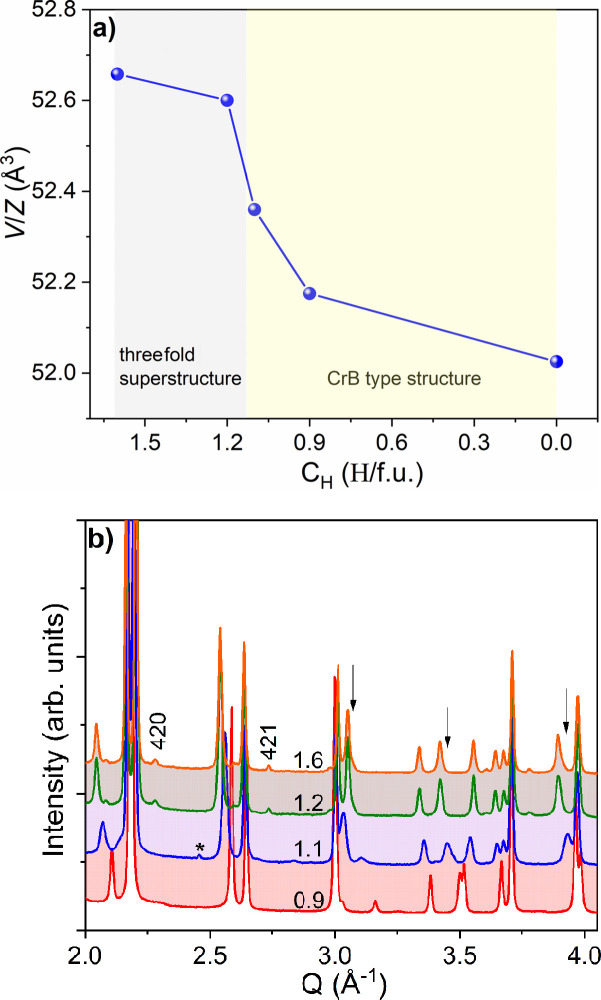
Hydrogenation of NdGa at pressures above 20 bar results in the formation of NdGaH1.6, where the a axis of the initial CrB-type structure is tripled (a = 3a CrB) while the Cmcm space group type symmetry is maintained. The tetrahedral voids of the CrB-type structure are completely filled (positions H1 and H2 in Fig. 4 ▸) and two-thirds of the trigonal–bipyramidal voids are filled in an orderly fashion (position H3 in Fig. 4 ▸). The b lattice parameter of NdGaH1.6 is increased by 9% compared with that of NdGa [from 11.246 (3) to 12.264 (2) Å], whereas a/3 is decreased by 1.8% (from 4.186 to 4.111 Å) and the c parameter (i.e. along the direction of the Ga chains) is hardly influenced (∼4.17 Å, cf. Table 2 ▸). As a consequence, the volume per formula unit (V/Z) increases by just 1%, from 52.1 to 52.6 Å3. Remarkably, the lattice parameters (and volume) of NdGaH1.2 are very similar to those of NdGaH1.6, as can be seen in Fig. 5 ▸(a), which presents a comparison of the volumes of the different phases (x = 0, 0.9, 1.1, 1.2 and 1.6). Below 1.2 H f.u.−1 hydrogenated NdGa adopts the CrB-type structure (i.e. the 1a structure). The evolution of the PXRD patterns from 1.6 to 0.9 H f.u.−1 is presented in Fig. 5 ▸(b) which, together with Fig. 5 ▸(a), provides insights into the boundaries between the different structures. For NdGaH1.1 the 3a superstructure reflections are absent, while the main reflections appear significantly broadened. Refinement of the PXRD pattern as a two-phase mixture (Fig. S3) gives slightly improved discrepancy values (R wp), indicating heterogeneity of the NdGaH1.1 sample. We note that the NdGaH1.1 phase obtained by PCI at low pressure compares well to the NdGaD1.11 phase obtained by Auer et al. (2019 ▸) from desorption of NdGaD1.6 at 493 K (1 h, vacuum). The lattice parameters are also comparable: a = 4.1656 (3) Å, b = 12.0336 (9) Å and c = 4.1858 (2) Å for NdGaH1.1 versus a = 4.1600 (3) Å, b = 12.0374 (9) Å and c = 4.1825 (3) Å for NdGaD1.11. However, the PXRD and SCXRD data show no evidence of the 2a superstructure as proposed by Auer et al. (2019 ▸). The boundary for the 1a–3a structural change is assumed to be around 1.15 H f.u.−1.
Figure 5.
(a) V/Z versus H f.u.−1 for hydrides with known H content. (b) A comparison of patterns, with broader peaks for NdGaH1.1. The labels 420 and 421 are superstructure reflections, arrows show broadened peaks, and the asterisk (*) indicates the impurity of TaGaO4.
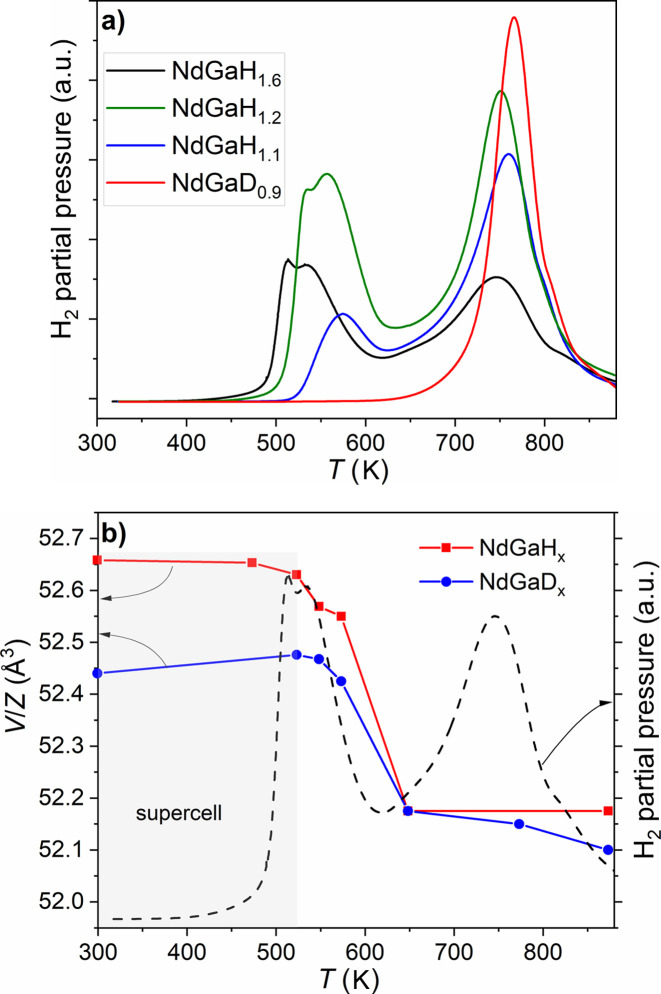
Fig. 6 ▸(a) summarizes the results from the desorption experiments where the thermal desorption spectra of NdGaH1.6, NdGaH1.2, NdGaH1.1 and NdGaD0.9 are compared. As already mentioned, the first peak in the spectrum of NdGa1.6 exhibits a doublet feature which is present for both samples where only the threefold supercell structure of the hydride is present. However, NdGaH1.1 does not exhibit any clear doublet feature even though a desorption event is still present in this temperature region. The TDS spectrum for NdGaD0.9, which has the 1a structure, exhibits a single desorption step in the same temperature range as the second desorption step for NdGaH1.6, NdGaH1.2 and NdGaH1.1. The SCXRD, PXRD and TDS data together suggest that the first peak is associated with desorption of H from the trigonal–bipyramidal interstitials, while the second peak is associated with desorption from the tetrahedral interstitials. Consequently, the doublet feature mirrors a two-step desorption of H from the trigonal–bipyramidal interstitials, corresponding initially to desorption from the phase with the 3a superstructure until the estimated boundary at around 1.15 H f.u.−1 and consecutively from the phase with the 1a structure. Additionally, one should note that the onset temperatures of desorption for the NdGaH1.6, NdGaH1.2 and NdGaH1.1 samples are different, which implies higher stability of the 1a hydride structure.
Figure 6.
(a) TDS spectra and (b) V/Z versus T plots showing the region where the supercell exists. NdGaH1.1 is a two-phase sample with 1a and 3a unit cells, while NdGaH1.6 is 3a phase sample. T = 523 K is the last temperature which results in a 3a structure, while desorption at 573 K results in a 1a structure.
Fig. 6 ▸(b) illustrates the V/Z values of phases obtained from DSC (hydrides) and TDS (deuterides) desorption experiments at various temperatures across the first and second desorption peaks. The H(D) contents of these phases are uncertain but the 648 K sample has 0.9 H(D) f.u.−1, which was determined using NPD. From PXRD, the temperature boundary for the 3a–1a structural change was determined to be around 523 K [Figs. 6(a) and S4]. This coincides well with the center of the doublet feature in the TDS spectrum. Systematically larger cell volumes were observed for the hydrides than for the corresponding deuterides. However, both hydrides and deuterides exhibit similar changes in their cell parameters with respect to temperature.
A detailed study of the structural evolution during hydrogen desorption was carried out by in situ SRPXRD experiments on NdGaH1.6 during desorption in a vacuum. A selected region of the SRPXRD map together with the V/Z data and the TDS spectrum for NdGaH1.6 are presented in Fig. 7 ▸. From room temperature up to 473 K there is a linear increase in the volume due to thermal expansion. Above 473 K V/Z drops sharply, indicating the start of desorption, which coincides with the onset of the first desorption peak in the TDS spectrum (lower panel of Fig. 7 ▸). The superlattice reflection 421 disappears at around 493 K, accompanied by a discontinuous change in the 041 peak. This further indicates that the first peak of the doublet on the TDS curve correlates with the disappearance of the superlattice peaks due to desorption. However, the second peak of the doublet is the beginning of desorption from the saturated hydride with the 1a structure. Furthermore, at this temperature two pairs of main peaks (330 and 311, and 151 and 600) start to overlap, showing further changes in the structure (shrinking of the unit cell due to hydrogen release). Above 493 K only peaks related to the CrB-type structure are present, although they continue to change due to the ongoing desorption process. At around 773 K the two peak pairs (330 and 311, and 151 and 600) split and can once again be resolved. At around 873 K the 041 and 331 peaks start to overlap, coinciding with the end of desorption. After completion of desorption the volume increases linearly with temperature. The TDS and SRPXRD data show good agreement.
Figure 7.
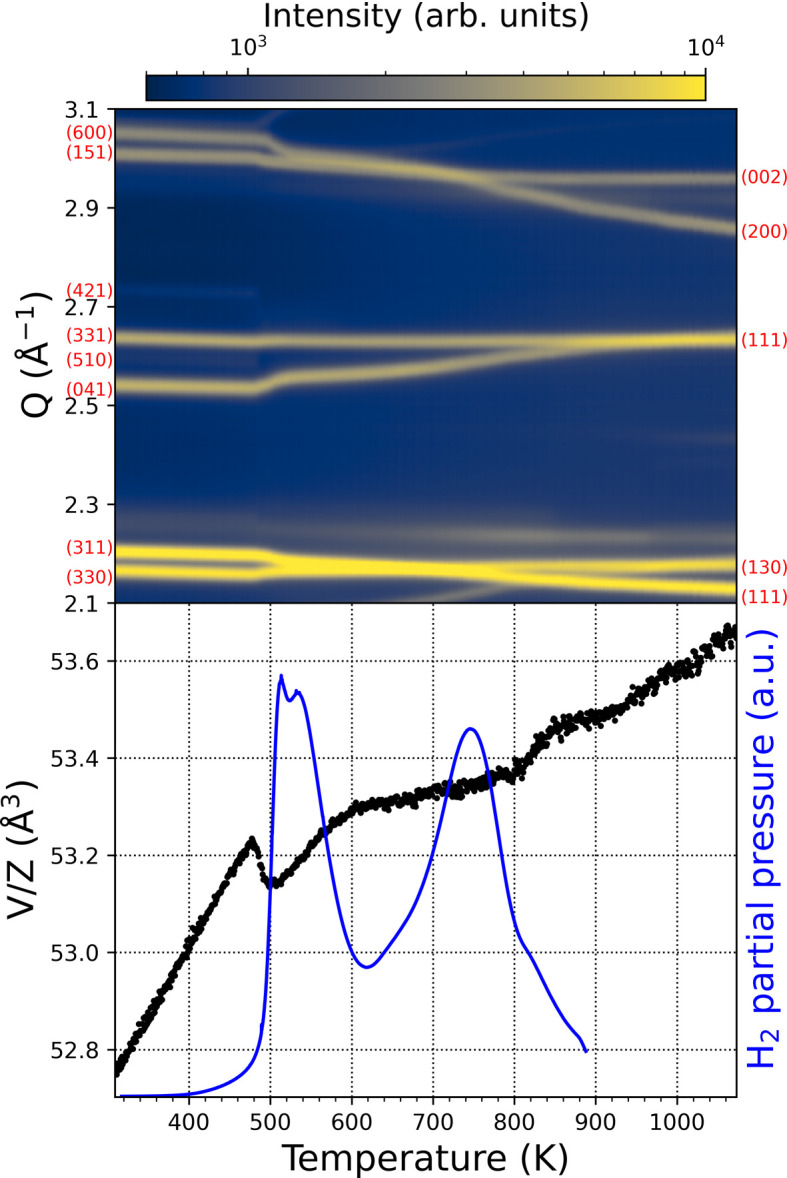
(Top) Selected region of the in situ SRPXRD map. The white star indicates the disappearance of the superlattice peak 421. (Bottom) V/Z with the TDS spectrum for NdGaH1.6.
To summarize, the X-ray diffraction and desorption experiments suggest the existence of the NdGaH(D) x (1.6 ≥ x ≥ 1.2) phase with the 3a superstructure and the NdGaH(D) y (1.1 ≥ y ≥ 0.9) phase with the 1a structure (CrB-type structure). The compositions with y = 1.1 and 0.9 correspond to weakly occupied trigonal–bipyramidal interstitials and weakly depleted tetrahedral interstitials, respectively (Fig. 4 ▸). The 1a structured phase NdGdH1.1 represents both the product of the initial absorption (H getter behavior of NdGa) and the product after the first desorption step.
3.3. Crystal structures of NdGaD1.6 and NdGaD0.9 from NPD at 20 K
To determine the H(D) positions and occupancies in NdGaH(D) x accurately, NPD experiments were performed for two samples with nominal compositions NdGaD and NdGaD1.6 at 20 K and ambient pressure. Rietveld refinements of the NPD data revealed that the true compositions of the samples are NdGaD0.9 and NdGaD1.6. The refinements of the NPD data from detector bank 3 are presented in Fig. 8 ▸ for NdGaD0.9 and NdGaD1.6, while the structural parameters obtained from the refinements are presented in Table 3 ▸. For NdGaD1.6 a 3a supercell is found, as previously reported by Auer et al. (2019 ▸) for NdGaD1.66 at 480 K and 98 bar D2 pressure. Furthermore, the observed 3a superstructure is in good agreement with the findings from the PXRD and SCXRD results presented in Section 3.1 for NdGaH1.6. In the superstructure there are a total of three deuterium positions, where D1 and D2 are tetrahedral interstitials while D3 is a trigonal–bipyramidal interstitial (Fig. 4 ▸). As for the PXRD and SCXRD experiments, no supercell is observed in the NPD experiment for NdGaD0.9. This is also in good agreement with the NPD results from Auer et al. (2019 ▸), who concluded that there is no supercell for NdGaD1.11, NdGaD1.16 and NdGaD1.22. However, contrary to their results which suggest that NdGaD1.11, NdGaD1.16 and NdGaD1.22 have two deuterium positions, the NPD results presented here show that NdGaD0.9 only exhibits a single deuterium position with the D atom as a tetrahedral interstitial (Fig. 4 ▸ and corresponding Fourier difference maps in Fig. S5). The discrepancy between the study by Auer and co-workers and the results presented here could be related to the presence of unidentified impurities in the samples used by (Auer et al., 2019 ▸), together with contamination of the NPD patterns from scattering from the sample environment, which probably limited their NPD analysis. Last but not least, the experimental conditions here (ex situ NPD) and in the previous work (in situ NPD) are different. Comparing the PXRD, SCXRD and NPD results, it can be concluded that in the studied temperature range neither NdGaD0.9 nor NdGaD1.6 exhibits any structural phase changes, suggesting that the changes from the 3a to the 1a cell are only related to the hydrogen (deuterium) content.
Figure 8.
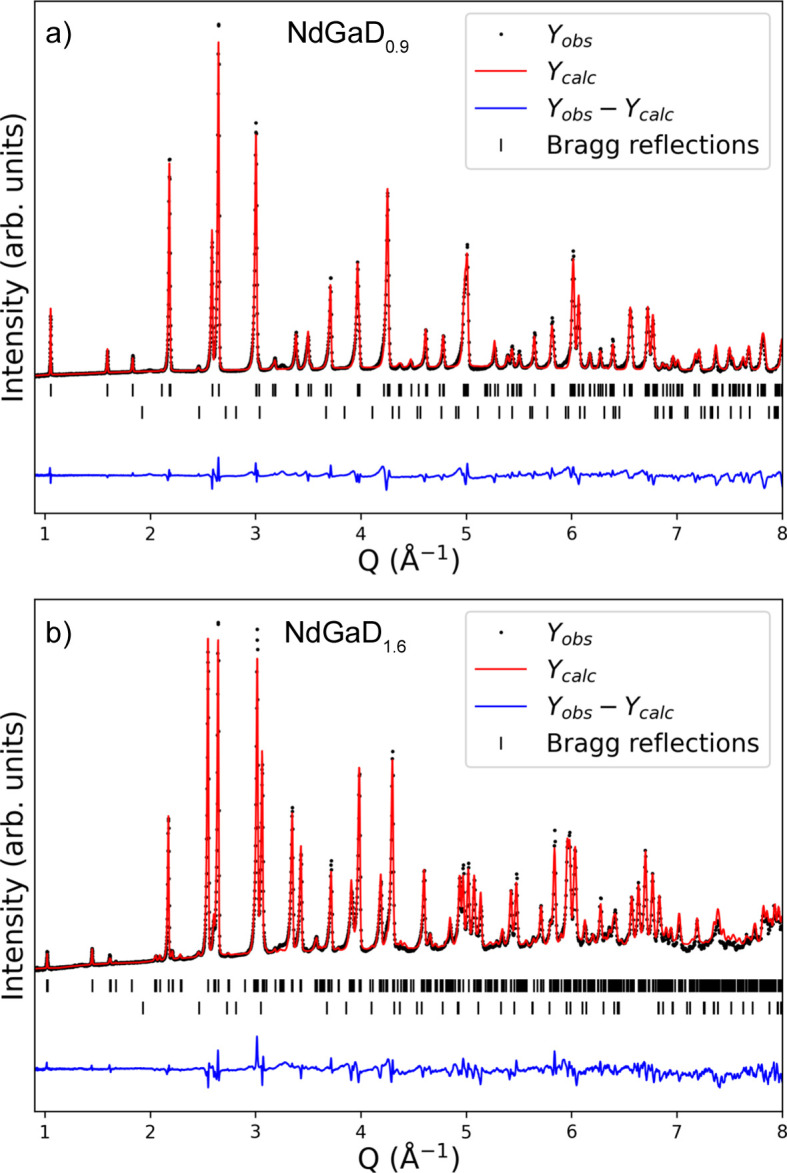
Rietveld refinement of (a) NdGaD0.9 and (b) NdGaD1.6 from the 90° detector bank 3 at 20 K with R wp = 6.00 and 6.03%, respectively. The bottom rows of Bragg reflections correspond to a secondary phase, TaGaO4 (0.5%).
Table 3. Crystallographic data and structure refinement for NdGaD0.9 and NdGaD1.6 (both space group Cmcm, No. 63), fractional atomic coordinates, site occupancy factor (SOF) and atomic displacement parameters at 20 K.
Values refer to data from WISH detector bank 3 at 2θ = 90°.
| Atom | Site | x | y | z | SOF | U eq × 100 (Å2) |
|---|---|---|---|---|---|---|
| NdGaD0.9, a = 4.1736 (9) Å, b = 11.916 (3) Å, c = 4.1816 (9) Å, V = 208.0 (7) Å3 and R Bragg = 5.38 | ||||||
| Nd | 4c | 0 | 0.3449 (2) | 1/4 | 1 | 0.45 (1) |
| Ga | 4c | 0 | 0.0568 (1) | 1/4 | 1 | 0.65 (1) |
| D | 4c | 0 | 0.7485 (1) | 1/4 | 0.91 (1) | 1.7 (4) |
| NdGaD1.6, a = 12.297 (3) Å, b = 12.221 (3) Å, c = 4.1619 (8) Å, V = 625.4 (5) Å3 and R Bragg = 8.48 | ||||||
| Nd1 | 4c | 0 | 0.3550 (9) | 1/4 | 1 | 1.28 (4) |
| Nd2 | 8g | 0.33381 (9) | 0.35211 (6) | 1/4 | 1 | 0.41 (2) |
| Ga1 | 4c | 0 | 0.0560 (1) | 1/4 | 1 | 1.08 (4) |
| Ga2 | 8g | 0.34728 (6) | 0.06052 (8) | 1/4 | 1 | 1.28 (3) |
| D1 | 4c | 0 | 0.7498 (1) | 1/4 | 1 | 3.5 (6) |
| D2 | 8g | 0.1682 (1) | 0.24893 (9) | 1/4 | 1 | 3.0 (3) |
| D3 | 8g | 0.18670 (9) | 0.05154 (8) | 1/4 | 0.890 (2) | 3.5 (3) |
As mentioned above, the D atoms occupy the tetrahedral interstitials surrounded by four Nd atoms in the NdGaD0.9 phase, while the trigonal–bipyramidal interstitial positions are empty. The D—Nd distances are close to equidistant, 2.368 (1) Å (×2) and 2.382 (1) Å (×2), i.e. the tetrahedra remain largely undistorted upon hydrogenation of the tetrahedral interstitials. The Ga—Ga distance in NdGaD0.9 is 2.491 (1) Å at 20 K (Table 4 ▸), which is drastically reduced compared with NdGa [2.625 (1) Å at room temperature]. This reduction in the Ga—Ga distance was described earlier and is attributed to the development of π-bonding within the Ga zigzag chain. The introduction of H into the tetrahedral interstitials as H− formally leads to oxidation of the singly bonded zigzag chain formed by the Ga3− species, upon which the antibonding part of the π(px –px ) band is emptied. A phase width of NdGaH1±y towards hydrogen-poor compositions has previously been questioned by Auer et al. (2019 ▸). However, it appears that harsh desorption conditions, especially upon application of temperatures above 623 K, can achieve hydrogen-poor phases such as NdGaH1−y , although the extent of this phase width is currently unknown.
Table 4. Relevant interatomic distances in NdGaD0.9 and NdGa1.6, T = 20 K, with estimated standard deviations in parentheses.
| NdGaD0.9 | NdGaD1.6 | ||||||
|---|---|---|---|---|---|---|---|
| Atom pair | d(Å) | Atom pair | d(Å) | ||||
| D1 | Nd1 | ×2 | 2.368 (1) | D1 | Nd1 | ×2 | 2.327 (1) |
| Nd1 | ×2 | 2.382 (1) | Nd2 | ×2 | 2.396 (1) | ||
| Ga1 | Ga1 | ×2 | 2.491 (1) | D2 | Nd1 | 2.323 (1) | |
| Nd2 | 2.395 (2) | ||||||
| Nd2 | ×2 | 2.420 (1) | |||||
| D3 | Ga2 | 1.978 (1) | |||||
| Ga1 | 2.296 (1) | ||||||
| Nd2 | ×2 | 2.404 (1) | |||||
| Nd2 | 2.450 (1) | ||||||
| Ga1 | D3 | ×2 | 2.296 (1) | ||||
| Ga1 | ×2 | 2.490 (1) | |||||
| Ga2 | D3 | 1.978 (1) | |||||
| Ga2 | ×2 | 2.553 (1) | |||||
The tetrahedral environment of D in NdGaD1.6 is more irregular than that of NdGaD0.9, with D—Nd distances of 2.327 (1) Å (×2) and 2.396 (1) Å (×2) for D1 [average 2.362 (1) Å] and 2.323 (1) Å, 2.395 (2) Å and 2.420 (1) Å (×2) for D2 [average 2.389 (1) Å]. Most interesting is the irregular trigonal–bipyramidal environment of D3 and the different Ga—Ga distances within the zigzag chains, highlighted in Fig. 9 ▸. The ordered two-thirds occupation of the trigonal–bipyramidal voids in NdGaD1.6 (by D3 atoms) implies two crystallographically different zigzag chains, one formed by Ga1 atoms which are coordinated by two D3 atoms (central chain) and one formed by Ga2 atoms which are only coordinated by one D3 atom (peripheral chains). The Ga—Ga distance within the central chains is 2.490 (1) Å (which is similar to that in NdGaD0.9), while the Ga—Ga distance within the peripheral chains is substantially elongated [2.553 (1) Å]. The longest Ga—H bonds still being considered single bonds are around 1.7 Å [as in SrGa2H2 and AEGaTtH; AE = Ca, Sr, Ba; Tt = Si, Ge, Sn (Häussermann, 2008 ▸)], which is substantially shorter than the Ga—D3 distance in NdGaD1.6 [Ga2—D3 = 1.978 (1) Å and Ga1—D3 = 2.296 (1) Å]. Yet a distance of 1.978 Å still suggests a covalent Ga—H bonding interaction, albeit weak, which would engage the Ga2 px orbital. Thus π(px –px ) bonding within the peripheral zigzag chains is weakened, whereas π-bonding within the central chains remains largely unperturbed (and thus similar to that in NdGaD0.9).
Figure 9.
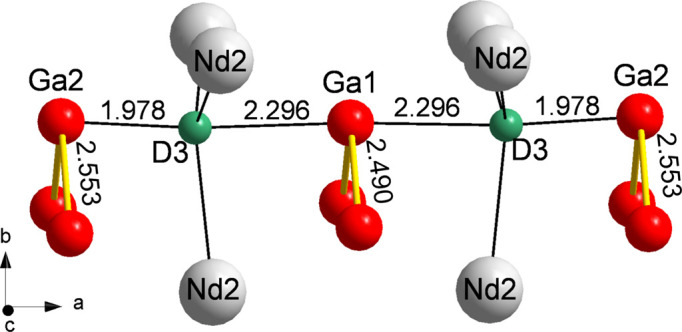
A segment of the NdGaD1.6 structure, showing the coordination of D3 atoms in Nd3Ga2 trigonal–bipyramidal interstitials and the zigzag chains formed by Ga atoms.
There are a few more REGaH(D) x phases reported with Cmcm 3a superstructures: GdGaH1.66 (theoretically predicted) (Nedumkandathil et al., 2016 ▸), LaGaD1.63 (Werwein et al., 2019 ▸) and TmGaD0.93 (Werwein et al., 2019 ▸). For TmGaD0.93 (Werwein et al., 2019 ▸), the trigonal–bipyramidal interstitials are not occupied by D atoms, yet a threefold superstructure is realized. Thus, further investigation of REGaH x and especially TmGaD0.9−x would bring a deeper understanding of the hydrides of Zintl phases as well as their hydrogen-induced property changes.
4. Conclusion
The reinvestigation of the hydrogenation behavior of orthorhombic NdGa with a Cmcm CrB-type structure and the desorption behavior of its hydrides NdGaH x has led to the unambiguous identification of two distinct phases.
(i) NdGaH(D) x (1.6 ≥ x ≥ 1.2) adopts the Cmcm LaGaH1.66-type structure, which is a threefold (3a) superstructure with respect to the initial CrB-type structure. The H(D) atoms are located in fully occupied tetrahedral interstitials H@Nd4 and flexibly occupy trigonal–bipyramidal interstitials H@Nd3Ga2 (0.15 < site occupancy factor ≤ 1).
(ii) NdGaH(D) y (1.1 ≥ y ≥ 0.9) adopts the unit cell of the (1a) CrB-type structure of the parent compound NdGa. The hydrogen-rich phase presents weakly occupied trigonal–bipyramidal interstitials and fully occupied tetrahedral interstitials, while the hydrogen-poor phase exhibits no trigonal–bipyramidal interstitials and a weak depletion of the tetrahedral interstitials.
As a result of the multistep desorption occurring over a wide temperature range, these phases can be separated by partial desorption, making it possible to study in detail the hydrogen- and structure-induced property changes observed for several Zintl phases.
Supplementary Material
Crystal structure: contains datablock(s) NdGa, NdGaH0.9, NdGaH1.1, NdGaH1.2, NdGaH1.6. DOI: 10.1107/S1600576724000554/nb5371sup1.cif
Structure factors: contains datablock(s) NdGa. DOI: 10.1107/S1600576724000554/nb5371NdGasup2.hkl
Structure factors: contains datablock(s) NdGaH0.9. DOI: 10.1107/S1600576724000554/nb5371NdGaH0.9sup3.hkl
Structure factors: contains datablock(s) NdGaH1.1. DOI: 10.1107/S1600576724000554/nb5371NdGaH1.1sup4.hkl
Structure factors: contains datablock(s) NdGaH1.2. DOI: 10.1107/S1600576724000554/nb5371NdGaH1.2sup5.hkl
Structure factors: contains datablock(s) NdGaH1.6. DOI: 10.1107/S1600576724000554/nb5371NdGaH1.6sup6.hkl
Additional figures. DOI: 10.1107/S1600576724000554/nb5371sup7.pdf
Acknowledgments
The authors acknowledge Myfab Uppsala for providing facilities. We also acknowledge DESY (Hamburg, Germany), a member of the Helmholtz Association HGF, and ISIS Neutron and Muon Source (Didcot, UK) for the provision of experimental facilities. Parts of this research were carried out at PETRA III and we thank Volodymyr Baran for assistance in using beamline P02.1. Synchrotron beamtime was allocated for proposal I-20191465 EC and neutron beam time for RB2220206.
Funding Statement
The following funding is acknowledged: Foundation for Strategic Research (SSF) (grant No. EM16-0039); Stiftelsen Åforsk (grant No. 21-196 to Vitalii Shtender, grant No. 21-453 to Mikael S. Andersson and grant No. 22-378 to Johan Cedervall). Myfab is funded by the Swedish Research Council as a national research infrastructure. Gustav Ek acknowledges funding from the E. and K. G. Lennanders Foundation. Mikael S. Andersson acknowledges support from the Göran Gustafsson Foundation.
References
- Ångström, J., Johansson, R., Sarkar, T., Sørby, M. H., Zlotea, C., Andersson, M. S., Nordblad, P., Scheicher, R. H., Häussermann, U. & Sahlberg, M. (2016). Inorg. Chem. 55, 345–352. [DOI] [PubMed]
- Auer, H., Guehne, R., Bertmer, M., Weber, S., Wenderoth, P., Hansen, T. C., Haase, J. & Kohlmann, H. (2017). Inorg. Chem. 56, 1061–1071. [DOI] [PubMed]
- Auer, H., Nedumkandathil, R., Häussermann, U. & Kohlmann, H. (2019). Z. Anorg. Allge. Chem. 645, 175–181.
- Bruker (2016). APEX3. Bruker AXS Inc., Madison, Wisconsin, USA.
- Chapon, L. C., Manuel, P., Radaelli, P. G., Benson, C., Perrott, L., Ansell, S., Rhodes, N. J., Raspino, D., Duxbury, D., Spill, E. & Norris, J. (2011). Neutron News, 22(2), 22–25.
- Coelho, A. A. (2018). J. Appl. Cryst. 51, 210–218.
- Dwight, A. E., Downey, J. W. & Conner, R. A. (1967). Acta Cryst. 23, 860–862.
- Ek, G., Nedumkandathil, R., Johansson, R., Montero, J., Zlotea, C., Andersson, M. S., Nordblad, P., Tang, C., Sahlberg, M. & Häussermann, U. (2019). J. Solid State Chem. 277, 37–45.
- Filik, J., Ashton, A. W., Chang, P. C. Y., Chater, P. A., Day, S. J., Drakopoulos, M., Gerring, M. W., Hart, M. L., Magdysyuk, O. V., Michalik, S., Smith, A., Tang, C. C., Terrill, N. J., Wharmby, M. T. & Wilhelm, H. (2017). J. Appl. Cryst. 50, 959–966. [DOI] [PMC free article] [PubMed]
- Häussermann, U. (2008). Z. Kristallogr. 223, 628–635.
- Haussermann, U., Kranak, V. F. & Puhakainen, K. (2011). Struct. Bond. 139, 143–161.
- Höglin, V., Ångström, J., Andersson, M. S., Balmes, O., Nordblad, P. & Sahlberg, M. (2015). Results Phys. 5, 53–54.
- Hyde, B. G. & Andersson, S. (1989). Inorganic Crystal Structures. New York: Wiley.
- Jensen, T. R., Nielsen, T. K., Filinchuk, Y., Jørgensen, J.-E., Cerenius, Y., Gray, E. M. & Webb, C. J. (2010). J. Appl. Cryst. 43, 1456–1463. [DOI] [PMC free article] [PubMed]
- Krause, L., Herbst-Irmer, R., Sheldrick, G. M. & Stalke, D. (2015). J. Appl. Cryst. 48, 3–10. [DOI] [PMC free article] [PubMed]
- Manory, R., Pelleg, J. & Grill, A. (1978). J. Less-Common Met. 61, 293–299.
- Nedumkandathil, R., Kranak, V. F., Johansson, R., Ångström, J., Balmes, O., Andersson, M. S., Nordblad, P., Scheicher, R. H., Sahlberg, M. & Häussermann, U. (2016). J. Solid State Chem. 239, 184–191.
- Okamoto, H. (1990). Binary Alloy Phase Diagrams 2, 1829–1831.
- Rietveld, H. M. (1969). J. Appl. Cryst. 2, 65–71.
- Rodriguez-Carvajal, J., Roisnel, T., Daoud-Aladine, A. & Bouvet, A. (1999). Acta Cryst. A55, C262–C263.
- Sheldrick, G. M. (2015a). Acta Cryst. A71, 3–8.
- Sheldrick, G. M. (2015b). Acta Cryst. C71, 3–8.
- Shtender, V. V., Paul-Boncour, V., Riabov, A. B., Denys, R. V. & Zavaliy, I. Y. (2015). J. Solid State Chem. 229, 135–140.
- Villars, P., Okamoto, H. & Cenzual, K. (2018). Editors. ASM Alloy Phase Diagrams Center. ASM International, Materials Park, Ohio, USA.
- Werwein, A., Auer, H., Kuske, L. & Kohlmann, H. (2018). Z. Anorg. Allge. Chem. 644, 1532–1539.
- Werwein, A., Hansen, T. C. & Kohlmann, H. (2019). Crystals, 9, 600.
- Yatsenko, S. P., Semyannikov, A. A., Semenov, B. G. & Chuntonov, K. A. (1979). J. Less-Common Met. 64, 185–199.
Associated Data
This section collects any data citations, data availability statements, or supplementary materials included in this article.
Supplementary Materials
Crystal structure: contains datablock(s) NdGa, NdGaH0.9, NdGaH1.1, NdGaH1.2, NdGaH1.6. DOI: 10.1107/S1600576724000554/nb5371sup1.cif
Structure factors: contains datablock(s) NdGa. DOI: 10.1107/S1600576724000554/nb5371NdGasup2.hkl
Structure factors: contains datablock(s) NdGaH0.9. DOI: 10.1107/S1600576724000554/nb5371NdGaH0.9sup3.hkl
Structure factors: contains datablock(s) NdGaH1.1. DOI: 10.1107/S1600576724000554/nb5371NdGaH1.1sup4.hkl
Structure factors: contains datablock(s) NdGaH1.2. DOI: 10.1107/S1600576724000554/nb5371NdGaH1.2sup5.hkl
Structure factors: contains datablock(s) NdGaH1.6. DOI: 10.1107/S1600576724000554/nb5371NdGaH1.6sup6.hkl
Additional figures. DOI: 10.1107/S1600576724000554/nb5371sup7.pdf


