

Abstract
When compared with other phylogroups (PGs) of the Pseudomonas syringae species complex, P. syringae pv. syringae (Pss) strains within PG2 have a reduced repertoire of type III effectors (T3Es) but produce several phytotoxins. Effectors within the cherry pathogen Pss 9644 were grouped based on their frequency in strains from Prunus as the conserved effector locus (CEL) common to most P. syringae pathogens; a core of effectors common to PG2; a set of PRUNUS effectors common to cherry pathogens; and a FLEXIBLE set of T3Es. Pss 9644 also contains gene clusters for biosynthesis of toxins syringomycin, syringopeptin and syringolin A. After confirmation of virulence gene expression, mutants with a sequential series of T3E and toxin deletions were pathogenicity tested on wood, leaves and fruits of sweet cherry (Prunus avium) and leaves of ornamental cherry (Prunus incisa). The toxins had a key role in disease development in fruits but were less important in leaves and wood. An effectorless mutant retained some pathogenicity to fruit but not wood or leaves. Striking redundancy was observed amongst effector groups. The CEL effectors have important roles during the early stages of leaf infection and possibly acted synergistically with toxins in all tissues. Deletion of separate groups of T3Es had more effect in P. incisa than in P. avium. Mixed inocula were used to complement the toxin mutations in trans and indicated that strain mixtures may be important in the field. Our results highlight the niche‐specific role of toxins in P. avium tissues and the complexity of effector redundancy in the pathogen Pss 9644.
Keywords: comparative genomics, mutagenesis, phytotoxins, Prunus, Pseudomonas syringae, type 3 effectors, virulence
Toxins play a key role in fruit and a complex redundancy of effectors acts in the Pseudomonas syringae pv. syringae–cherry interaction. Mixed inocula suggest synergistic interactions of strains in nature for disease development.

1. INTRODUCTION
Bacterial pathogenicity to plants has, for many diseases, been closely linked to the injection of effector proteins into plant cells through the type III secretion system (T3SS) (Lovelace et al., 2023). T3SS‐secreted effectors (T3Es) produced by plant pathogens are now recognized to have key roles in the suppression of host defences and in the creation of conditions in plants that benefit microbial colonization (Ekanayake et al., 2022; Lovelace & Ma, 2022; Nomura et al., 2023; Xin et al., 2018). Genes encoding T3Es were originally cloned not by their virulence function but by their ability to act as avirulence (avr) genes whose products triggered the hypersensitive resistance reaction through a defence response now known as effector‐triggered immunity (ETI; Jones & Dangl, 2006; Staskawicz et al., 1984). Their ability to suppress ETI and also localized defence responses triggered by microbe‐associated molecular patterns (MAMPs) such as flagellin (MAMP‐triggered immunity, MTI) was not discovered until much later research (Hauck et al., 2003; Jackson et al., 1999; Jones & Dangl, 2006).
There are now several examples of T3Es that have individually been identified as being required for pathogenicity in bacterial plant pathogens, for example, VirPphA (also known as HopAB1) in Pseudomonas syringae pv. phaseolicola (Pph; Jackson et al., 1999), DspA/E in Erwinia amylovora (Bogdanove et al., 1998; Yuan et al., 2021) and AvrE, AvrPtoB and AvrPto in strains of P. syringae pv. tomato (Pto; Xin et al., 2018). However, deletion of a single effector more often fails to reduce disease following artificial inoculation. The presence of redundant effector groups (REGs) was clarified by the landmark studies on Pto strain DC3000 by Collmer and colleagues (Cunnac et al., 2011; Kvitko et al., 2009; Wei & Collmer, 2018). Deletion of individual effectors from REGs did not cause a loss of pathogenicity, leading to the description of effectors as “collectively essential but individually dispensable” (Kvitko et al., 2009).
The conserved effector locus (CEL), containing two to four effector genes hopAA1, avrE1, hopM1 and hopN1, has emerged as an important common determinant of pathogenicity to leaves in several strains of Pto and P. syringae pv. actinidiae (Psa) (Alfano et al., 2000; Dillon et al., 2019; Jayaraman et al., 2020). Certain effectors have been assigned functions for promotion of symptom formation rather than the promotion of initial bacterial colonization, for example, HopAM1‐1, HopG1 and HopM1 in Pto DC3000 (Badel et al., 2006; Cunnac et al., 2011). In addition to effector proteins, many strains of P. syringae also secrete a second class of pathogenicity factors, low molecular weight phytotoxins. These compounds, such as coronatine, phaseolotoxin and syringomycin, also have key roles in symptom production but are not always required for bacterial multiplication in planta (Bender et al., 1999; Geng et al., 2014; Scholz‐Schroeder et al., 2001).
P. syringae is an example of a species complex within which pathogenicity to certain host plants has been linked through bioinformatic analyses to the presence of specific T3E repertoires (Baltrus et al., 2017; Newberry et al., 2019). A good example of this is the economically important bacterial canker disease of Prunus. The main causal agents of cherry canker are members of different phylogroups amongst the 13 that currently classify the total genetic diversity of P. syringae (Berge et al., 2014): P. syringae pv. morsprunorum (Psm) races 1 (in phylogroup [PG] 3) and 2 (PG1) and P. syringae pv. syringae (Pss, PG2). Despite their differential core genomes, comparative genomics using BayesTraits analysis has identified convergent patterns of gain and loss of effectors associated with clades of P. syringae causing canker, notably the gain of hopAR1, hopBB1, hopBF1 and hopH1 (Hulin, Armitage, et al., 2018). Strains of Psm races 1 and 2 encode numerous effector proteins (from 30 to 35). By contrast, strains of Pss have fewer effectors (15–18), but, unlike Psm, encode biosynthetic clusters for up to four phytotoxins: syringomycin, syringopeptin, syringolin A and mangotoxin. The role of syringomycin and syringopeptin in the production of necrotic lesions on cherry fruits has been analysed by Scholz‐Schroeder et al. (2001). It has been suggested that the production of phytotoxic metabolites might compensate for the low numbers of effectors in Pss (Hulin et al., 2020; Xin et al., 2018). Indeed, the importance of these toxins was emphasized in a recent genome‐wide mutagenesis screen of Pss B278A by Helmann et al. (2019). They identified syringomycin as one of the most important fitness determinants acting in the French bean apoplast.
Symptoms of bacterial disease of Prunus are observed on leaves, buds, fruits and woody tissues (Hulin et al., 2020; Hulin, Mansfield, et al., 2018). Recent screening experiments on detached leaves have identified resistance to the canker pathogens in wild cherry and related ornamental Prunus species (Hulin et al., 2022; Lienqueo et al., 2024). Resistance to Pss in the ornamental cherry Prunus incisa was found to be dosage dependent, being overcome by infiltration with artificially high inoculum concentrations (>108 cfu/mL of infiltrated suspension).
We carried out a genetic dissection of the role of effectors and toxins to understand the ability of the PG2 strain Pss 9644 to invade and cause symptoms in woody shoots, fruits and leaves of sweet cherry (Prunus avium). The roles of the pathogenicity factors were also assessed in leaves of P. incisa. Following the identification of groups of effector genes, including some that were physically unlinked in the genome but common to pathogens of Prunus, successive rounds of deletion mutagenesis led to the construction of effectorless and toxinless mutants. Creation of the panel of mutants has allowed the association between the presence of certain T3Es and pathogenicity to be examined, and the following hypotheses to be tested: (1) redundant effector groups exist in Pss 9644; (2) toxins and effectors act synergistically to promote infection; (3) toxins and effectors vary in their impact on pathogenicity in different P. avium tissues; and (4) the effectors required to cause symptoms in P. incisa differ from those essential for virulence to P. avium.
2. RESULTS
2.1. Categorization of effectors and toxins in PG2
P. syringae PG2 is a diverse clade within the P. syringae species complex that contains pathogens of most major crop species. A maximum‐likelihood phylogeny based on the core genome placed 74 strains isolated from P. avium across the phylogeny. This was divided into three clades: PG2a (1 strain), PG2b (13 strains) and PG2d (60 strains). The strain used in this study, Pss 9644, is an isolate from cherry within PG2d, previously characterized to be pathogenic to woody tissues, fruit and leaves (Hulin, Mansfield, et al., 2018). We resequenced its complete genome revealing one chromosome (6,164,862 bp) and a small plasmid (45,481 bp). Putative T3Es present in Pss 9644 and the genomes of 73 other cherry pathogens within a total of 323 PG2 strains were identified by homology and classified into four different categories according to their frequency of occurrence (Figure 1, Table S1). The conserved effector locus (CEL) is found in over 90% strains of pathogenic P. syringae (Dillon et al., 2019) and 100% of PG2 strains from cherry. In Pss 9644, the CEL comprised hopAA1, hopM1 and avrE1. A second group, designated CORE (C) effectors, was common to other PG2 strains and in 100% of strains from cherry: hopAG1, hopAH1, hopAI1 and hopI1. Thirdly, PRUNUS (P) effectors were found in >60% of strains isolated from cherry and other Prunus spp.: hopAR1, hopH1, hopA2, hopW, hopAW1 and avrRpm1. Finally, a group defined as FLEXIBLE (F) was variously distributed amongst PG2 strains (<60% in strains from cherry): hopAF1, hopAZ1 and hopBE1. In addition, Pss 9644 was found to contain the gene cluster for the biosynthesis of the toxins syringomycin and syringopeptin (syrsyp), and also the separate cluster for syringolin A (sylA). These toxins are common to PG2 and also produced by strains that are not pathogenic to cherry.
FIGURE 1.

Maximum‐likelihood phylogeny of Pseudomonas syringae strains in phylogroup 2 based on the core genome. Bootstrap support at each node is shown as circles for 0%–50%; 51%–99% (all others are 100%). Four different categories of type III secretion system effectors are shown in shades of blue according to their frequency in genomes of isolates from cherry (red): conserved effector locus (CEL) (100%), CORE (100%), PRUNUS (>60%), FLEXIBLE (<60%). Presence of the syrsyp and sylA clusters are represented with shades of black according to the % identity to the P. syringae pv. syringae (Pss) B728A reference in antiSMASH. Pss 9644 is highlighted with a yellow rectangle. P. syringae pv. phaseolicola 1448A was used as an out‐group.
2.2. T3E and phytotoxin genes are upregulated in hrp‐inducing medium
The expression of genes in Pss 9644 identified to encode T3Es and enzymes predicted to be involved in toxin synthesis was examined using RNA sequencing (RNA‐seq; Figure 2). Gene expression was observed in Pss 9644 grown to exponential phase in King's B medium (KB) and in hrp (hypersensitive resistance and pathogenicity)‐inducing minimal medium (HMM), which is a simple mimic of the in planta environment. The principal component analysis (PCA) of the RNA‐seq datasets and the transcripts detected by the experiment are reported in Figures S1 and S2, respectively. All the predicted genes for T3Es and toxin biosynthesis were expressed in both media. The upregulated expression in HMM compared with KB varied significantly by log2 fold‐change of >1 to >6 except for hopAI1. For example, hopAR1, hopAA1 and avrE1 were the most strongly induced effectors in HMM. The weakest relative expression was identified for hopAF1, hopAW1 and hopW with around log2 fold‐change of 1. In addition, hopAI1, in the operon hopAG1‐hopAH1‐hopAI1 in CORE effector group, was not differentially expressed. Genes involved in toxin synthesis were also expressed more strongly (log2 increase of 2–4) in HMM.
FIGURE 2.

Log2 fold‐change ratio of the upregulated expression of genes encoding effectors and toxin synthesis in hrp‐inducing minimal medium (HMM) compared to King's medium B (KB) in Pseudomonas syringae pv. syringae 9644 wild‐type strain. Type III secretion system effectors (T3Es) in the four categories of Figure 1 are colour coded in shades of blue according to their frequency in phylogroup 2 and genomes of isolates from cherry: conserved effector locus (CEL), CORE, PRUNUS and FLEXIBLE. Toxin clusters are highlighted in shades of black. Legend represents syr, syringomycin; syp, syringopeptin; sylA, syringolin A. Lines represent the log2 fold‐change threshold of 1, 2 and 4; ns: nonsignificant (log2 fold‐change < 1). Values show means and standard errors from three replicates; the experiment was performed once.
2.3. Pathogenicity tests identify tissue‐specific effects for virulence factors
Given that most effectors and toxins were expressed in HMM, we predicted that these genes were likely to play an important role in the pathogen's ability to cause disease in cherry. Deletion mutants as listed and named in Table 1 were constructed sequentially according to the T3E group frequency in cherry isolates from FLEXIBLE to CEL. Multiplication of the mutants (Figure S3) did not differ significantly from the wild type in rich medium (KB), indicating the deletion of these genes did not influence fitness in culture medium. They were then compared with wild‐type Pss 9644 to determine the effects of mutations on pathogenicity in P. avium woody tissues, fruits and leaves and in leaves of P. incisa. Owing to constraints on the availability of plant tissues and the number of mutants to be tested, not all strains were examined at the same time in all experiments.
TABLE 1.
Genotypes of the effector and toxin deletion mutants created in Pseuomonas syringae pv. syringae strain 9644.
| Pseudomonas syringae pv syringae strain abbreviation | Nature of deletion in groups of effectors and toxins | Genotype |
|---|---|---|
| WT | Wild‐type pathogen of cherry (isolated by Steve Roberts in 2012) | |
| ΔF | Flexible effectors | ΔhopAZ1ΔhopAF1ΔhopBE1 |
| ΔFΔP | Flexible and Prunus effectors | ΔhopAZ1ΔhopAF1ΔhopBE1ΔhopAR1ΔhopAW1ΔavrRpm1ΔhopA2ΔhopW1ΔhopH1 |
| ΔFΔPΔC | Flexible, Prunus and core effectors | ΔhopAZ1ΔhopAF1ΔhopBE1ΔhopAR1ΔhopAW1ΔavrRpm1ΔhopA2ΔhopW1ΔhopAG1‐hopAH1‐hopAI1ΔhopI1ΔhopH1 |
| ΔCEL | Conserved effector locus | ΔCEL (hopAA1, hopM1 and avrE1) |
| ΔEff | Effectorless | ΔhopAZ1ΔhopAF1ΔhopBE1ΔhopAR1ΔhopAW1ΔavrRpm1ΔhopA2ΔhopW1ΔhopAG1‐hopAH1‐hopAI1ΔhopI1ΔCELΔhopH1 |
| ΔT | Toxinless | ΔsylAΔsyrsyp |
| Δsa | Syringolin A | ΔsylA |
| Δss | Syringomycin/syringopeptin | Δsyrsyp |
| ΔCELΔT | Conserved effector locus and toxins | ΔCELΔsylAΔsyrsyp |
| ΔCELΔsa | Conserved effector locus and syringolin A | ΔCELΔsylA |
| ΔCELΔss | Conserved effector locus and syringomycin/syringopeptin | ΔCELΔsyrsyp |
| ΔEffΔT | Effectorless toxinless | ΔhopAZ1ΔhopAF1ΔhopBE1ΔhopAR1ΔhopAW1ΔavrRpm1ΔhopA2ΔhopW1ΔhopAG1‐hopAH1‐hopAI1ΔhopI1ΔCELΔhopH1ΔsyrsypΔsylA |
| ΔEffΔsa | Effectorless and syringolin A | ΔhopAZ1ΔhopAF1ΔhopBE1ΔhopAR1ΔhopAW1ΔavrRpm1ΔhopA2ΔhopW1ΔhopAG1‐hopAH1‐hopAI1ΔhopI1ΔCELΔhopH1ΔsylA |
| ΔEffΔss | Effectorless and syringomycin/syringopeptin | ΔhopAZ1ΔhopAF1ΔhopBE1ΔhopAR1ΔhopAW1ΔavrRpm1ΔhopA2ΔhopW1ΔhopAG1‐hopAH1‐hopAI1ΔhopI1ΔCELΔhopH1Δsyrsyp |
2.4. Effectors have a more important role than toxins in wood infection
Pathogenicity was compared in both cut shoot and whole tree inoculation assays (Figure 3). In woody stems, results were more variable than in other tissues. In cut shoot assays (Figure 3a), the wild‐type Pss 9644 caused an average lesion length of 9 mm. No significant differences in lesion size were observed when shoots were inoculated with the ΔCEL, Δss, Δsa, ΔT, ΔF or ΔFΔP mutants. However, the ΔFΔPΔC triple mutant caused a lesion significantly smaller than the wild type. Surprisingly, given its role in other diseases, the CEL deletion mutant (ΔCEL) caused lesions very similar to the wild type. The deletion of both toxins (ΔT) also had a minor effect but the combination of CEL and toxin deletions in (ΔCELΔT) greatly reduced lesion lengths. The deletion of all effector clusters, that is, ΔCELΔFΔPΔC, created an effectorless (ΔEff) mutant that, like ΔEffΔss failed to produce symptoms.
FIGURE 3.

Lesion formation in cut shoots and woody stems on whole trees of Prunus avium ‘Sweetheart’ inoculated with wild‐type Pseudomonas syringae pv. syringae 9644 and deletion mutants. Mutants are described in Table 1. WT: wild type, CEL: conserved effector locus, F: FLEXIBLE group, P: PRUNUS group, C: CORE group, Eff: all effectors in the CEL, FLEXIBLE, PRUNUS, CORE groups, sa: syringolin A cluster, ss: syringomycin/syringopeptin cluster, T: both toxin clusters. Mock: 10 mM MgCl2. Letters in common above data points indicate no significant difference between treatments. Box plots indicate minimum, first quartile, median (line), mean (diamond) third quartile and maximum values with bars indicating outliers. Letters in red indicate significant differences compared to the wild type (p < 0.05). Representative symptoms are shown in Figure S3. (a) Length of lesions produced in cut shoots. Data from three repeated experiments with 45 shoots in total for each treatment were analysed after log transformation by analysis of variance and post hoc Tukey–Kramer HSD tests to assess pairwise differences between mutants. The Tukey HSD procedure produced p‐values adjusted for multiple testing. (b) Percentage of inoculations (n = 10) in each disease score category after wound inoculation into trees. Disease symptoms were scored as illustrated: 1, no symptoms; 2, limited browning; 3, necrosis; 4, necrosis and gumming; 5, necrosis, gumming and spread of lesions from the site of inoculation. This experiment was performed once. Pairwise differences between strains were assessed via a series of Fisher's exact tests with the resulting p‐values adjusted for multiple testing through the Benjamini–Hochberg procedure.
Inoculations of whole trees were scored for symptom appearance at and around the cut inoculation site (Figure 3b). Representative symptoms are reported in Figure S4. Only the two effectorless strains (ΔEff and ΔEffΔss) caused significantly fewer symptoms at the inoculation site than the wild type. Deletion of CEL effectors and toxins (ΔCELΔT), or toxins alone (ΔT), greatly reduced the numbers of sites with dark necrotic lesions, gumming and spreading, but the effects were not statistically significant (Fisher's exact test; ΔCELΔT, p = 0.06 and ΔT, p = 0.11).
2.5. Effectors and toxins work together to promote disease in immature fruit
Stab inoculation of immature fruits showed that, unlike in other tissues, deletion of all effectors did not result in a failure to cause symptoms, unless the syrsyp toxin cluster was also deleted (Figure 4). Representative symptoms are reported in Figure S5. The effectorless mutant (ΔEff) recorded lesion diameters that were significantly reduced compared with the wild type, but only after 6 days of incubation. Deletion of the toxin clusters (ΔT) caused the same reduction in pathogenicity as seen with the effectorless mutant (ΔEff), highlighting the greater role of toxins in fruit symptoms. The ΔFΔP mutations did not reduce lesion diameters but the ΔFΔPΔC deletions together had a significant effect. As observed in experiments on cut shoots, the CEL and toxins deletion combination (ΔCELΔT) strongly reduced symptom formation, an effect attributed mainly to syrsyp because the deletion of the syringolin A genes (Δsa) only led to a small reduction in lesion size compared to the syrsyp (Δss) mutant, which could not form lesions.
FIGURE 4.
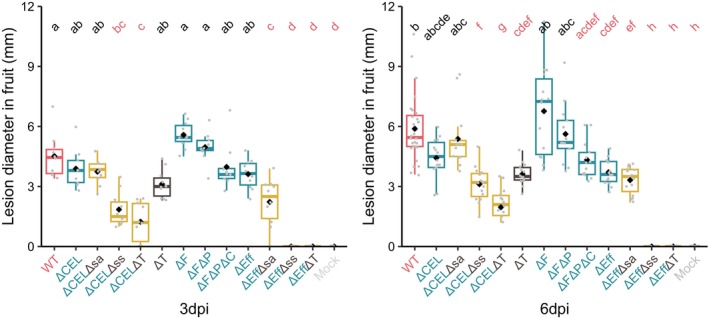
Lesion formation in immature cherry fruits of Prunus avium stab‐inoculated with wild‐type Pseudomonas syringae pv. syringae 9644 and deletion mutants as described in Table 1. WT: wild type, CEL: conserved effector locus, F: FLEXIBLE group, P: PRUNUS group, C: CORE group, Eff: all effectors in the CEL, FLEXIBLE, PRUNUS, CORE groups, sa: syringolin A cluster, ss: syringomycin/syringopeptin cluster, T: both toxins clusters. Mock: sterile toothpick. dpi, days post‐inoculation. Letters in common above data points indicate no significant difference between treatments and those in red indicate significant differences compared to the wild type (p < 0.05). This experiment was performed twice and data from 10 fruits for each treatment were analysed after log transformation, with analysis of variance and post hoc Tukey–Kramer HSD tests to assess pairwise differences between mutants. Box plots indicate minimum, first quartile, median (line), mean (diamond) third quartile and maximum values with bars indicating outliers.
2.6. Effectors are key virulence factors for infection of cherry leaves
Two series of experiments were completed on leaves of P. avium ‘Sweetheart’. The first focused on the strains with deletions of toxins, CEL and all effectors (Figure 5a,b); the second focused on deletion of the intermediate effector groups CORE, PRUNUS and FLEXIBLE (Figure 5c,d). Representative symptoms are reported in Figure S6. We observed that deletion of CEL alone (ΔCEL) greatly reduced symptoms 3 days after inoculation, but this effect was overcome to some extent after 6 days (Figure 5a). The ΔF, ΔFΔP, ΔFΔPΔC sequential deletions had an additive effect on the reduction of symptom formation (Figure 5c). Deletion of both toxin clusters (ΔT) reduced symptoms to a similar extent as ΔCEL after 6 days, and this was primarily attributed to deletion of syrsyp. The CEL and toxins deletion (ΔCELΔT) caused a striking reduction in lesion formation. The most pronounced change in pathogenicity was observed using the effectorless mutant (ΔEff), which failed to produce symptoms in leaves even when both toxin clusters were present. Supporting this conclusion, no symptoms were produced by the effectorless and toxinless mutants (ΔEffΔT).
FIGURE 5.

The effects of mutations on the pathogenicity of Pseudomonas syringae pv. syringae (Pss) 9644 to leaves of Prunus avium. Detached leaves were inoculated with wild‐type Pss 9644 and deletion mutants as described in Table 1, using low concentration inoculum (2 × 10⁶ cfu/mL); WT: wild type, CEL: conserved effector locus, F: FLEXIBLE group, P: PRUNUS group, C: CORE group, Eff: all effectors in CEL, FLEXIBLE, PRUNUS, CORE groups, sa: syringolin A cluster, ss: syringomycin/syringopeptin cluster, T: both toxins clusters. Mock: 10 mM MgCl2. dpi, days post‐inoculation. Letters in common above data points indicate no significant difference between treatments. Letters in red indicate significant differences compared to the wild type (p < 0.05). (a, c) Lesion formation, assessed using a six‐point scale as illustrated, based on the percentage browning /blackening at the inoculation site; 0, no reaction; 1, <10%; 2, 10%–50%; 3, 51%–90%; 4, 100% discolouration; 5, symptoms spreading from the infiltrated area. Data from three repeated experiments with 15 inoculation sites in total per treatment were analysed. Pairwise differences between strains were assessed via a series of Fisher's exact tests with the resulting p‐values adjusted for multiple testing through the Benjamini–Hochberg procedure. Representative symptoms are shown in Figure S5. (b, d) Recovery of bacteria from inoculation sites. Data from three repeated experiments with 15 sites for each treatment per timepoint were analysed after log transformation by analysis of variance and post hoc Tukey–Kramer HSD tests to assess pairwise differences between mutants. The Tukey HSD procedure produced p‐values adjusted for multiple testing. Box plots indicate minimum, first quartile, median (line), mean (diamond) third quartile and maximum values with bars indicating outliers.
An analysis of bacterial numbers at inoculation sites was carried out to gain a further insight into the impacts of deletions on bacterial fitness. Initial (day 0) bacterial numbers in leaves are reported in Figure S7a,b. Bacterial multiplication did not fully reflect the loss of symptom production observed (compare Figure 5a,c and 5b,d). For example, although there was a trend towards reduced multiplication by sequential deletion of ΔF, ΔFΔP and ΔFΔPΔC, the reduction was only significantly different from the wild type for the triple mutant (ΔFΔPΔC) 3 days after inoculation (p = 0.05). Deletion of the CEL cluster (ΔCEL) reduced populations after 3 days, but not 6 days after inoculation. The combination of toxin and CEL deletions (ΔCELΔT) did not further reduce bacterial multiplication and the toxin deletions, although reducing symptoms significantly, did not alone result in the pathogen being unable to grow. The effectorless mutant (ΔEff) multiplied, but to a very low population density.
2.7. Comparing symptoms in P. avium and P. incisa
Although P. incisa leaves are resistant to low inoculum concentrations of Pss 9644 (2 × 10⁶ cfu/mL), at high concentration (2 × 10⁸ cfu/mL) the symptoms that develop and the bacterial growth mirror those produced by low concentrations in P. avium leaves indicating a susceptible interaction (Hulin et al., 2022). Figure 6 shows that the deletion of effectors caused much clearer reductions in symptoms in P. incisa than P. avium. For example, the ΔF deletion led to significantly reduced lesion formation 6 days after inoculation, and further reductions in symptoms were observed with ΔFΔP. Delayed symptom development was again observed with the CEL deletion (ΔCEL). Deletion of toxins (ΔT) caused less effect on symptoms in P. incisa than in P. avium, but the CEL and toxins deletion mutant (ΔCELΔT) again produced very few symptoms.
FIGURE 6.

Comparison of the effects of mutations on the pathogenicity of Pseudomonas syringae pv. syringae (Pss) 9644 to leaves of Prunus avium ‘Sweetheart’ and Prunus incisa using high concentration inoculum (2 × 10⁸ cfu/mL). WT: wild type, CEL: conserved effector locus, F: FLEXIBLE group, P: PRUNUS group, C: CORE group, Eff: all effectors in CEL, FLEXIBLE, PRUNUS, CORE groups, sa: syringolin A cluster, ss: syringomycin/syringopeptin cluster, T: both toxins cluster. Mock: 10 mM MgCl2. dpi, days post‐inoculation. Letters in common above data points indicate no significant difference between treatments. Letters in red indicate significant differences compared to the wild type (p < 0.05). Lesion formation, assessed using a six‐point scale as illustrated, based on the percentage browning/blackening at the inoculation site; 0, no reaction; 1, <10%; 2, 10%–50%; 3, 51%–90%; 4, 100% discolouration; 5, symptoms spreading from the infiltrated area. Data from three repeated experiments with 18 inoculation sites in total per treatment were analysed. Pairwise differences between strains were assessed via a series of Fisher's exact tests with the resulting p‐values adjusted for multiple testing through the Benjamini–Hochberg procedure. Note that at low inoculum concentration (2 × 10⁶ cfu/mL) Pss 9644 fails to cause lesions in ornamental cherry, P. incisa.
2.8. Mixed inocula reveal that strains of Pss can co‐operate in planta to cause maximal disease
An inoculum mixture of the effectorless mutant (ΔEff), which possesses both toxin genes syrsyp and sylA, and the CEL‐toxins mutant (ΔCELΔT), which produces all effectors except those within the CEL, was examined to determine if the effect of the missing genes for toxin biosynthesis could be supplied functionally in trans. In theory, with complementation, the mixture would have the same pathogenicity as the CEL mutant alone. Results presented in Figure 7 confirmed this hypothesis both in terms of symptom production (Figure 7a) and bacterial multiplication (Figure 7b). Initial (day 0) bacterial numbers in leaves are reported in Figure S7c.
FIGURE 7.

Use of mixtures of mutants of Pseudomonas syringae pv. syringae 9644 to demonstrate complementation of gene deletions. A mixture of the effectorless mutant (ΔEff) that produces both toxins, and the ΔCELΔT mutant, which produces all effectors except the CEL, was examined to complement the missing genes in trans. Pathogenicity to detached leaves of Prunus avium ‘Sweetheart’ was examined using low concentration inoculum (2 × 10⁶ cfu/mL). WT: wild type, CEL: conserved effector locus, F: FLEXIBLE group, P: PRUNUS group, C: CORE group, Eff: all effectors in the CEL, FLEXIBLE, PRUNUS, CORE groups, sa: syringolin A cluster, ss: syringomycin/syringopeptin cluster, T: both toxins clusters. Mock: 10 mM MgCl2. dpi, days post‐inoculation. Letters in common above data points indicate no significant difference between treatments. Letters in red indicate significant differences compared to the wild type (p < 0.05). (a) Lesion formation, assessed using a six‐point scale as illustrated, based on the percentage browning/blackening at the inoculation site; 0, no reaction; 1, <10%; 2, 10%–50%; 3, 51%–90%; 4, 100% discolouration; 5, symptoms spreading from the infiltrated area. Data from three repeated experiments with 15 inoculation sites per treatment were analysed. Pairwise differences between strains were assessed via a series of Fisher's exact tests with the resulting p‐values adjusted for multiple testing through the Benjamini–Hochberg procedure. (b) Recovery of bacteria from inoculation sites. Data from three repeated experiments with 15 sites in total for each treatment, were analysed after log transformation by analysis of variance and post hoc Tukey–Kramer HSD tests to assess pairwise differences between mutants. The Tukey HSD procedure produced p‐values adjusted for multiple testing. Box plots indicate minimum, first quartile, median (line), mean (diamond) third quartile and maximum values with bars indicating outliers.
3. DISCUSSION
3.1. Testing bioinformatics‐based predictions
Comparative genomics of the available genomes of strains of P. syringae including all phylogroups identified four effectors that were gained in pathogens of cherry: hopAR1, hopBB1, hopBF1 and hopH1 (Hulin, Armitage, et al., 2018). Of these, the Pss 9644 strain used here contained only hopAR1 and hopH1, and these genes were part of the PRUNUS group identified in Figure 1. Mutation of the entire PRUNUS group did not cause a significant reduction in symptom formation in wood or fruit of P. avium, indicating that their deletion did not impact pathogenicity as predicted. Perhaps effectors remaining in the other effector groups allow bacteria to remain pathogenic through redundant roles in disease development. However, a minor effect was observed in leaves of P. avium and more clearly in P. incisa with the combined FLEXIBLE and PRUNUS group deletions (in ΔFΔP) causing further reduction than FLEXIBLE alone (ΔF). The results from P. incisa therefore support an important role for hopAR1 and hopH1 in the wider infection of Prunus species.
3.2. Redundant effector groups and the importance of CEL
Our mutation strategy focused on the deletion of groups of effectors identified from genomic analysis of strains within PG2. The importance of the CEL group, physically linked to the hrp gene cluster that encodes the T3SS, has been identified in several strains of P. syringae (Badel et al., 2003; Munkvold et al., 2009). The other groups we selected based on phylogenetic analysis – PRUNUS, CORE and FLEXIBLE – were not identified as REGs as conceptualized for Pto DC3000 by Kvitko et al. (2009). However, our results show that groups of T3Es can be deleted without having major effects on virulence and indicate that the REG concept is probably applicable to Pss–Prunus interactions. Effector deletions in Pto DC3000 also caused stronger effects in tomato than in Nicotiana benthamiana, a finding similar to the results obtained comparing P. avium with P. incisa and indicating that the roles of effectors may vary in different host species (Kvitko et al., 2009).
The roles of the effectors encoded by hopAA1, hopM1 and avrE1 within the CEL in Pss 9644 have been studied in detail in other pathosystems. In the Pto DC3000–tomato system, a hopAA1‐1 allele deletion mutant reduced chlorotic lesion symptoms (Munkvold et al., 2009); HopM1 was also implicated in lesion formation, but not enhancement of bacterial growth (Badel et al., 2003). In Pto PT23, AvrE1 functions in both roles (Lorang et al., 1994). In Arabidopsis thaliana, the reduction in virulence of a CEL deletion mutant was associated with enhanced callose deposition adjacent to bacterial colonies, indicating that the CEL may act to suppress MTI (DebRoy et al., 2004). In Pto DC3000, AvrE1 and HopM1 have been shown to act as early time point bacterial growth promoters by creating an aqueous apoplastic environment (Wei & Collmer, 2018). Roussin‐Leveillee et al. (2022) found that increased water‐soaking was due to the effectors redundantly inducing stomatal closure by upregulating abscisic acid pathways in the guard cells. Effects on stomata, which are much more common in leaves, may help to explain the greater reductions in pathogenicity observed caused by CEL deletion in cherry leaves rather than fruits and woody tissue. However, HopM1 has also been reported to have a role in suppression of the MTI‐mediated oxidative burst in A. thaliana and N. benthamiana 24 h post‐infiltration (Lozano‐Duran et al., 2014; Wei & Collmer, 2018). In kiwifruit bacterial canker caused by Psa, only avrE1 is required for full virulence in leaves and, together with hopR1 (a related non‐CEL effector), promotes bacterial fitness and necrosis (Jayaraman et al., 2020). Interestingly, hopM1 and hopAA1 in Psa do not have a role due to truncation and pseudogenization events, respectively.
3.3. Toxins and CEL effectors appear to operate synergistically
Syringomycin and syringopeptin are lipopeptide phytotoxins synthesized by a nonribosomal mechanism of peptide biosynthesis encoded by the syrsyp gene cluster. They form pores in the plant cell membrane, disrupt ionic potential and cause cell death (Bender et al., 1999). Caponero et al. (1997) and Scholz‐Schroeder et al. (2001) reported that mutations in the syrsyp cluster preventing their biosynthesis reduced the symptoms produced by Pss on immature cherry fruit by 30%–70% compared to the wild‐type strain. We confirmed the effects of syrsyp on fruit but found less significant reductions in virulence in other tissues. Syringolin A is a peptide derivative synthesized by a mixed nonribosomal peptide/polyketide route. Although it has been implicated as a pathogenicity factor in several plants as a proteasome inhibitor in Arabidopsis, wheat and bean (Dudnik & Dudler, 2014; Misas‐Villamil et al., 2013; Schellenberg et al., 2010), deletion of sylA had no clear effect on the pathogenicity of Pss 9644 to P. avium but did reduce symptoms slightly in leaves of P. incisa.
The influence of toxins was most apparent in fruits. Indeed, unlike in other tissues, the effectorless mutant still produced lesions in fruits, probably because of toxin secretion. Fruit tissues may be more sensitive to the toxins and/or toxin synthesis may be enhanced by metabolites in fruit. This proposal is supported by the findings of Mo and Gross (1991) and Quigley and Gross (1994), who recorded enhanced production of syringomycin in media containing plant extracts such as arbutin and fructose. Despite all of the effector genes within Pss 9644 being components of the HrpL regulon (Lam et al., 2014; Shao et al., 2021), we observed clear differences in T3E gene expression in hrp‐inducing medium. Such differences imply the potential for further regulatory control in the plant and indicate that the role of effectors may be modified depending on their expression under conditions within specific plant tissues. Shao et al. (2021) have identified several regulatory networks controlling T3E gene expression, and their work highlights that regulation within plant tissues remains to be fully understood both in terms of nutrient availability and the location of bacteria within expanding colonies. The differential roles of toxins and effectors in the ability of P. syringae strains to colonize a wide range of ecological niches could be explored by further genetic dissection.
In all cherry tissues, the deletion of toxins and CEL together led to a possibly synergistic reduction in pathogenicity. Understanding the cause of this effect may unravel mechanisms of defence targeted by the pathogen. Clearly, the importance of each of the components of the Pss 9644 CEL interacting with syrsyp requires further dissection. Deletion of toxins reduced the development of lesions but did not reduce bacterial multiplication in cherry leaves. Similar differential effects on symptoms and populations have been reported for the toxin coronatine in N. benthamiana (Chakravarthy et al., 2018) and also in Arabidopsis following syringe infiltration (Brooks et al., 2005).
3.4. Comparing P. avium and P. incisa
Our findings present an overview of the complex redundancy of T3Es operating in Pss 9644. Apart from effectors within the CEL group, we have not been able to identify others having a clear requirement for pathogenicity to P. avium. Given the strong bioinformatics‐led predictions of the positive role for effector groups in the evolution of pathogenicity to Prunus, it is perhaps surprising that clearer reductions in pathogenicity to P. avium were not found using the sequential deletion strategy. By contrast, in P. incisa several groups of effectors emerged as having important roles. The nature of the resistance of P. incisa to low concentrations of inocula has not been explored. The ornamental cherry is resistant to all canker‐producing strains including Psm races 1 and 2 as well as Pss (Hulin et al., 2022). One explanation for the broad‐spectrum resistance is that P. incisa has a strong MAMP response to P. syringae. In consequence, multiple effectors may be required to suppress MAMP‐induced defences. The effectorless strain should allow further exploration of effector redundancy. It could also be used to decipher some of the components of resistance in ornamental cherry and related Prunus, which may prove useful for more informed approaches to resistance breeding.
Certain P. avium varieties have been found to possess significant resistance to bacterial canker in the field, for example, cv. Merton Glory, but resistance (or tolerance) is not clearly apparent following artificial inoculation (Crosse & Garrett, 1966; Hulin et al., 2022; Hulin, Mansfield, et al., 2018). The lingering concern in this work is therefore that the rapid laboratory‐ or greenhouse‐based infection assays on P. avium create conditions that are very favourable to the pathogenic strains of P. syringae. As a consequence, the roles of groups of effectors may not be as apparent as in P. incisa. Direct infiltration of inocula does not allow effectors or toxins that may be more involved in the entry of bacteria into plant tissues to be assessed (Lee et al., 2012; Melotto et al., 2006).
3.5. Mixed inocula and effector guilds
The experiment with mixtures of mutants demonstrated complementation of the syrsyp and sylA deletions in trans. The use of mixed inocula containing several strains each expressing single effectors has been developed for Pto DC3000, carrying in trans complementation to a higher level (Ruiz‐Bedoya et al., 2023). They used a metaclone containing a mixture of 36 co‐isogenic strains in an effectorless background. Each co‐isogenic strain was individually unfit, but the metaclone was collectively as virulent as the wild type. This approach has led to the proposal that effector ‘guilds’ exist in which effectors redundantly target the same host process (Bundalovic‐Torma et al., 2022). A similar approach is now possible using the effectorless mutant of Pss 9644. Given the potential synergism identified between the CEL and toxins in the infection of cherry, it would now be helpful to consider the Pss toxins as components of the effectorome. The probability that diseases may be caused by mixtures of weakly virulent strains of P. syringae has been discussed by Hulin, Rabiey, et al. (2023), who identified low virulence isolates in the field. The ecological significance of mixed inocula merits further investigation.
3.6. Concluding remarks
Analysis of a pathogen such as Pss 9644 that causes disease in different plant tissues in a perennial crop raises issues of niche adaptation that are not addressed in research on model plant–pathogen systems such as Pto DC3000 and A. thaliana. The general significance of our research is to highlight the complexity of effector redundancy in Pss 9644 attacking different plant tissues and the clear niche‐specific roles of toxins in cherry fruit. The synergism discovered between toxins, particularly syringomycin, and the CEL group of effectors has not been reported previously. It is proposed that toxins should really be considered as part of the P. syringae effector armoury and should not be overlooked in any discussion of the mechanisms used by P. syringae to overcome plant immunity. Our work sets the scene for further analysis of T3E and toxin synergism and shows that ornamental cherry P. incisa will provide a valuable host for further analysis of the contributions of T3Es to pathogenicity in Prunus.
4. EXPERIMENTAL PROCEDURES
4.1. Bacterial culture
Strains of Pss 9644 deletion mutants used in this study are listed in Table 1 and plasmids in Table S2. The incubation conditions for Pss 9644 and mutants were 28°C, and 180 rpm when cultured in liquid broth. Escherichia coli strains were incubated at 37°C, and 200 rpm when in liquid. Agar or broth of King's medium B (KB) (King et al., 1954) or lysogeny broth (LB) (Bertani, 1951) were used. Antibiotics and X‐gal used for screening were kanamycin (Km, 50 μg/mL), nitrofurantoin (Nif, 100 μg/mL) and X‐gal (40 μg/mL).
4.2. Comparative genomics of PG2 strains of Pss
Pss 9644 was grown in KB broth for DNA isolation using the cetyltrimethylammonium bromide method (William et al., 2012). Quality controls were performed using NanoDrop, Qubit and agarose gel electrophoresis. For long‐read sequencing Pss 9644 (SAMN17034057), a MinION (Oxford Nanopore) was used. Genome assembly and annotation were performed as Hulin, Armitage, et al. (2018). The genome was deposited in NCBI (assembly GCA_023277945, SAMN17034057).
Additional genomes (2686) belonging to the P. syringae species complex (taxonomic group ID 136849) were downloaded from NCBI on 21 March 2023. FastANI v. 1.33 (Jain et al., 2018) was used to calculate average nucleotide identity between pairwise genomes and R scripting was used to build a dendrogram of relatedness and group genomes into >90% identity groups (Hulin, Hill, et al., 2023). A total of 363 genomes belonging to the same group as Pss 9644 were kept for further analysis and Pph 1448A (a PG3) strain was kept as an out‐group. Genomes of low quality (>5% contamination, <95% complete and N50 < 40,000 bp) were removed as in previous work (Hulin et al., 2022), leaving 324 genomes. Panaroo v. 1.3.2 (Tonkin‐Hill et al., 2020) was used to generate a filtered core gene alignment of 3,943,305 nucleotides from 3825 core genes. A maximum‐likelihood phylogeny was built using IQ‐TREE v. 2.0.4 (Minh et al., 2020) with model GTR + F + I + G4.
T3E genes were identified across the set of genomes using tBLASTn (BLAST+ v. 2.13.0) (Altschul et al., 1990). A database of 14,613 P. syringae T3E proteins (Dillon et al., 2019) was used to query each genome. Putative hits were kept if they were over 50% ID and 50% query length. Bash scripting was used to obtain up to five non‐overlapping hits for each effector family. The percentage of alleles for each family present across cherry pathogens was calculated manually. For visualization purposes, only effector genes in Pss 9644 are presented in the phylogeny.
To identify nonribosomal peptide synthetase clusters in each genome the programme antiSMASH v. 6.1.1 (Blin et al., 2021) was used. Bash‐scripting was used to extract hits corresponding to the syringomycin‐syringopeptin and syringolin A clusters identified based on similarity to Pss B728A by antiSMASH.
Results were plotted on the core genome phylogeny using R packages ggtree (Yu et al., 2016), ggtreeExtra (Xu et al., 2021) and phangorn (Schliep, 2011).
4.3. Expression of genes encoding effectors and toxins in Pss 9644
The expression of genes encoding potential virulence factors was compared after 5 h of growth in KB and HMM (Huynh et al., 1989). Media were inoculated with bacteria grown overnight in KB. Total RNA was isolated as previously described (Moreno‐Perez et al., 2021) from three replicates and sent to Novogene Co., Ltd. (Cambridge, UK) for cDNA synthesis, library preparation including rRNA removal and paired‐end 150 bp sequencing performed on Illumina NovaSeq6000 platform, obtaining 2 Gb raw data per sample. Adapter sequences and poor‐quality reads were trimmed using fastq‐mcf v. 1.04.807 (Aronesty, 2013) and quality checked using FastQC v. 0.11.9 (Andrews, 2010). rRNA decontamination was performed using BBDuk software v. 38.18. Transcript alignment and quantification were performed using Salmon v. 1.9.0 (Patro et al., 2017) with the long‐read genome (GCF_023277945.1).
Differential gene expression analysis was performed using the DESeq2 package v. 1.40.2 (Love et al., 2014) with a minimum transcript count threshold of 50 and a p‐value threshold of 0.05. Using the contrast function a subset of only significantly differentially expressed genes was produced and used for toxin and effector gene analysis applied for experimental (HMM) and control (KB) groups. RNA data were uploaded to NCBI (GSE255102). A summary result table is presented in Table S5.
4.4. Pss 9644 markerless deletion mutants
Markerless deletion mutants of Pss 9644 were obtained as previously described (Kvitko et al., 2009). Briefly, flanking regions upstream and downstream of the genes of interest (c. 400 bp) were amplified using Phusion high‐fidelity DNA polymerase (Thermo Fisher Scientific) (Phusion PCR) using primers in Table S3 and PCR conditions in Table S4. The purified Phusion PCR products were amplified again by splice overlap‐PCR (SOE‐PCR) to join the two flanking regions. The purified SOE‐PCR product was double‐restriction enzyme‐digested and ligated into a pK18mobsacB vector previously double‐digested with the corresponding enzymes and dephosphorylated with rSAP (NEB). The constructs were transformed into E. coli DH5α cells plated on LB containing Km + X‐gal for blue/white selection, and positive transformants were confirmed using colony M13 PCR and Sanger sequencing (Azenta, UK).
T3E and toxin genes were individually deleted from the chromosome via a double homologous recombination process previously described (Hmelo et al., 2015; Neale et al., 2020) with modifications. Triparental mating was performed using E. coli DH5α cells as construct donor and with pRK2013 as a helper plasmid. Recipient Pss strains, donors and helper were mixed at a 2:1:1 volume (OD600 1.5:0.8:0.8). After centrifugation, the pellet was carefully resuspended, plated on a KB plate and incubated at 30°C for at least 24 h. Transconjugants were selected on KB + Km + Nif plates. Colonies were streaked on LB agar‐no salt‐15% (wt/vol) sucrose plates for sucrose counterselection. Merodiploid colonies were replica‐plated on KB and KB + Km. Deletion mutants were identified by colony PCR.
4.5. Pathogenicity tests
All pathogenicity tests were performed in 2022 on the susceptible P. avium ‘Sweetheart’ based on Hulin, Mansfield, et al. (2018). P. incisa was also used for detached leaf assays. In trans complementation experiments were performed in 2023, under the same conditions.
4.5.1. Cut shoots
One‐year‐old dormant shoots were collected at NIAB‐EMR, UK, in January. Fifteen shoots per bacterial treatment were dip‐inoculated in 2 × 10⁷ cfu/mL suspension for each of the three independent experiments. Shoots were placed in a plastic box for the first 2 weeks and then randomized on rack trays filled with sterile distilled water. Incubation for 9 weeks was at 17°C, 16 h light:8 h dark cycles. Lesion lengths (mm) were measured from the cut end of the bark‐peeled shoot.
4.5.2. Whole tree
Wound inoculations were conducted in controlled growth rooms (20°C, 16 h light:8 h dark cycles) in February, on 1‐year‐old saplings. Inoculation sites were surface sterilized, and 2 cm of bark was sliced off. Fifty microlitres of 2 × 10⁷ cfu/mL inoculum was pipetted over the exposed dormant wood and covered with Parafilm and tape. Ten biological replicates per bacterial treatment were used performing six inoculations per tree and incubation lasted 9 weeks before scoring. Disease was scored as lesion category of the wound site after bark removal (no symptoms, limited browning, necrosis, necrosis + gummosis, necrosis + gummosis + spreading). The experiment was performed once.
4.5.3. Fruits
Immature fruits were stab‐inoculated using toothpicks touched onto 2‐day‐old colonies grown on KB plates. An unused toothpick was used as a mock control. Five fruits were stabbed per bacterial treatment, with two inoculations per fruit for each treatment. Independent experiments were repeated twice. Lesion diameters were measured with a calliper (mm) 3 and 6 days post‐inoculation (dpi).
4.5.4. Leaves
Leaves were detached 1–1.5 weeks after emergence and inoculated with 2 × 10⁶ cfu/mL for symptoms and bacterial population counts in P. avium and 108 cfu/mL for symptom comparisons in P. incisa. Five leaves were used as biological replicates per bacterial treatment, with four infiltration sites per leaf. Three independent experiments were performed. Leaves were incubated at 22°C, 16 h light:8 h dark cycles on sterilized trays with filter paper moistened with sterile distilled water and covered with a plastic bag to maintain humidity. Lesion scores were taken at infiltration sites 3 and 6 dpi scoring: 0, no symptoms; 1, limited browning; 2, browning <50% of the inoculated site; 3, browning >50% of the inoculated site; 4, complete browning; and 5, spread from the site of infiltration.
Bacterial multiplication was examined at 0, 3 and 6 dpi at one infiltration site per leaf by excising a 1 cm diameter leaf disc after surface sterilization. Discs were homogenized individually in 1 mL 10 mM MgCl2 and two stainless‐steel ball bearings in a 2010 Geno/grinder, 1 cycle 30 s at 1200 rpm. From the homogenate, a 10‐fold dilution series down to 10−5 was performed with sterile 10 mM MgCl2 and 10 μL aliquots plated on LB medium. After 2 days of incubation at 22°C, individual colonies were counted to calculate cfu/mL. Analysis of bacteria present after mock inoculation provided a control for background contamination on glasshouse‐grown plants.
4.6. Statistical analyses
R v. 4.2.2 (R Core Team, 2022) was used for experimental design, statistical analysis and figure preparation. For statistical analysis, continuous variables were tested as log data, to reduce skewedness, with analysis of variance (ANOVA) and post hoc Tukey–Kramer honestly significant difference (HSD) test analysis to assess pairwise differences between mutants. Datasets from fruit were handled differently due to a zero‐inflation problem. All non‐zero mutants were formally tested for significant effects using a series of t tests. Fisher's exact test was performed on the symptom category classifications for leaves and whole tree. The p‐values were adjusted for multiple testing using the Benjamini–Hochberg procedure. Letters showing significant differences (p < 0.05) were obtained using the cList function from the rcompanion package. Box plots where shown indicate minimum, first quartile, median (line), mean (diamond), third quartile and maximum values with bars indicating outliers.
CONFLICT OF INTEREST STATEMENT
The authors declare no conflict of interest.
Supporting information
Figure S1. Principal component analysis (PCA) comparing gene expression of Pss 9644 triplicate samples grown up in rich medium (King’s B) as a control marked in red and hrp‐inducing minimal medium (HMM) as treatment represented in blue.
Figure S2. Heat map with differential gene expression log2 fold‐change ratio, comparing genes of Pss 9644 triplicate samples grown up in rich medium (King’s B; KB) as a control and hrp‐inducing minimal medium (HMM) as treatment. Red colours represent genes that are upregulated in HMM compared to KB. Blue colours represent genes that are downregulated in HMM compared to KB. Numbers in genes represent their ID in the annotated genome. Numbers in genes represent their ID in the annotated genome. Highlighted gene names correspond to toxins and effectors. g672: avrRpm1, g2569: sypB, g3744: hopBE1, g2562: syrE, g714: hopAG1, g4241:hopI1, g1173: hopA1, g1139: hopM1, g2570: sypC, g1827: hopH1, g1761: hopAZ1, g2568: sypA, g1141: avrE1, g1136: hopAA1, g4816: hopAR1.
Figure S3. (a) Kinetic growth curves over 26 h in King’s B broth of Pss 9644 and its deletion mutants. This experiment was conducted once with three technical replicates per treatment. Nonlinear regression analysis was performed for logarithmic growth, and the growth constant rates (k) are indicated for each strain. Lines represent the trend of average OD600 timepoints from the three replicates per strain. (b) End‐point pairwise differences between strains were assessed via analysis of variance and post hoc Tukey tests. WT: wild‐type, CEL: conserved effector locus, F: FLEXIBLE group, P: PRUNUS group, C: CORE group, Eff: all effectors in the CEL, FLEXIBLE, PRUNUS and CORE groups, sa: syringolin A cluster, ss: syringomycin/syringopeptin cluster, T: both toxin clusters. Letters in common above data points indicate no significant difference between treatments (p > 0.05).
Figure S4. Representative illustration of a lesion score on cherry woody tissue pathogenicity test at 8 weeks after inoculation.
Figure S5. Representative illustration of pathogenicity test in immature cherry fruits at 3 and 6 days post‐inoculation (dpi).
Figure S6. Representative illustration of pathogenicity test in cherry leaves at 3 and 6 days post‐inoculation (dpi).
Figure S7. Initial enumeration of Pss 9644 and its deletion mutants recovered from leaf inoculation sites after 30 min of infiltration on Prunus avium ‘Sweetheart’ from (a) Figure 5b, (b) Figure 5d and (c) Figure 7. Data from (a) and (b) are from three repeated experiments with 45 sites for each treatment in total. Data from (c) are from two repeated experiments with 10 sites for each treatment in total. All data were analysed after log transformation by analysis of variance and post hoc Tukey–Kramer HSD tests to assess pair‐wise differences between mutants. The Tukey HSD procedure produced p‐values adjusted for multiple testing. Box plots indicate minimum, first quartile, median (line), mean (diamond) third quartile maximum values with bars indicating outliers.
Table S1. Metainformation on Pseudomonas syringae genomes used for Figure 1, including phylogroup, host (cherry, other Prunus or non‐Prunus), type III effectors and toxin gene cluster presence.
Table S2. Plasmid vectors and constructs used in this study for Pss 9644 virulence factors deletions in the genome.
Table S3. Primers designed and used for this study for Pss 9644 virulence gene deletion in the genome.
Table S4. PCR programme details used for the different stages of construct cloning and putative mutant check.
Table S5. Transcript per million (TPM) of Pss 9644 triplicate samples grown up in rich medium (King’s B) as a control and hrp‐inducing minimal medium (HMM) as treatment.
ACKNOWLEDGEMENTS
A.V., M.H., R.W.J., J.W.M., R.J.H. were funded by BBSRC grants BB/P006272/1 and the Bacterial Plant Diseases programme, BB/T010746/1. We thank Mojgan Rabiey, Nichola Hawkins and Diana Vinchira‐Villarraga for discussion and NIAB glasshouse staff for their role in plant maintenance. Support was received from students from the BSPP summer student programme and Global Training‐Novia Salcedo.
Vadillo‐Dieguez, A. , Zeng, Z. , Mansfield, J.W. , Grinberg, N.F. , Lynn, S.C. , Gregg, A. et al. (2024) Genetic dissection of the tissue‐specific roles of type III effectors and phytotoxins in the pathogenicity of Pseudomonas syringae pv. syringae to cherry. Molecular Plant Pathology, 25, e13451. Available from: 10.1111/mpp.13451
DATA AVAILABILITY STATEMENT
The data that support the findings of this study are available from the corresponding author upon reasonable request.
REFERENCES
- Alfano, J.R. , Charkowski, A.O. , Deng, W.‐L. , Badel, J.L. , Petnicki‐Ocwieja, T. , Van Dijk, K. et al. (2000) The Pseudomonas syringae Hrp pathogenicity island has a tripartite mosaic structure composed of a cluster of type III secretion genes bounded by exchangeable effector and conserved effector loci that contribute to parasitic fitness and pathogenicity in plants. Proceedings of the National Academy of Sciences of the United States of America, 97, 4856–4861. [DOI] [PMC free article] [PubMed] [Google Scholar]
- Altschul, S.F. , Gish, W. , Miller, W. , Myers, E.W. & Lipman, D.J. (1990) Basic local alignment search tool. Journal of Molecular Biology, 215, 403–410. [DOI] [PubMed] [Google Scholar]
- Andrews, S. (2010) FastQC: a quality control tool for high throughput sequence data. Cambridge, UK: Babraham Bioinformatics, Babraham Institute. [Google Scholar]
- Aronesty, E. (2013) Comparison of sequencing utility programs. The Open Bioinformatics Journal, 7, TOBIOIJ‐7‐1. [Google Scholar]
- Badel, J.L. , Nomura, K. , Bandyopadhyay, S. , Shimizu, R. , Collmer, A. & He, S.Y. (2003) Pseudomonas syringae pv. tomato DC3000 HopPtoM (CEL ORF3) is important for lesion formation but not growth in tomato and is secreted and translocated by the Hrp type III secretion system in a chaperone‐dependent manner. Molecular Microbiology, 49, 1239–1251. [DOI] [PubMed] [Google Scholar]
- Badel, J.L. , Shimizu, R. , Oh, H.‐S. & Collmer, A. (2006) A Pseudomonas syringae pv. tomato avrE1/hopM1 mutant is severely reduced in growth and lesion formation in tomato. Molecular Plant–Microbe Interactions, 19, 99–111. [DOI] [PubMed] [Google Scholar]
- Baltrus, D.A. , Mccann, H.C. & Guttman, D.S. (2017) Evolution, genomics and epidemiology of Pseudomonas syringae: challenges in bacterial molecular plant pathology. Molecular Plant Pathology, 18, 152–168. [DOI] [PMC free article] [PubMed] [Google Scholar]
- Bender, C.L. , Alarcón‐Chaidez, F. & Gross, D.C. (1999) Pseudomonas syringae phytotoxins: mode of action, regulation, and biosynthesis by peptide and polyketide synthetases. Microbiology and Molecular Biology Reviews, 63, 266–292. [DOI] [PMC free article] [PubMed] [Google Scholar]
- Berge, O. , Monteil, C.L. , Bartoli, C. , Chandeysson, C. , Guilbaud, C. , Sands, D.C. et al. (2014) A user's guide to a data base of the diversity of Pseudomonas syringae and its application to classifying strains in this phylogenetic complex. PLoS One, 9, e105547. [DOI] [PMC free article] [PubMed] [Google Scholar]
- Bertani, G. (1951) Studies on lysogenesis. I. The mode of phage liberation by lysogenic Escherichia coli . Journal of Bacteriology, 62, 293–300. [DOI] [PMC free article] [PubMed] [Google Scholar]
- Blin, K. , Shaw, S. , Kloosterman, A.M. , Charlop‐Powers, Z. , Van Wezel, G.P. , Medema, M.H. et al. (2021) antiSMASH 6.0: improving cluster detection and comparison capabilities. Nucleic Acids Research, 49, W29–W35. [DOI] [PMC free article] [PubMed] [Google Scholar]
- Bogdanove, A.J. , Bauer, D.W. & Beer, S.V. (1998) Erwinia amylovora secretes DspE, a pathogenicity factor and functional AvrE homolog, through the Hrp (type III secretion) pathway. Journal of Bacteriology, 180, 2244–2247. [DOI] [PMC free article] [PubMed] [Google Scholar]
- Brooks, D.M. , Bender, C.L. & Kunkel, B.N. (2005) The Pseudomonas syringae phytotoxin coronatine promotes virulence by overcoming salicylic acid‐dependent defences in Arabidopsis thaliana . Molecular Plant Pathology, 6, 629–639. [DOI] [PubMed] [Google Scholar]
- Bundalovic‐Torma, C. , Lonjon, F. , Desveaux, D. & Guttman, D.S. (2022) Diversity, evolution, and function of Pseudomonas syringae effectoromes. Annual Review of Phytopathology, 60, 211–236. [DOI] [PubMed] [Google Scholar]
- Caponero, A. , Hutchison, M.L. , Iacobellis, N.S. & Gross, D.C. (1997) Isolation and characterization of mutants of Pseudomonas syringae pv. syringae defective in production of syringopeptins. In: Rudolh, K. , Burr, T.J. , Mansfield, J.W. , Stead, D. , Vivian, A. & Kietzell, J. (Eds.) Pseudomonas syringae pathovars and related pathogens. Developments in plant pathology (Volume 9). Berlin: Springer, pp. 202–207. [Google Scholar]
- Chakravarthy, S. , Worley, J.N. , Montes‐Rodriguez, A. & Collmer, A. (2018) Pseudomonas syringae pv. tomato DC3000 polymutants deploying coronatine and two type III effectors produce quantifiable chlorotic spots from individual bacterial colonies in Nicotiana benthamiana leaves. Molecular Plant Pathology, 19, 935–947. [DOI] [PMC free article] [PubMed] [Google Scholar]
- Crosse, J. & Garrett, C.M. (1966) Bacterial canker of stone‐fruits: infection experiments with Pseudomonas morsprunorum and P. syringae . Annals of Applied Biology, 58, 31–41. [Google Scholar]
- Cunnac, S. , Chakravarthy, S. , Kvitko, B.H. , Russell, A.B. , Martin, G.B. & Collmer, A. (2011) Genetic disassembly and combinatorial reassembly identify a minimal functional repertoire of type III effectors in Pseudomonas syringae . Proceedings of the National Academy of Sciences of the United States of America, 108, 2975–2980. [DOI] [PMC free article] [PubMed] [Google Scholar]
- Debroy, S. , Thilmony, R. , Kwack, Y.‐B. , Nomura, K. & He, S.Y. (2004) A family of conserved bacterial effectors inhibits salicylic acid‐mediated basal immunity and promotes disease necrosis in plants. Proceedings of the National Academy of Sciences of the United States of America, 101, 9927–9932. [DOI] [PMC free article] [PubMed] [Google Scholar]
- Dillon, M.M. , Almeida, R.N.D. , Laflamme, B. , Martel, A. , Weir, B.S. , Desveaux, D. et al. (2019) Molecular evolution of Pseudomonas syringae type III secreted effector proteins. Frontiers in Plant Science, 10, 418. [DOI] [PMC free article] [PubMed] [Google Scholar]
- Dudnik, A. & Dudler, R. (2014) Virulence determinants of Pseudomonas syringae strains isolated from grasses in the context of a small type III effector repertoire. BMC Microbiology, 14, 304. [DOI] [PMC free article] [PubMed] [Google Scholar]
- Ekanayake, G. , Gohmann, R. & Mackey, D. (2022) A method for quantitation of apoplast hydration in Arabidopsis leaves reveals water‐soaking activity of effectors of Pseudomonas syringae during biotrophy. Scientific Reports, 12, 18363. [DOI] [PMC free article] [PubMed] [Google Scholar]
- Geng, X. , Jin, L. , Shimada, M. , Kim, M.G. & Mackey, D. (2014) The phytotoxin coronatine is a multifunctional component of the virulence armament of Pseudomonas syringae . Planta, 240, 1149–1165. [DOI] [PMC free article] [PubMed] [Google Scholar]
- Hauck, P. , Thilmony, R. & He, S.Y. (2003) A Pseudomonas syringae type III effector suppresses cell wall‐based extracellular defense in susceptible Arabidopsis plants. Proceedings of the National Academy of Sciences of the United States of America, 100, 8577–8582. [DOI] [PMC free article] [PubMed] [Google Scholar]
- Helmann, T.C. , Deutschbauer, A.M. & Lindow, S.E. (2019) Genome‐wide identification of Pseudomonas syringae genes required for fitness during colonization of the leaf surface and apoplast. Proceedings of the National Academy of Sciences of the United States of America, 116, 18900–18910. [DOI] [PMC free article] [PubMed] [Google Scholar]
- Hmelo, L.R. , Borlee, B.R. , Almblad, H. , Love, M.E. , Randall, T.E. , Tseng, B.S. et al. (2015) Precision‐engineering the Pseudomonas aeruginosa genome with two‐step allelic exchange. Nature Protocols, 10, 1820–1841. [DOI] [PMC free article] [PubMed] [Google Scholar]
- Hulin, M.T. , Armitage, A.D. , Vicente, J.G. , Holub, E.B. , Baxter, L. , Bates, H.J. et al. (2018) Comparative genomics of Pseudomonas syringae reveals convergent gene gain and loss associated with specialization onto cherry (Prunus avium). New Phytologist, 219, 672–696. [DOI] [PubMed] [Google Scholar]
- Hulin, M.T. , Hill, L. , Jones, J.D.G. & Ma, W. (2023) Pangenomic analysis reveals plant NAD(+) manipulation as an important virulence activity of bacterial pathogen effectors. Proceedings of the National Academy of Sciences of the United States of America, 120, e2217114120. [DOI] [PMC free article] [PubMed] [Google Scholar]
- Hulin, M.T. , Jackson, R.W. , Harrison, R.J. & Mansfield, J.W. (2020) Cherry picking by pseudomonads: after a century of research on canker, genomics provides insights into the evolution of pathogenicity towards stone fruits. Plant Pathology, 69, 962–978. [DOI] [PMC free article] [PubMed] [Google Scholar]
- Hulin, M.T. , Mansfield, J.W. , Brain, P. , Xu, X. , Jackson, R.W. & Harrison, R.J. (2018) Characterization of the pathogenicity of strains of Pseudomonas syringae towards cherry and plum. Plant Pathology, 67, 1177–1193. [DOI] [PMC free article] [PubMed] [Google Scholar]
- Hulin, M.T. , Rabiey, M. , Zeng, Z. , Vadillo Dieguez, A. , Bellamy, S. , Swift, P. et al. (2023) Genomic and functional analysis of phage‐mediated horizontal gene transfer in Pseudomonas syringae on the plant surface. New Phytologist, 237, 959–973. [DOI] [PMC free article] [PubMed] [Google Scholar]
- Hulin, M.T. , Vadillo Dieguez, A. , Cossu, F. , Lynn, S. , Russell, K. , Neale, H.C. et al. (2022) Identifying resistance in wild and ornamental cherry towards bacterial canker caused by Pseudomonas syringae . Plant Pathology, 71, 949–965. [DOI] [PMC free article] [PubMed] [Google Scholar]
- Huynh, T.V. , Dahlbeck, D. & Staskawicz, B.J. (1989) Bacterial blight of soybean: regulation of a pathogen gene determining host cultivar specificity. Science, 245, 1374–1377. [DOI] [PubMed] [Google Scholar]
- Jackson, R.W. , Athanassopoulos, E. , Tsiamis, G. , Mansfield, J.W. , Sesma, A. , Arnold, D.L. et al. (1999) Identification of a pathogenicity island, which contains genes for virulence and avirulence, on a large native plasmid in the bean pathogen Pseudomonas syringae pathovar phaseolicola . Proceedings of the National Academy of Sciences of the United States of America, 96, 10875–10880. [DOI] [PMC free article] [PubMed] [Google Scholar]
- Jain, C. , Rodriguez, R.L. , Phillippy, A.M. , Konstantinidis, K.T. & Aluru, S. (2018) High throughput ANI analysis of 90K prokaryotic genomes reveals clear species boundaries. Nature Communications, 9, 5114. [DOI] [PMC free article] [PubMed] [Google Scholar]
- Jayaraman, J. , Yoon, M. , Applegate, E.R. , Stroud, E.A. & Templeton, M.D. (2020) AvrE1 and HopR1 from Pseudomonas syringae pv. actinidiae are additively required for full virulence on kiwifruit. Molecular Plant Pathology, 21, 1467–1480. [DOI] [PMC free article] [PubMed] [Google Scholar]
- Jones, J.D.G. & Dangl, J.L. (2006) The plant immune system. Nature, 444, 323–329. [DOI] [PubMed] [Google Scholar]
- King, E.O. , Ward, M.K. & Raney, D.E. (1954) Two simple media for the demonstration of pyocyanin and fluorescin. The Journal of Laboratory and Clinical Medicine, 44, 301–307. [PubMed] [Google Scholar]
- Kvitko, B.H. , Park, D.H. , Velasquez, A.C. , Wei, C.F. , Russell, A.B. , Martin, G.B. et al. (2009) Deletions in the repertoire of Pseudomonas syringae pv. tomato DC3000 type III secretion effector genes reveal functional overlap among effectors. PLoS Pathogens, 5, e1000388. [DOI] [PMC free article] [PubMed] [Google Scholar]
- Lam, H.N. , Chakravarthy, S. , Wei, H.‐L. , Buinguyen, H. , Stodghill, P.V. , Collmer, A. et al. (2014) Global analysis of the HrpL regulon in the plant pathogen Pseudomonas syringae pv. tomato DC3000 reveals new regulon members with diverse functions. PLoS One, 9, e106115. [DOI] [PMC free article] [PubMed] [Google Scholar]
- Lee, J. , Teitzel, G.M. , Munkvold, K. , Del Pozo, O. , Martin, G.B. , Michelmore, R.W. et al. (2012) Type III secretion and effectors shape the survival and growth pattern of Pseudomonas syringae on leaf surfaces. Plant Physiology, 158, 1803–1818. [DOI] [PMC free article] [PubMed] [Google Scholar]
- Lienqueo, I. , Villar, L. , Beltrán, F. , Correa, F. , Sagredo, B. , Guajardo, V. et al. (2024) Molecular, phenotypic and histological analysis reveals a multi‐tiered immune response and callose deposition in stone fruit rootstocks (Prunus spp.) against Pseudomonas syringae pv. syringae (Pss) infection. Scientia Horticulturae, 324, 112588. [Google Scholar]
- Lorang, J.M. , Shen, H. , Kobayashi, D. , Cooksey, D. & Keen, N.T. (1994) avrA and avrE in Pseudomonas syringae pv. tomato PT23 play a role in virulence on tomato plants. Molecular Plant–Microbe Interactions, 7, 508–515. [Google Scholar]
- Love, M.I. , Huber, W. & Anders, S. (2014) Moderated estimation of fold change and dispersion for RNA‐seq data with DESeq2. Genome Biology, 15, 550. [DOI] [PMC free article] [PubMed] [Google Scholar]
- Lovelace, A.H. , Dorhmi, S. , Hulin, M.T. , Li, Y. , Mansfield, J.W. & Ma, W. (2023) Effector identification in plant pathogens. Phytopathology, 113, 637–650. [DOI] [PubMed] [Google Scholar]
- Lovelace, A.H. & Ma, W. (2022) How do bacteria transform plants into their oasis? Cell Host & Microbe, 30, 412–414. [DOI] [PubMed] [Google Scholar]
- Lozano‐Duran, R. , Bourdais, G. , He, S.Y. & Robatzek, S. (2014) The bacterial effector HopM1 suppresses PAMP‐triggered oxidative burst and stomatal immunity. New Phytologist, 202, 259–269. [DOI] [PubMed] [Google Scholar]
- Melotto, M. , Underwood, W. , Koczan, J. , Nomura, K. & He, S.Y. (2006) Plant stomata function in innate immunity against bacterial invasion. Cell, 126, 969–980. [DOI] [PubMed] [Google Scholar]
- Minh, B.Q. , Schmidt, H.A. , Chernomor, O. , Schrempf, D. , Woodhams, M.D. , Von Haeseler, A. et al. (2020) IQ‐TREE 2: new models and efficient methods for phylogenetic inference in the genomic era. Molecular Biology and Evolution, 37, 1530–1534. [DOI] [PMC free article] [PubMed] [Google Scholar]
- Misas‐Villamil, J.C. , Kolodziejek, I. , Crabill, E. , Kaschani, F. , Niessen, S. , Shindo, T. et al. (2013) Pseudomonas syringae pv. syringae uses proteasome inhibitor syringolin A to colonize from wound infection sites. PLoS Pathogens, 9, e1003281. [DOI] [PMC free article] [PubMed] [Google Scholar]
- Mo, Y.‐Y. & Gross, D.C. (1991) Plant signal molecules activate the syrB gene, which is required for syringomycin production by Pseudomonas syringae pv. syringae . Journal of Bacteriology, 173, 5784–5792. [DOI] [PMC free article] [PubMed] [Google Scholar]
- Moreno‐Perez, A. , Ramos, C. & Rodriguez‐Moreno, L. (2021) HrpL regulon of bacterial pathogen of woody host Pseudomonas savastanoi pv. savastanoi NCPPB 3335. Microorganisms, 9, 1447. [DOI] [PMC free article] [PubMed] [Google Scholar]
- Munkvold, K.R. , Russell, A.B. , Kvitko, B.H. & Collmer, A. (2009) Pseudomonas syringae pv. tomato DC3000 type III effector HopAA1‐1 functions redundantly with chlorosis‐promoting factor PSPTO4723 to produce bacterial speck lesions in host tomato. Molecular Plant–Microbe Interactions, 22, 1341–1355. [DOI] [PubMed] [Google Scholar]
- Neale, H.C. , Hulin, M.T. , Harrison, R.J. , Jackson, R.W. , Mansfield, J.W. & Arnold, D.L. (2020) An improved conjugation method for Pseudomonas syringae . Journal of Microbiological Methods, 177, 106025. [DOI] [PubMed] [Google Scholar]
- Newberry, E.A. , Ebrahim, M. , Timilsina, S. , Zlatkovic, N. , Obradovic, A. , Bull, C.T. et al. (2019) Inference of convergent gene acquisition among Pseudomonas syringae strains isolated from watermelon, cantaloupe, and squash. Frontiers in Microbiology, 10, 270. [DOI] [PMC free article] [PubMed] [Google Scholar]
- Nomura, K. , Andreazza, F. , Cheng, J. , Dong, K. , Zhou, P. & He, S.Y. (2023) Bacterial pathogens deliver water‐ and solute‐permeable channels to plant cells. Nature, 621, 586–591. [DOI] [PMC free article] [PubMed] [Google Scholar]
- Patro, R. , Duggal, G. , Love, M.I. , Irizarry, R.A. & Kingsford, C. (2017) Salmon provides fast and bias‐aware quantification of transcript expression. Nature Methods, 14, 417–419. [DOI] [PMC free article] [PubMed] [Google Scholar]
- Quigley, N.B. & Gross, D.C. (1994) Syringomycin production among strains of Pseudomonas syringae pv. syringae: conservation of the syrB and syrD genes and activation of phytotoxin production by plant signal molecules. Molecular Plant–Microbe Interactions, 7, 78–90. [DOI] [PubMed] [Google Scholar]
- R Core Team . (2022) R: a language and environment for statistical computing. Vienna: R Foundation for Statistical Computing. [Google Scholar]
- Roussin‐Leveillee, C. , Lajeunesse, G. , St‐Amand, M. , Veerapen, V.P. , Silva‐Martins, G. , Nomura, K. et al. (2022) Evolutionarily conserved bacterial effectors hijack abscisic acid signaling to induce an aqueous environment in the apoplast. Cell Host & Microbe, 30, 489–501e4. [DOI] [PMC free article] [PubMed] [Google Scholar]
- Ruiz‐Bedoya, T. , Wang, P.W. , Desveaux, D. & Guttman, D.S. (2023) Cooperative virulence via the collective action of secreted pathogen effectors. Nature Microbiology, 8, 640–650. [DOI] [PubMed] [Google Scholar]
- Schellenberg, B. , Ramel, C. & Dudler, R. (2010) Pseudomonas syringae virulence factor syringolin a counteracts stomatal immunity by proteasome inhibition. Molecular Plant–Microbe Interactions, 23, 1287–1293. [DOI] [PubMed] [Google Scholar]
- Schliep, K.P. (2011) phangorn: phylogenetic analysis in R. Bioinformatics, 27, 592–593. [DOI] [PMC free article] [PubMed] [Google Scholar]
- Scholz‐Schroeder, B.K. , Hutchison, M.L. , Grgurina, I. & Gross, D.C. (2001) The contribution of syringopeptin and syringomycin to virulence of Pseudomonas syringae pv. syringae strain B301D on the basis of sypA and syrB1 biosynthesis mutant analysis. Molecular Plant–Microbe Interactions, 14, 336–348. [DOI] [PubMed] [Google Scholar]
- Shao, X. , Tan, M. , Xie, Y. , Yao, C. , Wang, T. , Huang, H. et al. (2021) Integrated regulatory network in Pseudomonas syringae reveals dynamics of virulence. Cell Reports, 34, 108920. [DOI] [PubMed] [Google Scholar]
- Staskawicz, B.J. , Dahlbeck, D. & Keen, N.T. (1984) Cloned avirulence gene of Pseudomonas syringae pv. glycinea determines race‐specific incompatibility on Glycine max (L.) Merr. Proceedings of the National Academy of Sciences of the United States of America, 81, 6024–6028. [DOI] [PMC free article] [PubMed] [Google Scholar]
- Tonkin‐Hill, G. , Macalasdair, N. , Ruis, C. , Weimann, A. , Horesh, G. , Lees, J.A. et al. (2020) Producing polished prokaryotic pangenomes with the Panaroo pipeline. Genome Biology, 21, 180. [DOI] [PMC free article] [PubMed] [Google Scholar]
- Wei, H.L. & Collmer, A. (2018) Defining essential processes in plant pathogenesis with Pseudomonas syringae pv. tomato DC3000 disarmed polymutants and a subset of key type III effectors. Molecular Plant Pathology, 19, 1779–1794. [DOI] [PMC free article] [PubMed] [Google Scholar]
- William, S. , Feil, H. & Copeland, A. (2012) Bacterial genomic DNA isolation using CTAB. Sigma, 50, 1–4. [Google Scholar]
- Xin, X.F. , Kvitko, B. & He, S.Y. (2018) Pseudomonas syringae: what it takes to be a pathogen. Nature Reviews Microbiology, 16, 316–328. [DOI] [PMC free article] [PubMed] [Google Scholar]
- Xu, S. , Dai, Z. , Guo, P. , Fu, X. , Liu, S. , Zhou, L. et al. (2021) ggtreeExtra: compact visualization of richly annotated phylogenetic data. Molecular Biology and Evolution, 38, 4039–4042. [DOI] [PMC free article] [PubMed] [Google Scholar]
- Yu, G. , Smith, D.K. , Zhu, H. , Guan, Y. , Lam, T.T.Y. & Mcinerny, G. (2016) ggtree: an r package for visualization and annotation of phylogenetic trees with their covariates and other associated data. Methods in Ecology and Evolution, 8, 28–36. [Google Scholar]
- Yuan, X. , Hulin, M.T. & Sundin, G.W. (2021) Effectors, chaperones, and harpins of the Type III secretion system in the fire blight pathogen Erwinia amylovora: a review. Journal of Plant Pathology, 103, 25–39. [Google Scholar]
Associated Data
This section collects any data citations, data availability statements, or supplementary materials included in this article.
Supplementary Materials
Figure S1. Principal component analysis (PCA) comparing gene expression of Pss 9644 triplicate samples grown up in rich medium (King’s B) as a control marked in red and hrp‐inducing minimal medium (HMM) as treatment represented in blue.
Figure S2. Heat map with differential gene expression log2 fold‐change ratio, comparing genes of Pss 9644 triplicate samples grown up in rich medium (King’s B; KB) as a control and hrp‐inducing minimal medium (HMM) as treatment. Red colours represent genes that are upregulated in HMM compared to KB. Blue colours represent genes that are downregulated in HMM compared to KB. Numbers in genes represent their ID in the annotated genome. Numbers in genes represent their ID in the annotated genome. Highlighted gene names correspond to toxins and effectors. g672: avrRpm1, g2569: sypB, g3744: hopBE1, g2562: syrE, g714: hopAG1, g4241:hopI1, g1173: hopA1, g1139: hopM1, g2570: sypC, g1827: hopH1, g1761: hopAZ1, g2568: sypA, g1141: avrE1, g1136: hopAA1, g4816: hopAR1.
Figure S3. (a) Kinetic growth curves over 26 h in King’s B broth of Pss 9644 and its deletion mutants. This experiment was conducted once with three technical replicates per treatment. Nonlinear regression analysis was performed for logarithmic growth, and the growth constant rates (k) are indicated for each strain. Lines represent the trend of average OD600 timepoints from the three replicates per strain. (b) End‐point pairwise differences between strains were assessed via analysis of variance and post hoc Tukey tests. WT: wild‐type, CEL: conserved effector locus, F: FLEXIBLE group, P: PRUNUS group, C: CORE group, Eff: all effectors in the CEL, FLEXIBLE, PRUNUS and CORE groups, sa: syringolin A cluster, ss: syringomycin/syringopeptin cluster, T: both toxin clusters. Letters in common above data points indicate no significant difference between treatments (p > 0.05).
Figure S4. Representative illustration of a lesion score on cherry woody tissue pathogenicity test at 8 weeks after inoculation.
Figure S5. Representative illustration of pathogenicity test in immature cherry fruits at 3 and 6 days post‐inoculation (dpi).
Figure S6. Representative illustration of pathogenicity test in cherry leaves at 3 and 6 days post‐inoculation (dpi).
Figure S7. Initial enumeration of Pss 9644 and its deletion mutants recovered from leaf inoculation sites after 30 min of infiltration on Prunus avium ‘Sweetheart’ from (a) Figure 5b, (b) Figure 5d and (c) Figure 7. Data from (a) and (b) are from three repeated experiments with 45 sites for each treatment in total. Data from (c) are from two repeated experiments with 10 sites for each treatment in total. All data were analysed after log transformation by analysis of variance and post hoc Tukey–Kramer HSD tests to assess pair‐wise differences between mutants. The Tukey HSD procedure produced p‐values adjusted for multiple testing. Box plots indicate minimum, first quartile, median (line), mean (diamond) third quartile maximum values with bars indicating outliers.
Table S1. Metainformation on Pseudomonas syringae genomes used for Figure 1, including phylogroup, host (cherry, other Prunus or non‐Prunus), type III effectors and toxin gene cluster presence.
Table S2. Plasmid vectors and constructs used in this study for Pss 9644 virulence factors deletions in the genome.
Table S3. Primers designed and used for this study for Pss 9644 virulence gene deletion in the genome.
Table S4. PCR programme details used for the different stages of construct cloning and putative mutant check.
Table S5. Transcript per million (TPM) of Pss 9644 triplicate samples grown up in rich medium (King’s B) as a control and hrp‐inducing minimal medium (HMM) as treatment.
Data Availability Statement
The data that support the findings of this study are available from the corresponding author upon reasonable request.