

Abstract
INTRODUCTION
The presence of multiple cardiometabolic diseases (CMDs) has been linked to increased dementia risk, but the combined influence of CMDs on cognition and brain structure across the life course is unclear.
METHODS
In the UK Biobank, 46,562 dementia‐free participants completed a cognitive test battery at baseline and a follow‐up visit 9 years later, at which point 39,306 also underwent brain magnetic resonance imaging. CMDs (diabetes, heart disease, and stroke) were ascertained from medical records. Data were analyzed using age‐stratified (middle age [< 60] versus older [≥ 60]) mixed‐effects models and linear regression.
RESULTS
A higher number of CMDs was associated with significantly steeper global cognitive decline in older (β = –0.008; 95% confidence interval: −0.012, −0.005) but not middle age. Additionally, the presence of multiple CMDs was related to smaller total brain volume, gray matter volume, white matter volume, and hippocampal volume and larger white matter hyperintensity volume, even in middle age.
DISCUSSION
CMDs are associated with cognitive decline in older age and poorer brain structural health beginning already in middle age.
Highlights
We explored the association of CMDs with cognitive decline and brain MRI measures.
CMDs accelerated cognitive decline in older (≥60y) but not middle (<60) age.
CMDs were associated with poorer brain MRI parameters in both middle and older age.
Results highlight the connection between CMDs and cognitive/brain aging.
Keywords: brain magnetic resonance imaging, cardiometabolic disease, cognitive decline, cognitive domains, population‐based follow‐up study, UK Biobank
1. INTRODUCTION
Cardiometabolic diseases (CMDs), a cluster of related conditions including type 2 diabetes (T2D), heart disease (HD), and stroke, 1 , 2 , 3 are well‐established individual risk factors for cognitive/brain aging and dementia. 4 Cardiometabolic multimorbidity—the coexistence of ≥ 2 CMDs in the same individual—has risen greatly with population aging 5 and is estimated to affect up to 30% of older adults. 6 The 2020 Lancet Commission on Dementia Prevention, Intervention, and Care has underscored the need for more research on combinations of cardiovascular and metabolic risk factors in relation to dementia, 4 and to this end recent studies have described a dose‐dependent increase in dementia risk with one, two, and three co‐morbid CMDs. 7 , 8 , 9 , 10 However, less is known about the combined influence of CMDs on the subtle cognitive decline and brain structural changes that can occur in the decades before dementia diagnosis.
A few studies have highlighted the relationship between cardiometabolic multimorbidity and accelerated decline in global cognitive function in older age, 8 , 11 and previous cross‐sectional research has associated various constellations of co‐morbid CMDs with lower performance in cognitive domains such as reasoning, information processing speed, and memory. 12 However, evidence on the association of cardiometabolic multimorbidity with long‐term changes in domain‐specific cognitive function is limited, and it is unclear how early in the life course such changes could begin.
Brain magnetic resonance imaging (MRI) studies have linked cardiometabolic multimorbidity 10 and unfavorable cardiovascular risk profiles 13 , 14 , 15 to lower volumes of subcortical structures and poorer white matter microstructural integrity in older age. Moreover, recent studies suggest that cardiovascular and metabolic risk factors could be associated with vascular lesions already in middle age. 16 , 17 , 18 , 19 However, evidence is lacking on the relationship between cardiometabolic multimorbidity and brain structure at different stages of life.
In the present study, using longitudinal data from middle‐aged (< 60 years) and older (≥ 60 years) adults in the UK Biobank, we aimed to (1) assess the association between cardiometabolic multimorbidity and changes in global and domain‐specific cognitive function and (2) identify the brain regions that are possibly associated with cardiometabolic multimorbidity in middle and older age.
RESEARCH IN CONTEXT
Systematic review: The authors reviewed the literature using traditional (e.g., PubMed) sources. Cardiometabolic multimorbidity (the coexistence of ≥ 2 cardiometabolic diseases [CMDs]) has been related to increased risk of dementia in several recent studies. However, questions remain about the relationship between cardiometabolic multimorbidity and the cognitive decline and brain structural changes that can occur in the decades before dementia diagnosis.
Interpretation: Over 9 years of follow‐up, the presence of a greater number of CMDs was related to a steeper decline in processing speed in middle age and a steeper decline in global cognitive function, working memory, verbal/numeric reasoning, and processing speed in older age. Moreover, cardiometabolic multimorbidity was related to smaller regional brain volumes and a greater white matter hyperintensity burden already in middle age.
Future directions: Future research should explore the mechanisms underlying the relationships among CMDs, neurodegenerative/vascular brain damage, and cognitive decline.
2. METHODS
2.1. Study design and population
The UK Biobank is an ongoing prospective longitudinal study of > 500,000 adults aged 40 to 70 recruited from across the United Kingdom. 20 The baseline examination was conducted between 2006 and 2010 and consisted of a series of questionnaires, cognitive tests, and assessments of anthropometric measures and physical function. Peripheral blood samples were collected for genotyping and biochemical assays. Approximately 9 years later (between 2014 and 2020), a subset of participants underwent a follow‐up examination involving, among other assessments, a brain MRI scan, and a repeat of the cognitive test battery.
Of the 52,957 UK Biobank participants (10.5%) who participated in the follow‐up examination, we excluded 5 with prevalent dementia and 20 with type 1 diabetes. We further excluded 6291 people with no available cognitive test data and 79 with missing information on baseline CMD status, leaving a study population of 46,562 for the analysis of changes in cognitive function (Figure S1 in supporting information). A total of 39,306 individuals were included in the analysis of brain structural differences, after excluding 6465 who did not undergo a brain MRI scan and 791 with specific neurological diseases (including Parkinson's disease, brain cancer, encephalitis, head injury, etc.; see Table S1 in supporting information for more details). Compared to the overall UK Biobank population, our study sample was younger; better educated; had a higher socioeconomic status (SES); and had lower prevalence of CMDs, obesity, and hypertension (Table S2 in supporting information).
2.2. Assessment of CMDS
Following previous studies on cardiometabolic multimorbidity, 1 , 2 , 3 , 7 , 8 , 9 , 10 , 21 CMDs were defined as T2D, HD, and stroke. CMDs were assessed at baseline using data from multiple sources. Participants were classified as having T2D if they had any of the following: hemoglobin A1c ≥ 6.5%, fasting plasma glucose ≥ 126 mg/dL, a self‐reported history of diabetes, use of glucose‐lowering medications, or medical record of diabetes. HD (including myocardial infarction, angina, atrial fibrillation, and heart failure) and stroke were ascertained based on self‐reported medical history and medical records. Codes used to identify T2D, HD, and stroke are listed in Table S3 in supporting information.
CMD status was dichotomized according to the absence or presence of CMDs (i.e., CMD free vs. CMDs). We also categorized participants according to total number of CMDs (i.e., 0, 1, or ≥ 2); cardiometabolic multimorbidity was defined as the presence of ≥ 2 co‐morbid CMDs.
2.3. Assessment of global and domain‐specific cognitive function
At both baseline and the follow‐up examination, cognitive function was evaluated based on five neuropsychological tests administered through a touchscreen interface. The tests covered five different cognitive domains: working memory (numeric memory test; scored as the longest numeric string correctly recalled), prospective memory (prospective memory test; scored as ability to successfully carry out an instruction after a filled delay), visual memory (pairs matching test; scored as the number of errors when recalling the positions of pairs of matching cards), verbal/numeric reasoning (fluid intelligence test; scored as the number of correct answers to timed logic/reasoning‐type questions), and processing speed (reaction time test; scored as mean time to correctly match cards with matching symbols). Detailed descriptions of each test in the cognitive battery have been previously published. 22 , 23
For tests of working memory, prospective memory, and verbal/numeric reasoning, higher raw scores indicate better performance. For tests of processing speed and visual memory, higher raw scores indicate worse performance, so values were reversed for ease of comprehension. Working memory, prospective memory, and verbal/numeric reasoning scores were Z transformed to enable comparison. Processing speed scores were log‐transformed given skewed distribution, and visual memory scores were log(x+1)‐transformed given skewed distribution and zero inflation. Finally, raw scores from each cognitive test were individually converted to Z scores and averaged to yield a measure of global cognition, with higher values reflecting better overall cognitive function.
2.4. Brain MRI acquisition and pre‐processing
Brain MRI image acquisition and processing protocols in the UK Biobank have been described in detail previously. 24 , 25 Briefly, during the follow‐up examination T1 and T2 fluid‐attenuated inversion recovery imaging were performed to provide volumes of brain structures and white matter lesions. 25 In this study, we examined total brain volume (TBV), gray matter volume (GMV), white matter volume (WMV), hippocampal volume (HV), and white matter hyperintensity volume (WMHV), all of which were normalized for intra‐cranial volume. TBV, GMV, WMV, and HV were converted to Z scores to enable comparison. WMHV was log‐transformed given its skewed distribution.
2.5. Assessment of covariates
Education (college/university vs. not) was dichotomized based on the highest level of formal education attained. SES was ascertained using Townsend Deprivation Indices (TDI), a measure of socioeconomic deprivation based on neighborhood levels of unemployment, household overcrowding, car non‐ownership, and home non‐ownership. 26 Self‐reported race was dichotomized as White versus non‐White. Height and weight were measured during the baseline examination after participants removed their shoes and heavy outer clothing. Body mass index (BMI) was calculated as weight (kg) divided by the square of height (m2) and classified as underweight (< 20 kg/m2), normal weight (≥ 20 to < 25 kg/m2), overweight (≥ 25 to < 30 kg/m2), or obese (≥ 30 kg/m2) according to the recommended BMI categories for older adults. 27 At baseline, two blood pressure readings were recorded and averaged. Hypertension was defined as systolic blood pressure ≥140 mm Hg, diastolic blood pressure ≥90 mm Hg, self‐reported history of hypertension, or the use of antihypertensive medications. Smoking and drinking habits were categorized as never, former, or current smoking/drinking according to self‐report. Physical activity was measured using the International Physical Activity Questionnaire and classified as inactive, moderate, or active. Apolipoprotein E (APOE) genotyping was performed using blood samples collected at baseline and dichotomized as carriers versus non‐carriers of the ε4 allele.
2.6. Statistical analysis
Baseline characteristics of the study participants by CMD status (CMD free vs. CMDs) were assessed using χ2 tests for categorical variables and t tests for continuous variables.
First, linear mixed‐effects models were used to estimate β coefficients and 95% confidence intervals (CIs) for the association between CMD status and changes in global and domain‐specific cognitive function. The fixed effect included baseline CMD status, follow‐up time (in years), and their interaction. The random effect included random intercept and slope, allowing individual differences in cognitive function to be reflected at baseline and across follow‐up. Next, linear regression models were used to estimate β coefficients and 95% CIs for the association between CMD status at baseline and brain structural measures among the subsample who underwent brain MRI during follow‐up. To assess the role of cardiometabolic multimorbidity in the associations, similar analyses were conducted using total number of CMDs (as both a categorical and a continuous variable) as the exposure. All analyses were repeated after stratifying by baseline age (middle age [< 60 years; n = 31,196]) versus older age [≥ 60 years; n = 15,366]). We additionally assessed the interaction between CMD status and age cohort by incorporating the cross‐product term of these variables (CMD status × age cohort) into the models.
Covariate adjustment strategy is illustrated in Figure S2 in supporting information: All models were first adjusted for socio‐demographic factors (age, sex, education, SES, and race) and next further adjusted for vascular risk factors (BMI, hypertension, smoking, alcohol consumption, and physical activity) and APOE ε4 carrier status. In analyses of neuroimaging data, we additionally adjusted for head position in the MRI scanner (in terms of x‐, y‐, and z‐axis coordinates), scanner table position, and assessment center. Missing values for covariates (education level [n = 152, 0.33%], SES [n = 44, 0.09%], race [n = 111, 0.24%], BMI [n = 66, 0.14%], hypertension [n = 24, 0.05%], smoking [n = 93, 0.20%], alcohol consumption [n = 12, 0.03%], physical activity [n = 6868, 14.75%], and APOE ε4 carrier status [n = 7721, 16.58%]) were imputed using fully conditional specification, with estimates pooled from five iterations.
In sensitivity analyses we repeated the analysis after (1) using non‐imputed data for covariates and (2) excluding participants who received a dementia diagnosis over follow‐up to account for the possibility of reverse causality related to preclinical dementia.
All statistical analyses were performed using Stata SE 16.0 (StataCorp). P values < 0.05 were considered statistically significant.
3. RESULTS
3.1. Baseline characteristics of the study population
Characteristics of the 46,562 study participants (mean age 55.1 ± 7.6; 51.4% female) are shown in Table 1. At baseline, 42,828 (92.0%) were CMD free and 3734 (8.0%) had CMDs, including 3437 (7.4%) with 1 CMD and 297 (0.6%) with ≥ 2 CMDs. Among both the middle‐aged and older cohorts, those with CMDs were more likely to be older, male, have lower education and SES, have a higher BMI, smoke, abstain from drinking alcohol, be physically inactive, and have hypertension. No differences were found in terms of race or APOE ε4 carrier status. Baseline characteristics were similarly distributed in the neuroimaging subsample (Table S4 in supporting information).
TABLE 1.
Characteristics of the study population by CMD status.
|
Middle age (< 60 years) (n = 31,196) |
Older age (≥ 60 years) (n = 15,366) |
|||||
|---|---|---|---|---|---|---|
|
CMD free (n = 29,513) |
CMDs (n = 1683) |
P value |
CMD free (n = 13,315) |
CMDs (n = 2051) |
P value |
|
| Baseline characteristics | ||||||
| Age, years | 50.8 ± 5.5 | 52.9 ± 4.9 | < 0.001 | 63.4 ± 2.7 | 64.0 ± 2.8 | < 0.001 |
| Sex | ||||||
| Female | 16,428 (55.7) | 622 (37.0) | < 0.001 | 6292 (47.3) | 590 (28.8) | < 0.001 |
| Male | 13,085 (44.3) | 1061 (63.0) | 7023 (52.8) | 1461 (71.2) | ||
| College/university educated | 14,628 (49.7) | 684 (40.9) | < 0.001 | 5650 (42.7) | 789 (38.7) | 0.001 |
| White | 26,983 (91.6) | 1540 (91.7) | 0.877 | 12,584 (94.8) | 1932 (94.4) | 0.412 |
| Townsend Deprivation Index |
− 1.8 ± 2.8 |
− 1.3 ± 2.9 |
< 0.001 |
− 2.2 ± 2.5 |
− 1.9 ± 2.8 |
< 0.001 |
| BMI, kg/m2 | 26.4 ± 4.3 | 29.9 ± 5.7 | <0.001 | 26.5 ± 3.8 | 28.5 ± 4.3 | < 0.001 |
| Underweight (< 20) | 856 (2.9) | 18 (1.1) | < 0.001 | 269 (2.0) | 10 (0.5) | < 0.001 |
| Normal (20–25) | 11,508 (39.1) | 298 (17.8) | 4717 (35.5) | 390 (19.0) | ||
| Overweight (25–30) | 12,065 (40.9) | 640 (38.2) | 6226 (46.8) | 1012 (49.4) | ||
| Obese (≥ 30) | 5044 (17.1) | 719 (42.9) | 2087 (15.7) | 637 (31.1) | ||
| Smoking | ||||||
| Never | 18.945 (64.3) | 878 (52.3) | < 0.001 | 7356 (55.4) | 943 (46.1) | < 0.001 |
| Former | 8460 (28.7) | 656 (39.1) | 5343 (40.2) | 989 (48.3) | ||
| Current | 2.056 (7.0) | 146 (8.7) | 583 (4.4) | 114 (5.6) | ||
| Alcohol | ||||||
| Never | 697 (2.4) | 55 (3.3) | < 0.001 | 350 (2.6) | 55 (2.7) | 0.039 |
| Former | 636 (2.2) | 65 (3.9) | 251 (1.9) | 56 (2.7) | ||
| Current | 28,176 (95.5) | 1560 (92.9) | 12,709 (95.5) | 1940 (94.6) | ||
| Physical activity | ||||||
| Inactive | 4894 (19.4) | 350 (24.3) | < 0.001 | 1662 (14.8) | 360 (20.6) | < 0.001 |
| Moderate | 10,645 (42.1) | 604 (42.0) | 4762 (42.4) | 731 (41.8) | ||
| Active | 9726 (38.5) | 485 (33.7) | 4,817 (42.9) | 658 (37.6) | ||
| Hypertension | 4792 (16.2) | 799 (47.6) | < 0.001 | 3699 (27.8) | 1162 (57.2) | < 0.001 |
| APOE ε4 carrier | 7016 (28.5) | 380 (28.0) | 0.685 | 2859 (25.7) | 460 (27.2) | 0.177 |
| Cognitive test scores | ||||||
|---|---|---|---|---|---|---|
| Numeric memory test (number of digits recalled) | ||||||
| Baseline | 7.0 ± 1.4 | 6.9 ± 1.6 | 0.619 | 6.8 ± 1.4 | 7.0 ± 1.4 | 0.0849 |
| Follow‐up | 6.8 ± 1.5 | 6.5 ± 1.8 | < 0.001 | 6.4 ± 1.6 | 6.1 ± 1.8 | < 0.001 |
| Prospective memory test (0–2 pts) | ||||||
| Baseline | 1.1 ± 0.3 | 1.1 ± 0.4 | 0.71 | 1.1 ± 0.4 | 1.1 ± 0.4 | 0.292 |
| Follow‐up | 1.1 ± 0.4 | 1.1 ± 0.4 | 0.929 | 1.1 ± 0.5 | 1.1 ± 0.5 | 0.595 |
| Pairs matching test (number of errors) | ||||||
| Baseline | 3.6 ± 2.9 | 3.7 ± 3.1 | 0.059 | 4.2 ± 3.3 | 4.2 ± 3.4 | 0.905 |
| Follow‐up | 3.4 ± 2.8 | 3.6 ± 2.9 | 0.006 | 4.2 ± 3.2 | 4.3 ± 3.4 | 0.079 |
| Fluid intelligence test (number of correct answers) | ||||||
| Baseline | 6.8 ± 2.1 | 6.4 ± 2.1 | < 0.001 | 6.6 ± 2.0 | 6.6 ± 2.0 | 0.375 |
| Follow‐up | 6.7 ± 2.1 | 6.5 ± 2.1 | < 0.001 | 6.3 ± 2.0 | 6.2 ± 2.1 | < 0.001 |
| Reaction time test (milliseconds) | ||||||
| Baseline | 523 ± 94 | 533 ± 104 | < 0.001 | 566 ± 106 | 567 ± 104 | 0.740 |
| Follow‐up | 579 ± 103 | 594 ± 111 | < 0.001 | 632 ± 116 | 640 ± 119 | 0.006 |
| Volumes of brain MRI parameters (mm3) | ||||||
|---|---|---|---|---|---|---|
| Total brain | 1175,854 ± 110,920 | 1169,969 ± 111,324 | 0.055 | 1131,352 ± 106,726 | 1125,960 ± 103,375 | 0.107 |
| Gray matter | 626,285 ± 54,138 | 617,238 ± 54,994 | < 0.001 | 593,185 ± 51,983 | 589,810 ± 51,736 | 0.016 |
| White matter | 549,569 ± 61,704 | 552,730 ± 61,974 | 0.0639 | 538,167 ± 61,483 | 546,150 ± 60,083 | <0.001 |
| Hippocampus | 7,823 ± 855 | 7,721 ± 913 | < 0.001 | 7,368 ± 855 | 7,270 ± 915 | <0.001 |
| White matter hyperintensities | 3,508 ± 4,448 | 5,077 ± 6,203 | < 0.001 | 7,849 ± 8,584 | 9,457 ± 10,545 | <0.001 |
Note: Data are presented as means ± standard deviations or number (proportion, %).
Missing data: 152 for education level, 111 for race, 44 for Townsend Deprivation Index, 66 for BMI, 93 for smoking status, 12 for alcohol drinking, 6868 for physical activity level,; 24 for hypertension, 7721 for APOE ε4 carrier status.
Abbreviations: APOE, apolipoprotein E; BMI, body mass index; CMDs, cardiometabolic diseases; MRI, magnetic resonance imaging.
3.2. Association between CMDs and global and domain‐specific cognitive decline
Over the follow‐up (median 9.26 years [interquartile range 7.61–10.34 years], accounting for 411,045 person‐years), the presence of CMDs was associated with significantly steeper decline in global cognitive function (β = −0.005) as well as several individual cognitive domains including working memory, visual memory, and processing speed (Table 2).
TABLE 2.
β coefficients and 95% confidence interval (CI) for the association between CMD status and changes in global and domain‐specific cognitive function over the follow‐up: Results from mixed‐effects models.
| Domain‐specific cognitive function | ||||||||||||
|---|---|---|---|---|---|---|---|---|---|---|---|---|
| Global cognitive function | Working memory | Prospective memory | Visual memory | Verbal/numeric reasoning | Processing speed | |||||||
| n | β (95% CI) | n | β (95% CI) | n | β (95% CI) | n | β (95% CI) | n | β (95% CI) | n | β (95% CI) | |
| Whole population (n = 46,562) | ||||||||||||
| CMD free × time | 42,828 | Reference | 32,988 | Reference | 42,818 | Reference | 42,828 | Reference | 42,309 | Reference | 42,828 | Reference |
| CMDs × time | 3734 |
−0.005 (−0.008, −0.003) |
2787 |
−0.024 (−0.033, −0.014) |
3731 |
−0.004 (−0.011, 0.002) |
3734 |
−0.004 (−0.007, −0.001) |
3651 |
−0.004 (−0.009, 0.001) |
3734 |
−0.002 (−0.002, −0.001) |
| 1 CMD × time | 3437 |
−0.005 (−0.008, −0.003) |
2576 |
−0.025 (−0.034, −0.015) |
3435 |
−0.005 (−0.012, 0.002) |
3437 |
−0.004 (−0.007, −0.001) |
3365 |
−0.004 (−0.010, 0.001) |
3437 |
−0.002 (−0.002, −0.001) |
| ≥ 2 CMDs × time | 297 |
−0.005 (−0.015, 0.004) |
211 |
−0.014 (−0.044, 0.016) |
296 |
0.004 (−0.019, 0.027) |
297 |
−0.002 (−0.012, 0.009) |
286 |
0.000 (−0.018, 0.018) |
297 |
−0.002 (−0.004, 0.001) |
| Number of CMDs |
−0.005 (−0.007, −0.002) |
−0.018 (−0.027, −0.010) |
−0.003 (−0.009, 0.003) |
−0.003 (−0.006, −0.001) |
−0.004 (−0.008, 0.001) |
−0.001 (−0.002, −0.001) |
||||||
| Middle age (< 60) (n = 31,196) | ||||||||||||
| CMD free × time | 29,513 | Reference | 22,851 | Reference | 29,508 | Reference | 29,513 | Reference | 29,275 | Reference | 29,513 | Reference |
| CMDs × time | 1683 |
−0.002 (−0.005, 0.002) |
1277 |
−0.011 (−0.026, 0.003) |
1681 |
0.001 (−0.008, 0.010) |
1683 |
−0.003 (−0.007, 0.002) |
1659 |
0.006 (−0.002, 0.014) |
1683 |
−0.001 (−0.0020, −0.0003) |
| 1 CMD × time | 1576 |
−0.002 (−0.006, 0.001) |
1197 |
−0.010 (−0.025, 0.005) |
1575 |
0.001 (−0.009, 0.010) |
1576 |
−0.003 (−0.008, 0.001) |
1556 |
0.005 (−0.004, 0.013) |
1576 |
−0.001 (−0.0023, −0.0005) |
| ≥2 CMDs × time | 107 |
0.008 (−0.007, 0.022) |
80 |
−0.033 (−0.080, 0.013) |
106 |
0.013 (−0.022, 0.048) |
107 |
0.009 (−0.008, 0.026) |
103 |
0.028 (−0.001, 0.058) |
107 |
0.002 (−0.001, 0.006) |
| Number of CMDs |
−0.001 (−0.004, 0.002) |
−0.011 (−0.023, 0.002) |
0.002 (−0.006, 0.010) |
−0.002 (−0.006, 0.002) |
0.006 (−0.001, 0.013) |
−0.001 (−0.0016, −0.0003_ |
||||||
| Older age (≥ 60) (n = 15,366) | ||||||||||||
| CMD free × time | 13,315 | Reference | 10,137 | Reference | 13,310 | Reference | 13,315 | Reference | 13,034 | Reference | 13,315 | Reference |
| CMDs × time | 2051 |
−0.009 (−0.013, −0.006) |
1510 |
−0.026 (−0.039, −0.014) |
2050 |
−0.007 (−0.017, 0.003) |
2051 |
−0.004 (−0.008, −0.0002) |
1992 |
−0.006 (−0.013, −0.001) |
2051 |
−0.001 (−0.0022, −0.0004) |
| 1 CMD × time | 1861 |
−0.009 (−0.013, −0.005) |
1379 |
−0.029 (−0.042, −0.016) |
1860 |
−0.008 (−0.018, 0.003) |
1861 |
−0.004 (−0.008, 0.001) |
1809 |
−0.006 (−0.013, 0.001) |
1861 |
−0.001 (−0.0021, −0.0002) |
| ≥ 2 CMDs × time | 190 |
−0.014 (−0.026, −0.001) |
131 |
0.004 (−0.035, 0.042) |
190 |
0.002 (−0.031, 0.035) |
190 |
−0.006 (−0.020, 0.007) |
183 |
−0.010 (−0.032, 0.013) |
190 |
−0.003 (−0.0062, −0.0004) |
| Number of CMDs |
−0.008 (−0.012, −0.005) |
−0.019 (−0.030, −0.008) |
−0.004 (−0.013, 0.005) |
−0.003 (−0.007, 0.001) |
−0.006 (−0.012, −0.001) |
−0.001 (−0.0021, −0.0005) |
||||||
Note: All models were adjusted for age, sex, education, SES, race, BMI, hypertension, smoking, alcohol consumption, physical activity level, and APOE ε4 carrier status. See Appendix A in supporting information for results from unadjusted models.
Bold text indicates statistical significance (P‐value <0.05).
Abbreviations: APOE, apolipoprotein E; BMI, body mass index; CMD, cardiometabolic disease; SES, socioeconomic status.
After age stratification, in the middle‐aged cohort, the presence of any CMD was associated with a small but statistically significant decline in processing speed, and the relationship was dose dependent such that processing speed declined faster among people with a greater number of co‐morbid CMDs (β = −0.001). In the older cohort, CMDs were also dose‐dependently related to significantly faster decline in processing speed (β = −0.001), as well as working memory (β = −0.019), verbal/numeric reasoning (β = −0.006), and global cognitive function (β = −0.008; Table 2, Figure 1).
FIGURE 1.
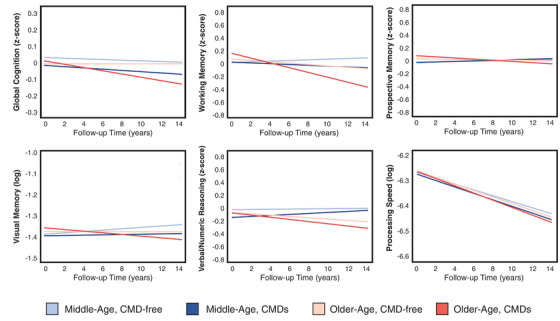
Changes in global and domain‐specific cognitive function in middle‐aged and older adults, by CMD status. Data were analyzed using mixed‐effects models adjusted for age, sex, education, SES, race, body mass index, hypertension, smoking, alcohol consumption, physical activity level, and APOE ε4 carrier status. APOE, apolipoprotein E; CMD, cardiometabolic disease; SES, socioeconomic status
We detected a significant interaction between CMD status and age cohort for global cognitive function (P = 0.004) and verbal/numeric reasoning (P = 0.015), such that these associations were stronger in the older cohort.
3.3. Association between CMDs and brain structural differences
The presence of CMDs was associated with significantly smaller TBV (β = −0.15), GMV (β = −0.17), WMV (β = −0.11), and HV (β = −0.14), and significantly larger WMHV (β = 0.05) at the end of follow‐up (Table 3). These associations were stronger for individuals with cardiometabolic multimorbidity as opposed to a single CMD. Furthermore, when CMD burden was considered a continuous variable, there was a significant dose–response relationship between number of CMDs and the magnitude of the volume difference for each brain MRI parameter.
TABLE 3.
β coefficients and 95% confidence interval (CI) for the association between CMD status and structural brain differences: Results from linear regression models.
| No. of participants | TBV | GMV | WMV | HV | WMHV | |
|---|---|---|---|---|---|---|
| CMDs | β (95% CI) | β (95% CI) | β (95% CI) | β (95% CI) | β (95% CI) | |
| Whole population (n = 39,306) | ||||||
| CMD free | 36,339 | Reference | Reference | Reference | Reference | Reference |
| CMDs | 2967 | −0.15 (−0.18, −0.12) | −0.17 (−0.20, −0.14) | −0.11 (−0.14, −0.08) | −0.14 (−0.18, −0.11) | 0.05 (0.02, 0.09) |
| 1 CMD | 2747 | −0.14 (−0.17, −0.11) | −0.16 (−0.19, −0.13) | −0.11 (−0.14, −0.08) | −0.14 (−0.18, −0.10) | 0.05 (0.02, 0.08) |
| ≥ 2 CMDs | 223 | −0.25 (−0.36, −0.15) | −0.34 (−0.45, −0.24) | −0.15 (−0.26, −0.04) | −0.22 (−0.34, −0.10) | 0.10 (−0.01, 0.22) |
| Number of CMDs | −0.14 (−0.16, −0.11) | −0.16 (−0.19, −0.14) | −0.10 (−0.13, −0.07) | −0.13 (−0.16, −0.10) | 0.05 (0.02, 0.08) | |
| Middle age (< 60) (n = 26,903) | ||||||
| CMD free | 25,524 | Reference | Reference | Reference | Reference | Reference |
| CMDs | 1379 | −0.17 (−0.21, −0.12) | −0.19 (−0.23, −0.14) | −0.13 (−0.18, −0.09) | −0.13 (−0.18, −0.08) | 0.07 (0.03, 0.12) |
| 1 CMD | 1294 | −0.16 (−0.21, −0.12) | −0.18 (−0.22, −0.13) | −0.13 (−0.18, −0.09) | −0.13 (−0.18, −0.08) | 0.06 (0.02, 0.11) |
| ≥ 2 CMDs | 85 | −0.22 (−0.40, −0.05) | −0.33 (−0.50, −0.16) | −0.11 (−0.28, 0.07) | −0.16 (−0.35, 0.04) | 0.18 (0.00, 0.35) |
| Number of CMDs | −0.15 (−0.19, −0.11) | −0.18 (−0.22, −0.13) | −0.12 (−0.16, −0.07) | −0.12 (−0.17, −0.07) | 0.07 (0.03, 0.11) | |
| Older age (≥ 60) (n = 12,403) | ||||||
| CMD free | 10,815 | Reference | Reference | Reference | Reference | Reference |
| CMDs | 1588 | −0.14 (−0.18, −0.09) | −0.16 (−0.20, −0.11) | −0.10 (−0.15, −0.06) | −0.12 (−0.17, −0.06) | 0.04 (−0.00, 0.09) |
| 1 CMD | 1453 | −0.12 (−0.17, −0.08) | −0.14 (−0.18, −0.10) | −0.10 (−0.14, −0.05) | −0.11 (−0.16, −0.05) | 0.04 (−0.01, 0.09) |
| ≥2 CMDs | 138 | −0.28 (−0.41, −0.15) | −0.34 (−0.48, −0.21) | −0.20 (−0.33, −0.06) | −0.21 (−0.37, −0.05) | 0.08 (−0.07, 0.23) |
| Number of CMDs | −0.13 (−0.17, −0.09) | −0.15 (−0.19, −0.11) | −0.10 (−0.13, −0.06) | −0.11 (−0.15, −0.06) | 0.04 (−0.00. 0.08) | |
Note: All models were adjusted for age, sex, education, SES, race, BMI, hypertension, smoking, alcohol consumption, physical activity level, APOE ε4 carrier status, head position, scanner table position, and assessment center. See Appendix A in supporting information for results from unadjusted models.
Bold text indicates statistical significance (P‐value <0.05).
Abbreviations: APOE, apolipoprotein E; BMI, body mass index; CMD, cardiometabolic disease; GMV, gray matter volume; HV, hippocampal volume; SES, socioeconomic status; TBV, total brain volume; WMV, white matter volume; WMHV, white matter hyperintensity volume.
After age stratification, the dose‐dependent associations between CMDs and smaller TBV, GMV, WMV, and HV remained significant in both the middle‐aged and older cohorts, but the association between CMDs and larger WMHV was present only in the middle‐aged cohort (Table 3, Figure 2). There was a significant interaction between CMD status and age cohort for TBV (P < 0.001), GMV (P < 0.001), WMV (P = 0.001), and HV (P < 0.001) such that the CMD status–brain volume associations were more pronounced in the older cohort. No interaction between CMD status and age cohort was detected for WMHV (P = 0.125).
FIGURE 2.
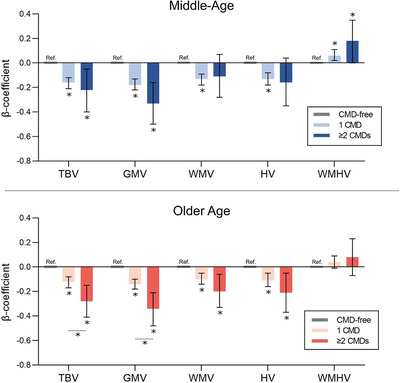
Structural brain differences in middle and older age among people with 1 and ≥ 2 CMDs. Data were analyzed using linear regression models adjusted for age, sex, education, SES, race, body mass index, hypertension, smoking, alcohol consumption, physical activity level, APOE ε4 carrier status, head position, scanner table position, and assessment center. APOE, apolipoprotein E; CMD, cardiometabolic disease; GMV, gray matter volume; HV, hippocampal volume; SES, socioeconomic status; TBV, total brain volume; WMV, white matter volume; WMHV, white matter hyperintensity volume
In an exploratory analysis, we further examined the association of different constellations of T2D, HD, and stroke with brain MRI measures. In both the middle‐aged and older cohorts, the strongest associations were between T2D, co‐morbid T2D/stroke, and co‐morbid T2D/HD and lower TBV, GMV, and HV (all P < 0.05; Figure 3, Table S5 in supporting information).
FIGURE 3.
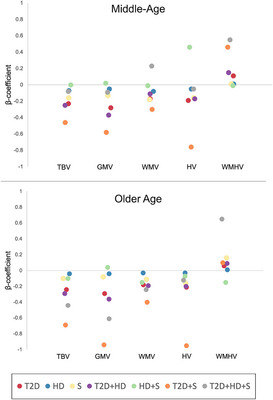
Association of individual CMD constellations with structural brain differences. Data were analyzed using linear regression models adjusted for age, sex, education, SES, race, body mass index, hypertension, smoking, alcohol consumption, physical activity level, APOE ε4 carrier status, head position, scanner table position, and assessment center. APOE, apolipoprotein E; CMD, cardiometabolic disease; GMV, gray matter volume; HD, heart disease; HV, hippocampal volume; S, stroke; SES, socioeconomic status; T2D, type 2 diabetes; TBV, total brain volume; WMV, white matter volume; WMHV, white matter hyperintensity volume
3.4. Sensitivity analyses
Similar results were obtained when we repeated the analyses using non‐imputed data for covariates (Tables S6‐S7 in supporting information). Results were also essentially unchanged after we excluded participants who were diagnosed with dementia over the follow‐up (Tables S8‐S9 in supporting information), although this was a relatively small number (n = 79) given that the study population was composed of participants who were healthy and engaged enough to undergo a follow‐up neuropsychological battery. Results from basic and partially adjusted models can be found in Appendix A (Tables S10–S20) in supporting information.
4. DISCUSSION
In this large‐scale community‐based follow‐up study, we found that the presence of a greater number of co‐morbid CMDs is associated with: (1) multi‐domain cognitive decline, including faster decline in processing speed in middle age and faster declines in global cognitive function, working memory, verbal/numeric reasoning, and processing speed in older age; and (2) smaller TBV, GMV, WMV, and HV and larger WMHV, even in middle age. Our findings highlight the connection between cardiometabolic multimorbidity and cognitive aging and suggest that the CMD–cognitive decline association may be related to both neurodegenerative and vascular pathologies, which could begin as early as middle age.
An extensive literature has described the detrimental influence of individual CMDs and various cardiovascular and metabolic risk factors on cognitive function and brain health, 28 , 29 including in mid‐life. 16 , 17 , 18 , 19 , 30 , 31 , 32 , 33 , 34 However, as the population ages, cardiometabolic multimorbidity is becoming increasingly prevalent, 5 and there is a need for more studies that consider the combined influence of multiple CMDs on these outcomes across the life course. 4 In the present investigation, we evaluated 9‐year trajectories in global and domain‐specific cognitive function in both middle‐aged (< 60) and older (≥ 60) adults, allowing us to explore the relationship between burden of co‐morbid CMDs and long‐term changes in cognition over different life stages. Interestingly, while differences in the rate of cognitive change were apparent primarily among the older cohort, brain structural differences were evident in both the middle‐aged and older cohorts alike. These results may suggest that cardiometabolic multimorbidity could have a detrimental influence on the brain as early as mid‐life, but it is not until later in life that such brain changes give way to decrements in cognitive performance. Of course, additional studies are warranted to validate this conceptual framework.
Consistent with our findings, cardiometabolic multimorbidity has been related to a faster rate of global cognitive decline in the Swedish National Study on Aging and Care, Kungsholmen 8 and a recent pooled analysis of four cohort studies covering the United States, China, and several European countries. 11 The latter study additionally reported an association between cardiometabolic multimorbidity and decline in performance on tests of memory, numeracy, and orientation. 11 Besides this, the association of cardiometabolic multimorbidity with domain‐specific cognitive decline has not been widely examined. Another study based on UK Biobank data reported associations between various combinations of CMDs (including T2D, hypertension, and coronary artery disease) and poor performance in cognitive tests for reasoning ability, information processing speed, and memory among people aged 40 to 70, 12 but the temporality of these associations is unclear given the cross‐sectional study design, and potential differences in the CMD–cognitive function associations among middle‐aged and older participants were not examined in detail. In the present study, a greater number of CMDs was related to a modest but statistically significant faster decline in processing speed in middle age, followed by even steeper declines in verbal/numeric reasoning working memory in older age. These findings suggest that the potential detrimental influence of cardiometabolic multimorbidity on cognitive function may begin with decrements in processing speed, later worsening to include additional and potentially more severe impairments in verbal/numeric reasoning and memory.
Different patterns of cognitive deficits may be indicative of different underlying brain pathological changes. Abilities like episodic memory rely on medial temporal brain regions and are typically the domains most impaired among people with Alzheimer's disease (AD). 35 In contrast, fluid abilities like processing speed, attention, and executive function rely on frontal lobe function and are especially vulnerable to vascular brain changes. 36 Decreased HV and GMV are typical markers of AD‐related neurodegeneration, 35 whereas the presence of WMH is indicative of microvascular lesions. 37
Echoing the wide‐ranging cognitive deficits associated with CMDs in the present investigation and others, previous studies have linked cardiometabolic multimorbidity 10 and unfavorable cardiovascular risk profiles 13 , 14 , 15 to several brain structural differences, including smaller volumes of subcortical structures and white matter damage in older age. More recently, evidence has emerged of a connection between cardiometabolic health and brain health in middle age. Previous neuroimaging studies have reported an association between cardiovascular and metabolic risk factors and poorer white matter integrity among middle‐aged adults in their 50s, 16 , 17 , 19 with one study even showing an association between vascular risk factors (including BMI, smoking, heavy alcohol use, high blood pressure, high cholesterol, and hyperglycemia) and poorer white matter integrity among people aged < 40. 18 In our study, the presence of a greater number of CMDs was associated with markers of not only vascular but also neurodegenerative brain damage—specifically, significantly smaller TBV, GMV, WMV, and HV in both the middle‐aged and older cohorts, and significantly larger WMHV in the middle‐aged cohort only. WMHV tends to increase with advanced age, so a potential explanation for this finding is that CMD‐related increases in WMHV are diluted in the older cohort.
Future studies are warranted to better understand the relationship between cardiometabolic multimorbidity and cognitive/brain aging across the life course. This will require longitudinal studies in which people are followed from middle to older age, undergoing multiple brain MRI scans and cognitive test batteries so that different patterns of cognitive deficits can be linked with different underlying brain pathological changes.
4.1. Strengths and limitations
A major strength of this study is the use of a large‐scale population‐based study with a comprehensive data collection procedure, including brain MRI scans and repeated measures of cognitive function. Additionally, the inclusion of middle‐aged as well as older participants in the study allowed us to examine the connections among CMDs, cognition, and brain health in different life stages.
However, our results should be interpreted in the context of some limitations. Most importantly, it should be acknowledged that the cognitive tests administered in the UK Biobank are brief and non‐standard in nature and have lower validity and reliability than a traditional neuropsychological examination. 23 Furthermore, not all participants had two repeated measures of all five cognitive tests, in part due to slight changes in the UK Biobank cognitive test battery protocol over time. Specifically, there were relatively more participants with only one measurement of verbal/numeric reasoning, prospective memory, and working memory because the verbal/numeric reasoning and prospective memory tests were added to the cognitive battery after the baseline assessment phase was already underway, and the working memory test was eventually removed from the battery during the follow‐up period due to time constraints. 22 Although mixed‐effects models can accommodate missing data, it is possible that the reported results are less reliable for those particular domains. Moreover, improvements in reliability have been shown when scores from UK Biobank cognitive tests are combined, 23 hence our focus on global as well as domain‐specific cognitive function in the present investigation. After subsequent waves of follow‐up are complete, future UK Biobank studies can examine trajectories of cognitive function even more comprehensively using more than two repeated measures of cognitive function.
Another limitation of our study is that brain MRI scans were conducted at only one time point, so we could not measure the association between CMDs and long‐term changes in brain structure or evaluate brain MRI changes as a mediator of the association between CMDs and cognitive decline. Collection of repeat brain MRI scans is currently ongoing among a subset of ≈ 10,000 UK Biobank participants, 38 enabling investigation of these issues in future studies. An additional limitation is that two CMDs, HD and stroke, were ascertained through medical records and therefore likely to be underdiagnosed in this study. Relatedly, the UK Biobank sample is highly selected and suffers from well‐documented healthy volunteer bias. 39 , 40 As a consequence, the prevalence of CMDs, especially in middle age, was rather low in our study population, which could limit the generalizability of our findings to other populations and may have contributed to an underestimation of the observed associations among CMDs, cognitive decline, and brain MRI measures. Selection bias may be stronger in our sample as it was restricted to UK Biobank participants who underwent the follow‐up examination. This is especially true of the neuroimaging subsample, given the demands of undergoing an MRI scan and contraindications like stents or pacemakers that exclude less healthy individuals. Caution is therefore required when generalizing our findings to other populations.
4.2. Conclusion
In this large community‐based study, a greater burden of CMDs was associated with an accelerated trajectory of global cognitive decline, including a significant decline in processing speed in middle age and a significant decline in working memory, verbal/numeric reasoning, and processing speed in older age. CMDs were further associated with brain structural differences indicative of both neurodegenerative and vascular brain lesions in both middle and older age. Together, these results highlight the potential detrimental influence of cardiometabolic multimorbidity on cognitive and brain health, which could begin as early as middle age.
AUTHOR CONTRIBUTIONS
Abigail Dove and Weili Xu contributed to the conception and design of the study. Abigail Dove conducted the statistical analyses, performed the literature search, and drafted the first version of the manuscript. Jiao Wang provided support with database management. Jie Guo, Jiao Wang, Davide Liborio Vetrano, Sakura Sakakibara, Erika J. Laukka, David A. Bennett, and Weili Xu interpreted the data and provided critical revisions to the manuscript. All authors made a significant contribution to finalize the manuscript and approved the final version for publication.
CONFLICT OF INTEREST STATEMENT
The authors have no conflicts of interest to disclose.
CONSENT STATEMENT
All participants in the UK Biobank provided informed consent at baseline and prior to the MRI scan, and the data collection procedures have been approved by the National Health Services (NHS) National Research Ethics Service Ref 11 /NW/0382. All data used in this study were obtained from the UK Biobank through application 67048 (PI: Weili Xu).
Supporting information
Supporting Information
Supporting Information
ACKNOWLEDGMENTS
The authors would like to express their gratitude to the UK Biobank study participants and the staff involved in the UK Biobank data collection and management. W.X. received grants from the Swedish Research Council (No. 2021‐01647), the Swedish Council for Health Working Life and Welfare (No. 2021‐01826), Alzheimerfonden, and the Karolinska Institutet Board of Research. A.D. received grants from Lindhés Advokatbyrå (No. LA2023‐0092), Demensfonden, and Alzheimerfonden. This study was accomplished within the context of the Swedish National Graduate School on Aging and Health (SWEAH).
Dove A, Guo J, Wang J, et al. Cardiometabolic disease, cognitive decline, and brain structure in middle and older age. Alzheimer's Dement. 2024;16:e12566. 10.1002/dad2.12566
REFERENCES
- 1. di Angelantonio E, Kaptoge S, Wormser D, et al. Association of cardiometabolic multimorbidity with mortality. JAMA. 2015;314:52‐60. doi: 10.1001/jama.2015.7008 [DOI] [PMC free article] [PubMed] [Google Scholar]
- 2. Kivimäki M, Kuosma E, Ferrie JE, et al. Overweight, obesity, and risk of cardiometabolic multimorbidity: pooled analysis of individual‐level data for 120 813 adults from 16 cohort studies from the USA and Europe. Lancet Public Health. 2017;2:e277‐285. doi: 10.1016/S2468-2667(17)30074-9 [DOI] [PMC free article] [PubMed] [Google Scholar]
- 3. Singh‐Manoux A, Fayosse A, Sabia S, et al. Clinical, socioeconomic, and behavioural factors at age 50 years and risk of cardiometabolic multimorbidity and mortality: a cohort study. PLoS Med. 2018;15:e1002571. doi: 10.1371/JOURNAL.PMED.1002571 [DOI] [PMC free article] [PubMed] [Google Scholar]
- 4. Livingston G, Huntley J, Sommerlad A, et al. Dementia prevention, intervention, and care: 2020 report of the Lancet commission. Lancet. 2020;396:413‐446. doi: 10.1016/S0140-6736(20)30367-6 [DOI] [PMC free article] [PubMed] [Google Scholar]
- 5. Sattar N, Gill JMR, Alazawi W. Improving prevention strategies for cardiometabolic disease. Nat Med. 2020;26:320‐325. doi: 10.1038/s41591-020-0786-7. 2020 26:3 [DOI] [PubMed] [Google Scholar]
- 6. Gerdts E, Regitz‐Zagrosek V. Sex differences in cardiometabolic disorders. Nat Med. 2019;25:1657‐1666. doi: 10.1038/s41591-019-0643-8 [DOI] [PubMed] [Google Scholar]
- 7. Wang Z, Marseglia A, Shang Y, Dintica C, Patrone C, Xu W. Leisure activity and social integration mitigate the risk of dementia related to cardiometabolic diseases: a population‐based longitudinal study. Alzheimers Dement. 2019. doi: 10.1016/j.jalz.2019.09.003 [DOI] [PubMed] [Google Scholar]
- 8. Dove A, Marseglia A, Shang Y, et al. Cardiometabolic multimorbidity accelerates cognitive decline and dementia progression. Alzheimer's Dement. 2022. doi: 10.1002/ALZ.12708 [DOI] [PubMed] [Google Scholar]
- 9. Dove A, Guo J, Marseglia A, et al. Cardiometabolic multimorbidity and incident dementia: the Swedish twin registry. Eur Heart J. 2022;00:1‐11. doi: 10.1093/EURHEARTJ/EHAC744 [DOI] [PMC free article] [PubMed] [Google Scholar]
- 10. Tai XY, Veldsman M, Lyall DM, et al. Cardiometabolic multimorbidity, genetic risk, and dementia: a prospective cohort study. Lancet Healthy Longev. 2022;3:e428‐436. doi: 10.1016/S2666-7568(22)00117-9/ATTACHMENT/E2953896-A321-4862-8B60-AB7FFBA0CF6E/MMC1.PDF [DOI] [PMC free article] [PubMed] [Google Scholar]
- 11. Jin Y, Liang J, Hong C, Liang R, Luo Y. Cardiometabolic multimorbidity, lifestyle behaviours, and cognitive function: a multicohort study. Lancet Healthy Longev. 2023;4:e265‐273. doi: 10.1016/S2666-7568(23)00054-5 [DOI] [PubMed] [Google Scholar]
- 12. Lyall DM, Celis‐Morales CA, Anderson J, et al. Associations between single and multiple cardiometabolic diseases and cognitive abilities in 474 129 UK Biobank participants. Eur Heart J. 2016;38:ehw528. doi: 10.1093/eurheartj/ehw528 [DOI] [PMC free article] [PubMed] [Google Scholar]
- 13. Cox SR, Lyall DM, Ritchie SJ, et al. Associations between vascular risk factors and brain MRI indices in UK biobank. Eur Heart J. 2019;40:2290‐2300. doi: 10.1093/EURHEARTJ/EHZ100 [DOI] [PMC free article] [PubMed] [Google Scholar]
- 14. Song R, Xu H, Dintica CS, et al, Associations Between Cardiovascular Risk, Structural Brain Changes, and Cognitive Decline. 2020; 22 :2525‐2534. doi: 10.1016/j.jacc.2020.03.053 [DOI] [PMC free article] [PubMed]
- 15. Wang R, Fratglioni L, Kalpouzos G, et al. Mixed brain lesions mediate the association between cardiovascular risk burden and cognitive decline in old age: a population‐based study. Alzheimer's Demen. 2017;13:247‐256. doi: 10.1016/J.JALZ.2016.06.2363 [DOI] [PubMed] [Google Scholar]
- 16. Aljondi R, Szoeke C, Steward C, Gorelik A, Desmond P. The effect of midlife cardiovascular risk factors on white matter hyperintensity volume and cognition two decades later in normal ageing women. Brain Imaging Behav. 2020;14:51‐61. doi: 10.1007/S11682-018-9970-5/FIGURES/1 [DOI] [PubMed] [Google Scholar]
- 17. Dintica CS, Hoang T, Allen N, Sidney S, Yaffe K. The metabolic syndrome is associated with lower cognitive performance and reduced white matter integrity in midlife: the CARDIA study. Front Neurosci. 2022;16:1105. doi: 10.3389/FNINS.2022.942743/BIBTEX [DOI] [PMC free article] [PubMed] [Google Scholar]
- 18. Williamson W, Lewandowski AJ, Forkert ND, et al. Association of cardiovascular risk factors with MRI indices of cerebrovascular structure and function and white matter hyperintensities in young adults. JAMA. 2018;320:665. doi: 10.1001/JAMA.2018.11498 [DOI] [PMC free article] [PubMed] [Google Scholar]
- 19. Jiang X, Lewis CE, Allen NB, Sidney S, Yaffe K. Premature cardiovascular disease and brain health in midlife: the CARDIA study. Neurology. 2023;100:E1454‐1463. doi: 10.1212/WNL.0000000000206825 [DOI] [PMC free article] [PubMed] [Google Scholar]
- 20. Sudlow C, Gallacher J, Allen N, et al. UK biobank: an open access resource for identifying the causes of a wide range of complex diseases of middle and old age. PLoS Med. 2015;12:e1001779. doi: 10.1371/JOURNAL.PMED.1001779 [DOI] [PMC free article] [PubMed] [Google Scholar]
- 21. Han Y, Hu Y, Yu C, et al. Lifestyle, cardiometabolic disease, and multimorbidity in a prospective chinese study. Eur Heart J. 2021;42:3374‐3384. doi: 10.1093/EURHEARTJ/EHAB413 [DOI] [PMC free article] [PubMed] [Google Scholar]
- 22. Lyall DM, Cullen B, Allerhand M, et al. Cognitive test scores in UK biobank: data reduction in 480,416 participants and longitudinal stability in 20,346 participants. PLoS One. 2016;11:e0154222. doi: 10.1371/JOURNAL.PONE.0154222 [DOI] [PMC free article] [PubMed] [Google Scholar]
- 23. Fawns‐Ritchie C, Deary IJ. Reliability and validity of the UK biobank cognitive tests. PLoS One. 2020;15:e0231627. doi: 10.1371/JOURNAL.PONE.0231627 [DOI] [PMC free article] [PubMed] [Google Scholar]
- 24. Miller KL, Alfaro‐Almagro F, Bangerter NK, et al. Multimodal population brain imaging in the UK biobank prospective epidemiological study. Nat Neurosci. 2016;19:1523‐1536. doi: 10.1038/nn.4393 [DOI] [PMC free article] [PubMed] [Google Scholar]
- 25. Alfaro‐Almagro F, Jenkinson M, Bangerter NK, et al. Image processing and quality control for the first 10,000 brain imaging datasets from UK biobank. Neuroimage. 2018;166:400‐424. doi: 10.1016/J.NEUROIMAGE.2017.10.034 [DOI] [PMC free article] [PubMed] [Google Scholar]
- 26. Townsend P. Deprivation. J Soc Policy. 1987;16:125‐146. doi: 10.1017/S0047279400020341 [DOI] [Google Scholar]
- 27. Atti AR, Palmer K, Volpato S, Winblad B, De Ronchi D, Fratiglioni L. Late‐life body mass index and dementia incidence: nine‐year follow‐up data from the Kungsholmen project. J Am Geriatr Soc. 2008;56:111‐116. doi: 10.1111/J.1532-5415.2007.01458.X [DOI] [PubMed] [Google Scholar]
- 28. Qiu C, Fratiglioni L. A major role for cardiovascular burden in age‐related cognitive decline. Nat Rev Cardiol. 2015;12:267‐277. doi: 10.1038/nrcardio.2014.223 [DOI] [PubMed] [Google Scholar]
- 29. Biessels GJ, Despa F. Cognitive decline and dementia in diabetes mellitus: mechanisms and clinical implications. Nat Rev Endocrinol. 2018;14:591‐604. doi: 10.1038/s41574-018-0048-7 [DOI] [PMC free article] [PubMed] [Google Scholar]
- 30. De Anda‐Duran I, Alonso CF, Libon DJ, et al. Carotid intima‐media thickness and midlife cognitive function: impact of race and social disparities in the Bogalusa heart study. Neurology. 2022;98:E1828‐1836. doi: 10.1212/WNL.0000000000200155 [DOI] [PMC free article] [PubMed] [Google Scholar]
- 31. Yaffe K, Bahorik AL, Hoang TD, et al. Cardiovascular risk factors and accelerated cognitive decline in midlife: the CARDIA study. Neurology. 2020;95:E839‐846. doi: 10.1212/WNL.0000000000010078 [DOI] [PMC free article] [PubMed] [Google Scholar]
- 32. Razavi AC, Fernandez C, He J, et al. Left ventricular mass index is associated with cognitive function in middle‐age: Bogalusa heart study. Circ Cardiovasc Imaging. 2020;13:E010335. doi: 10.1161/CIRCIMAGING.119.010335 [DOI] [PMC free article] [PubMed] [Google Scholar]
- 33. Derby CA, Hutchins F, Greendale GA, et al. Cardiovascular risk and midlife cognitive decline in the study of women's health across the nation. Alzheimer Dement. 2021;17:1342‐1352. doi: 10.1002/alz.12300 [DOI] [PMC free article] [PubMed] [Google Scholar]
- 34. Huo N, Vemuri P, Graff‐Radford J, et al. Sex differences in the association between midlife cardiovascular conditions or risk factors with midlife cognitive decline. Neurology. 2022;98:E623‐632. doi: 10.1212/WNL.0000000000013174 [DOI] [PMC free article] [PubMed] [Google Scholar]
- 35. Dubois B, Feldman HH, Jacova C, et al. Revising the definition of Alzheimer's disease: a new lexicon. Lancet Neurol. 2010;9:1118‐1127. doi: 10.1016/S1474-4422(10)70223-4 [DOI] [PubMed] [Google Scholar]
- 36. Iadecola C, Duering M, Hachinski V, et al. Vascular cognitive impairment and dementia: JACC scientific expert panel. J Am Coll Cardiol. 2019;73:3326‐3344. doi: 10.1016/J.JACC.2019.04.034 [DOI] [PMC free article] [PubMed] [Google Scholar]
- 37. Wardlaw JM, Smith EE, Biessels GJ, et al. Neuroimaging standards for research into small vessel disease and its contribution to ageing and neurodegeneration. Lancet Neurol. 2013;12:822‐838. doi: 10.1016/S1474-4422(13)70124-8 [DOI] [PMC free article] [PubMed] [Google Scholar]
- 38. Littlejohns TJ, Holliday J, Gibson LM, et al. The UK biobank imaging enhancement of 100,000 participants: rationale, data collection, management and future directions. Nat Commun. 2020;11:1‐12. doi: 10.1038/s41467-020-15948-9. 2020 11:1 [DOI] [PMC free article] [PubMed] [Google Scholar]
- 39. Batty GD, Gale CR, Kivimäki M, Deary IJ, Bell S. Comparison of risk factor associations in UK biobank against representative, general population based studies with conventional response rates: prospective cohort study and individual participant meta‐analysis. BMJ. 2020;368:m131. doi: 10.1136/BMJ.M131 [DOI] [PMC free article] [PubMed] [Google Scholar]
- 40. Fry A, Littlejohns TJ, Sudlow C, et al. Study design comparison of sociodemographic and health‐related characteristics of UK biobank participants with those of the general population. Am J Epidemiol. 2017;186:1026‐1034. doi: 10.1093/aje/kwx246 [DOI] [PMC free article] [PubMed] [Google Scholar]
Associated Data
This section collects any data citations, data availability statements, or supplementary materials included in this article.
Supplementary Materials
Supporting Information
Supporting Information