

Abstract
Mibavademab (previously known as REGN4461), a fully human monoclonal antibody, is being investigated for the treatment of conditions associated with leptin deficiency. Here, we report pharmacokinetics (PKs), pharmacodynamics, and immunogenicity from a phase I study in healthy participants (NCT03530514). In part A, lean or overweight healthy participants were randomized to single‐ascending‐dose cohorts of 0.3, 1.0, 3.0, 10, and 30 mg/kg intravenous (i.v.), or 300 and 600 mg subcutaneous doses of mibavademab or placebo. In part B, overweight or obese participants were randomized to receive multiple doses of mibavademab (15 mg/kg i.v. loading dose and 10 mg/kg i.v. at weeks 3, 6, and 9) or placebo, stratified by body mass index and baseline leptin levels: low leptin (<5 ng/mL) or relatively low leptin (5–8 ng/mL in men and 5–24 ng/mL in women). Fifty‐six and 55 participants completed the single‐ascending‐dose and multiple‐dose parts, respectively. In the single‐ascending‐dose cohorts, mibavademab PKs were nonlinear with target‐mediated elimination, greater than dose‐proportional increases in exposure, and there were no dose‐dependent differences in total soluble leptin receptor (sLEPR) levels in serum over time. Following multiple‐dose administration of mibavademab in participants with leptin <8 ng/mL, lower mean mibavademab concentrations, higher mean total sLEPR concentrations, and larger mean decreases in body weight than in the relatively low leptin cohorts were observed. Baseline leptin was correlated with mibavademab PKs and pharmacodynamics. No treatment‐emergent anti‐mibavademab antibodies were observed in any mibavademab‐treated participant. Results from this study collectively inform further development of mibavademab to treat conditions associated with leptin deficiency.
Study Highlights.
WHAT IS THE CURRENT KNOWLEDGE ON THE TOPIC?
Previous studies have demonstrated that mibavademab treatment effectively reduces body weight, improves glycemic control and insulin resistance, and resolves metabolic dysfunction and liver steatosis in obese mice with leptin deficiency and in a murine model of lipodystrophy. Mibavademab is currently being investigated in generalized lipodystrophy (NCT04159415) and partial lipodystrophy (NCT05088460).
WHAT QUESTION DID THIS STUDY ADDRESS?
This first‐in‐human phase I trial (NCT03530514) aimed to investigate the pharmacokinetics (PKs) of mibavademab, and to characterize the relationships between its PKs and baseline leptin levels, soluble leptin receptor concentrations in serum over time, and pharmacodynamics in healthy volunteers.
WHAT DOES THIS STUDY ADD TO OUR KNOWLEDGE?
The findings of this study indicate that mibavademab is well tolerated by healthy volunteers, regardless of their weight status (lean, overweight, or obese); immunogenicity was observed. Furthermore, the study demonstrated that mibavademab effectively reduces body weight, particularly when the baseline leptin levels are adequately low.
HOW MIGHT THIS CHANGE CLINICAL PHARMACOLOGY OR TRANSLATIONAL SCIENCE?
The results of this study provide support for the proof of concept of utilizing mibavademab treatment to reduce baseline body weight in overweight and obese adults with low levels of circulating leptin. These findings support the development of mibavademab as a therapeutic option for conditions associated with leptin deficiency. Comparing these findings with corresponding data in patients with leptin deficiency will add to the clinical pharmacology and translational science in understanding how leptin modulate PKs and pharmacodynamics of mibavademab.
INTRODUCTION
Leptin is a circulating adipose‐derived hormone that binds and activates the membrane leptin receptor (LEPR) in the hypothalamus to modulate the control of food intake, energy expenditure, and glucose/lipid metabolism. 1 Numerous studies have demonstrated correlations among circulating leptin levels, body mass index (BMI), 2 , 3 , 4 and body fat percentage. 5 Leptin levels also decrease during weight loss 5 , 6 , 7 and increase during weight gain, 8 coinciding with changes in fat mass. Obesity is generally recognized as a leptin‐saturated state. 9 There is limited information, however, on whether increased LEPR signaling will reduce appetite, food intake, and body weight in obese people with relatively low leptin levels.
Mibavademab is a fully human monoclonal antibody that binds to the membrane LEPR with nanomolar affinity, and activates the receptor, without competing with the endogenous ligand, leptin. LEPR exists as several isoforms and is highly expressed as the active form in the nucleus arcuatus of the hypothalamus, and as the inactive form in a broad range of peripheral tissues. 9 , 10 In humans, membrane‐bound LEPR undergoes ectodomain shedding, which is detectable in the circulation as soluble LEPR (sLEPR). 10 Mibavademab binds to sLEPR, albeit with lower affinity than to the active membrane‐bound LEPR. 11 In nonclinical studies, mibavademab treatment led to a significant reduction in body weight, reversed hyperphagia, and improved glycemic control and insulin resistance in obese mice with leptin deficiency (ob/ob). Mibavademab also resolved metabolic dysfunction and liver steatosis in a murine model of lipodystrophy. 11
In this two‐part, first‐in‐human, phase I study (NCT03530514), single ascending doses (part A) and multiple doses (part B) of mibavademab were administered to healthy lean or overweight participants, and to healthy overweight or obese participants (stratified by BMI and baseline leptin levels), respectively. Multiple‐dose mibavademab treatment led to reduced body weight over 12 weeks in overweight or obese participants with low baseline leptin levels (<8 ng/mL), but did not consistently affect body weight in those with higher baseline leptin levels (>10 ng/mL). Mibavademab was generally well tolerated during administration of the repeat‐dose regimen that induced weight‐loss effects. 11 Here, we report mibavademab pharmacokinetics (PKs) and characterization of the relationships between PKs and baseline leptin, sLEPR concentrations in serum over time, and pharmacodynamics from the first‐in‐human study. In addition, immunogenicity of mibavademab was also assessed.
METHODS
Study objectives and end points
This trial was a two‐part, phase I, randomized, double‐blind, placebo‐controlled study in healthy participants, conducted at SGS Clinical Pharmacology Unit (Antwerp, Belgium) between April 2018 and January 2020, in accordance with the ethical principles of the Declaration of Helsinki, and consistent with the International Conference on Harmonization Good Clinical Practice Guidelines. Approval was obtained from the site's independent ethics committee (Commissie voor Medische Ethiek–ZNA Middelheim, Lindendreef 1, 2020 Antwerpen, Belgium). Informed written consent was obtained from all volunteers before participation in the trial.
The primary objective of the study was to evaluate the safety and tolerability of mibavademab in healthy volunteers. Secondary objectives included characterizing the PK profile of single and repeated doses of mibavademab (including the effect of baseline covariates such as age, body weight, and sex); estimating the effects of repeated doses of mibavademab on body weight and ad lib energy intake over 12 weeks in overweight and obese participant cohorts defined by baseline levels of leptin and BMI; evaluating the effects of single and repeated doses of mibavademab on concentrations of sLEPR in serum over time; and assessing the immunogenicity of mibavademab. Safety, tolerability, effects on body weight, and effects on ad lib energy intake are summarized elsewhere 11 and also provided in Table S1.
Single ascending dose
The single‐ascending‐dose part of the study (part A) enrolled healthy men and women 18–50 years of age with baseline BMI 18.5–<30.0 kg/m2 (i.e., lean to overweight). Participants were randomized to seven cohorts, and the eight participants in each cohort were randomized 6:2 to mibavademab:placebo; mibavademab was administered intravenously (i.v.) at 0.3, 1, 3, 10, or 30 mg/kg or subcutaneously (s.c.) at 300 or 600 mg.
The starting dose of 0.3 mg/kg i.v. and subsequent escalations up to 30 mg/kg i.v. were supported by nonclinical characterization of efficacy, safety, and PKs in mouse models of lipodystrophy and monogenic obesity, 11 and by repeat‐dose toxicology and toxicokinetic studies in cynomolgus monkeys. Based on allometric projections of nonclinical data, the starting dose of 0.3 mg/kg i.v. was expected to produce concentrations of mibavademab in serum above the assay lower limit of quantitation (LLOQ), and the planned maximum dose of 30 mg/kg was expected to result in serum exposure 20‐fold lower than that in monkeys at the no‐observable‐adverse‐effect (NOAEL) dose (100 mg/kg/week administered i.v. for 13 consecutive weeks, the highest dose tested). Half‐logarithmic dose‐escalation intervals were chosen between successive nominal i.v. dose levels to ensure adequate separation of the PK profiles. Single s.c. doses of 300 and 600 mg were predicted to provide approximately the same exposure as the 1 and 3 mg/kg i.v. doses, respectively, and were included to estimate bioavailability and assess local tolerability of s.c. administered mibavademab.
Multiple doses in overweight/obese participants stratified by baseline leptin levels and BMI
Repeated doses of mibavademab were assessed in healthy overweight or obese (BMI 28–40 kg/m2) adults aged 18–65 years. Cohort design and recruitment were informed by a prescreening analysis of a volunteer database (396 men and 331 women) that was maintained by the clinical site. Based on the prescreening analysis, and in consideration of leptin stratification in published studies, 3 , 12 four cohorts were defined by baseline BMI, fasting leptin concentrations in serum, and sex categories, as summarized in Table 1. Participants were randomized 6:1 (cohort 1) or 3:1 (cohorts 2–4) to receive either mibavademab or placebo.
TABLE 1.
Key demographic attributes of the single ascending and multiple dose cohorts.
| Cohort/description | n | Sex (M/F), n | Baseline leptin (ng/mL), median (range) | BMI (kg/m2), median (range) | Body weight, (kg) median (range) | BSA (m2) median (range) | Race, White, n (%) |
|---|---|---|---|---|---|---|---|
| Single ascending dose | |||||||
| 0.3 mg/kg i.v. | 6 | 1/5 | 12.7 (0.78–24.8) | 23.95 (21.7–29.5) | 73.55 (58.7–86.8) | 1.88 (1.65–2.01) | 6 (100) |
| 1 mg/kg i.v. | 6 | 1/5 | 9.09 (3.3–20.4) | 22.95 (20.2–25.2) | 62.40 (50.8–76.1) | 1.69 (1.51–1.91) | 6 (100) |
| 3 mg/kg i.v. | 6 | 2/4 | 12.5 (5.37–22.8) | 24.45 (19.1–28.9) | 67.90 (52.2–93.2) | 1.79 (1.57–2.13) | 6 (100) |
| 10 mg/kg i.v. | 6 | 2/4 | 9.32 (3.22–20.8) | 23.20 (20.8–25.6) | 65.85 (52.8–84.0) | 1.78 (1.5–2.12) | 6 (100) |
| 30 mg/kg i.v. | 6 | 2/4 | 13.3 (3.12–30.2) | 25.25 (18.8–27.6) | 67.10 (50.2–83.7) | 1.71 (1.54–2.08) | 6 (100) |
| 300 mg s.c. | 6 | 2/4 | 9.26 (2.19–24.8) | 22.70 (20.5–25.5) | 66.65 (55.3–78.1) | 1.75 (1.6–2.02) | 6 (100) |
| 600 mg s.c. | 6 | 0/6 | 16.2 (5.25–25.1) | 23.55 (22.2–30.0) | 68.05 (62.3–77.6) | 1.79 (1.69–1.9) | 6 (100) |
| Multiple dose | |||||||
| 1/Low leptin, overweight/obese a | 7 | 7/0 | 3.96 (1.92–4.77) | 28.5 (28.0–29.9) | 90.60 (82.5–110.1) | 2.07 (1.95–2.45) | 7 (100) |
| 2/Low leptin, overweight a | 15 | 15/0 | 3.26 (0.8–4.9) | 26.15 (24.2–27.9) | 77.90 (68.9–86.6) | 1.92 (1.76–2.08) | 14 (93.3) |
| 3/Relatively low leptin, overweight/obese b | 15 | 15/0 | 6.63 (5.4–7.7) | 29.0 (27.8–31.4) | 93.0 (73.1–110.8) | 2.14 (1.76–2.36) | 15 (100) |
| 4/Relatively low leptin, overweight/obese b | 6 | 0/6 | 19.76 (11.8–22.8) | 30.15 (28.2–31.9) | 78.85 (73.8–91.4) | 1.83 (1.77–2.03) | 6 (100) |
Abbreviations: BMI, body mass index; BSA, body surface area, F, female; i.v., intravenous; M, male; s.c., subcutaneous; SD, standard deviation.
Enrollment in cohorts 1 and 2 was open to men and women with leptin <5 ng/mL, but availability of eligible participants was limited to men.
Cohorts 3 and 4 targeted participants with relatively low leptin, defined as leptin within the first quartile for the sex and BMI bracket: 5.0–8.0 ng/mL in men with BMI 28.0–40.0 kg/m2, and 5.0–24.0 ng/mL in women with BMI 28.0–40.0 kg/m2.
The multiple‐dose regimen was an i.v. loading dose of 15 mg/kg or placebo on day 1, followed by i.v. doses of 10 mg/kg or placebo on days 29, 50, and 71. This regimen was selected using a preliminary population PK model, which was developed from the single‐ascending‐dose PK data (part A). Simulations performed with the model predicted that the multiple‐dose regimen would produce rapid achievement and maintenance of concentrations of total mibavademab in serum at or above levels believed to be associated with near‐complete saturation of LEPR‐mediated clearance pathways (target‐mediated clearance) for up to 12 weeks in overweight or obese participants. The simulations further predicted that the maximum concentration (C max) of mibavademab in serum, and area under the curve (AUC) in overweight or obese participants on the multiple‐dose regimen, would be lower than the C max and AUC measured in monkeys at the NOAEL dose.
Pharmacokinetic and sLEPR assessments
In the single‐ascending‐dose phase of the study (part A), serum samples for the assessment of total mibavademab and sLEPR concentrations were obtained on day 1 (baseline) predose and at the following times after the end of the i.v. infusion or s.c. injection: end of infusion (i.v. administration), 1, 2, 4, 8, 12, and 24 h; and on days 3, 7, 14, 21, 28, 42, 56, 84, and 112 (end of study) days postdose, or at early termination. For the repeated dose phase (part B), serum samples were obtained on day 1 (baseline) predose and at the following times after the end of the i.v. infusion: end of infusion, 1, 2, 4, 8, 12, and 24 h; and on days 8, 15, 22, 29, 30, 36, 43, 50, 57, 64, 71, 78, 84, 107, 135, 163, and 191 (end of study) or at early termination.
Serum samples were analyzed for concentrations of total mibavademab (unbound and bound to sLEPR) with a validated enzyme‐linked immunosorbent assay (ELISA) that has an LLOQ of 0.078 mg/L in undiluted human serum. Serum samples for the measurement of total sLEPR (unbound and bound to mibavademab) were analyzed using a qualified ELISA that has an LLOQ of 0.0078 mg/L in undiluted human serum. The sLEPR levels in human serum were assessed to investigate any potential changes with mibavademab treatment or involvement in target‐mediated clearance.
The single‐dose PK parameters for mibavademab were derived with noncompartmental methods using Phoenix WinNonlin (version 8.1; Certara, L.P.) software. The multiple‐dose PK parameters assessed included observed C max value for each participant, corresponding to the highest concentration observed at any time during the multiple‐dose regimen. As predose samples were not collected before administration of the repeat doses on days 29, 50, or 71, the reported trough concentration (C trough) value for each participant corresponded to the sample collected on approximately day 63 (~1 week before administration of the day 71 dose of 10 mg/kg i.v. mibavademab).
Immunogenicity assessments
In part A, serum samples for the immunogenicity assessment were collected on day 1 (baseline) predose and at week 16. In part B, serum samples for immunogenicity assessment were collected on day 1 (baseline) predose and at weeks 12 and 27.
Immunogenicity assessments of mibavademab were done by monitoring for the development of anti‐drug antibodies (ADAs) in serum samples collected during the study, and were performed using a multi‐tiered approach that included screening, confirmation, and titer assays for ADAs, as specified in guidance documents and white papers. 13
Participants were classified as ADA‐negative if all samples had a negative response in the ADA assay. Pre‐existing immunoreactivity, if any, was defined as an ADA‐positive response in the baseline sample of a patient, with all post‐baseline ADA titers being less than nine‐fold the baseline titer value. Participants were categorized as having a treatment‐boosted ADA response if their baseline sample was ADA‐positive and at least one post‐baseline ADA titer result was greater than or equal to nine‐fold over the baseline titer value. Participants were reported to have a treatment‐emergent ADA response if their baseline sample was ADA‐negative or missing, and at least one post‐baseline sample showed a positive response in the ADA assay.
Body weight assessments
Methods used to assess change in body weight at week 12 relative to baseline are reported elsewhere. 11
Statistical analyses
Drug concentration, target concentration, and PK parameters used three significant figures for summary statistics; percentages used one or two decimal places. Slight differences were therefore seen between subgroups and overall percentages. Datasets, tables, figures, and listings were generated using SAS version 9.4. Descriptive statistics were used to present the total mibavademab, total sLEPR, and total ANGPTL3 concentrations. Clinical study time were presented as visits, weeks, or days; clinical study days (visit days), nominal sampling days, and actual days were summarized using the following equation:
The total mibavademab, total sLEPR, and total ANGPTL3 concentrations were summarized by nominal sampling time and treatment group. In these summary statistics, concentrations below the LLOQ were set to zero. When providing the geometric mean, a value of LLOQ/2 was imputed for concentrations below the LLOQ. Mean concentration plots (linear and log scales) are presented by nominal sampling time, and individual concentrations plots (linear and log scales) are presented by actual sampling time. In the linear‐scaled plots, concentrations below the LLOQ were set to zero; in the log‐scaled plots, concentrations below the LLOQ are imputed as LLOQ/2. PK parameters were summarized descriptively by dose group and cohort.
The effect of baseline leptin on mibavademab concentrations were explored graphically by assessing C trough concentrations versus baseline leptin values for each participant in part B. In addition, the exposure–response relationship for mibavademab concentrations to weight loss were explored graphically by plotting change from baseline for weight loss versus mibavademab concentrations. ADAs were summarized as absolute occurrence (n) and percent of patients by clinical study time and treatment group.
RESULTS
Baseline demographics
Detailed information on baseline demographics of participants in parts A and B of the first‐in‐human study with mibavademab have been reported previously, 11 and are also in Tables S2 and S3. A total of 56 participants were randomized to single doses of mibavademab (n = 42) or placebo (n = 14); all randomized participants completed part A. The mean weight, height, BMI, and other attributes were generally similar across cohorts/treatment groups; baseline leptin levels were higher in women than in men as is consistent with prior studies. 3
A total of 57 participants were randomized to multiple‐dose treatment (mibavademab, n = 43; placebo, n = 12), of whom 43 (97.7%) completed the study. Key demographics of participants are summarized in Table 1. Enrollment in cohorts 1 and 2 was open to men and women, but no women met the inclusion/exclusion criteria for these two cohorts; hence only men were ultimately enrolled. As a result, most of the participants in part B were men (37/43, 86%). 11 Whereas baseline leptin concentrations in men ranged from 0.8 to 7.7 ng/mL, corresponding leptin concentrations in women ranged from 11.8 to 22.8 ng/mL.
Pharmacokinetics of single‐ascending doses of mibavademab
The concentration–time profiles following single doses of mibavademab generally demonstrated a brief distribution phase followed by a linear elimination phase (when concentrations were sufficient to saturate the target‐mediated pathway), or a terminal nonlinear target‐mediated elimination phase when concentrations were insufficient to saturate the target mediated pathway (Figure 1a,b). A linear elimination phase was observed briefly at the 10 mg/kg dose level and was seen clearly at the 30 mg/kg i.v. dose level. Although both the linear and nonlinear elimination pathways occurred in parallel at all concentrations, the target‐independent elimination pathway (linear clearance phase) appeared to dominate at the higher antibody concentrations achieved with the higher doses. Additionally, there was evidence of a post target‐mediated phase at concentrations below ~1 mg/L; this phase was mostly observed following the 30 mg/kg dose. In the s.c. dose groups, C max was achieved ~3–7 days after the single dose.
FIGURE 1.
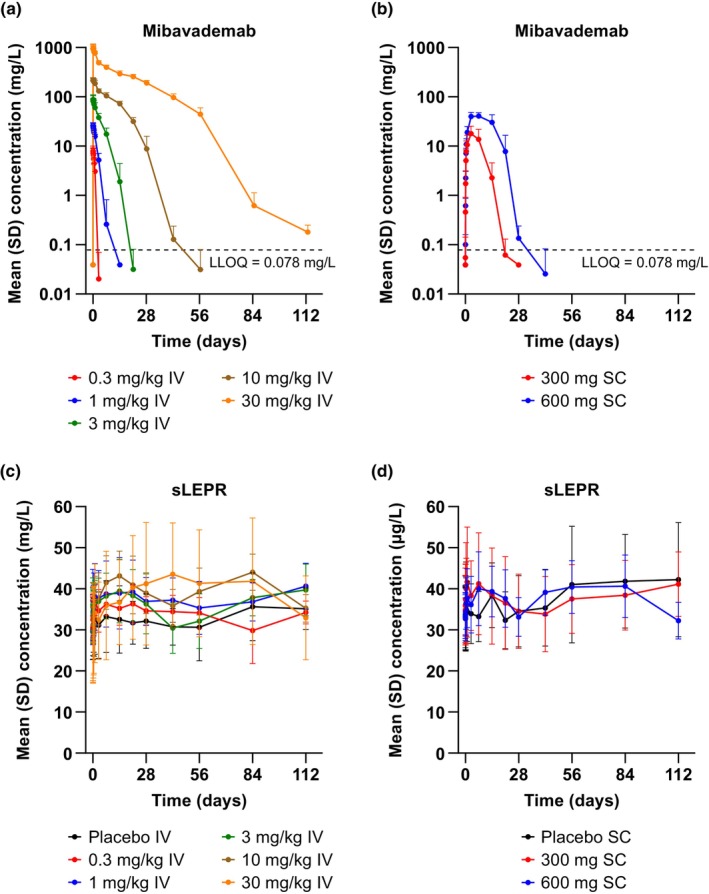
Mean (SD) concentrations of (a, b) total mibavademab and (c, d) sLEPR in serum by nominal time after single‐dose administration of mibavademab. Results are shown for n = 6 participants per group except for placebo i.v. (n = 10) and placebo s.c. (n = 4). Concentrations below the LLOQ were set to LLOQ/2. The placebo group is omitted from panels (a) and (b). i.v., intravenous; LLOQ, lower limit of quantitation; s.c., subcutaneous; SD, standard deviation; sLEPR, total soluble leptin receptor.
Consistent with the target‐mediated clearance, mean dose‐normalized AUC from time 0 to the last measurable concentration (AUClast/dose) indicated greater‐than‐dose‐proportional increases in exposure with dose (Table 2, Figure S1A). Similarly, mean clearance declined from 22.6 mL/day/kg for the 1 mg/kg i.v. dose to 2.42 mL/day/kg for the 30 mg/kg i.v. dose, reflecting the dominant effects of slower, target‐independent elimination at higher doses (Table 2). There were no obvious dose‐dependent differences in mean concentrations of sLEPR (Figure 1c,d).
TABLE 2.
Pharmacokinetic parameters of total mibavademab with single‐dose administration in lean or overweight healthy participants (part A).
| Parameters (units) | Total mibavademab in serum, mean (SD) | ||||||
|---|---|---|---|---|---|---|---|
| i.v. 0.3 mg/kg (n = 6) | i.v. 1 mg/kg (n = 6) | i.v. 3 mg/kg (n = 6) | i.v. 10 mg/kg (n = 6) | i.v. 30 mg/kg (n = 6) | s.c. 300 mg (n = 6) | s.c. 600 mg (n = 6) | |
| AUClast (day*mg/L) | 5.46 (2.46) | 39.8 (8.18) | 306 (85.0) | 1927 (222) | 12,461 (1009) | 137 (74.9) | 570 (209) |
| AUClast/dose (day*mg/L/mg) | 0.25 (0.08) | 0.65 (0.15) | 1.48 (0.32) | 2.86 (0.597) | 6.35 (1.26) | 0.46 (0.25) | 0.95 (0.35) |
| AUCinf (day*mg/L) | – | 47.0 (15.5) a | 306 (84.8) | 1936 (215) | 12,463 (1010) | 195 (15.8) b | 609 (243) c |
| C max (mg/L) | 7.94 (2.12) | 26.4 (3.30) | 91.6 (20.3) | 226 (25.6) | 1036 (139) | 18.3 (7.61) | 43.1 (7.46) |
| C max/dose (mg/L/mg) | 0.37 (0.10) | 0.43 (0.04) | 0.44 (0.05) | 0.33 (0.07) | 0.53 (0.11) | 0.06 (0.03) | 0.07 (0.01) |
| T max (day) d | 0.042 (0.042–0.125) | 0.063 (0.042–0.083) | 0.063 (0.042–0.542) | 0.125 (0.042–1.04) | 0.104 (0.042–0.208) | 2.98 (2.97–2.99) | 6.96 (3.01–6.98) |
| CL (mL/day/kg) | – | 22.6 (7.41) a | 10.3 (2.38) | 5.23 (0.552) | 2.42 (1.91) | – | – |
| C last (mg/L) e | 0 (0) | 0 (0) | 0 (0) | 0 (0) f | 0.618 (0.509) | 0 (0) | 0 (0) |
Note: AUCinf and CL were not estimable in the 0.3 mg/kg i.v. cohort. CL was not estimable in the s.c. cohorts due to uncertainty in the fraction of the dose absorbed into the systemic circulation.
Abbreviations: AUCinf, area under the concentration‐time curve from time 0 extrapolated to infinity; AUClast, AUC computed from time 0 to the time of the last positive concentration; C max, maximum concentration; C last, concentration at the last data point; CL, clearance; i.v., intravenous; s.c., subcutaneous; SD, standard deviation; T max, time to maximum plasma concentration.
Number of participants was 2.
Number of participants was 3.
Number of participants was 4.
For T max, median and minimum to maximum range of observed values are reported.
Day 84 value.
Number of participants was 5.
Assessments of potential relationships between participant characteristics at baseline and AUClast/dose (Figure S1B) demonstrated lower mibavademab exposure with increasing body weight, most notably following the highest dose of 30 mg/kg i.v. or 300 or 600 mg s.c. doses. There were no effects of sex or age on AUClast/dose (Figure S1C,D).
Pharmacokinetics of multiple‐dose mibavademab in overweight or obese participants
The concentration–time profiles demonstrated lower mibavademab exposure for the low‐leptin (<5 ng/mL) male cohorts 1 and 2 than the higher‐leptin male cohort 3 (leptin 5–8.0 ng/mL) and female cohort 4 (5.0–24.0 ng/mL; Figure 2a). C max occurred shortly after administration of the 15 mg/kg i.v. loading dose. The mean concentration of total sLEPR increased with repeated administration of mibavademab, with small differences observed between low and high leptin individuals and large interindividual variability (Figure 2b). As shown in Table 3, the lowest mean C max values were observed in the low‐leptin cohorts 1 and 2 (72.0 and 61.4 mg/L, respectively), with the higher‐leptin cohorts 3 and 4 demonstrating an ~1.4‐fold higher (91.0 mg/L) and 1.8‐fold higher (121 mg/L) mean C max, respectively. Of note, mean body weight, generally an important covariate for volume of distribution to describe C max, was lower in the low‐leptin cohorts compared with the higher‐leptin cohorts (Table 1). Similarly, mean C trough values were lowest in the low‐leptin cohorts 1 and 2 (355 and 349 mg/L, respectively), with higher mean C trough observed in the higher‐leptin cohorts 3 and 4 (397 and 433 mg/L, respectively). The PK data showed a trend towards increasing concentrations of total mibavademab with increasing levels of baseline leptin (Figure 3a). Lower leptin was associated with a greater reduction from baseline in bodyweight (Figure 3b).
FIGURE 2.
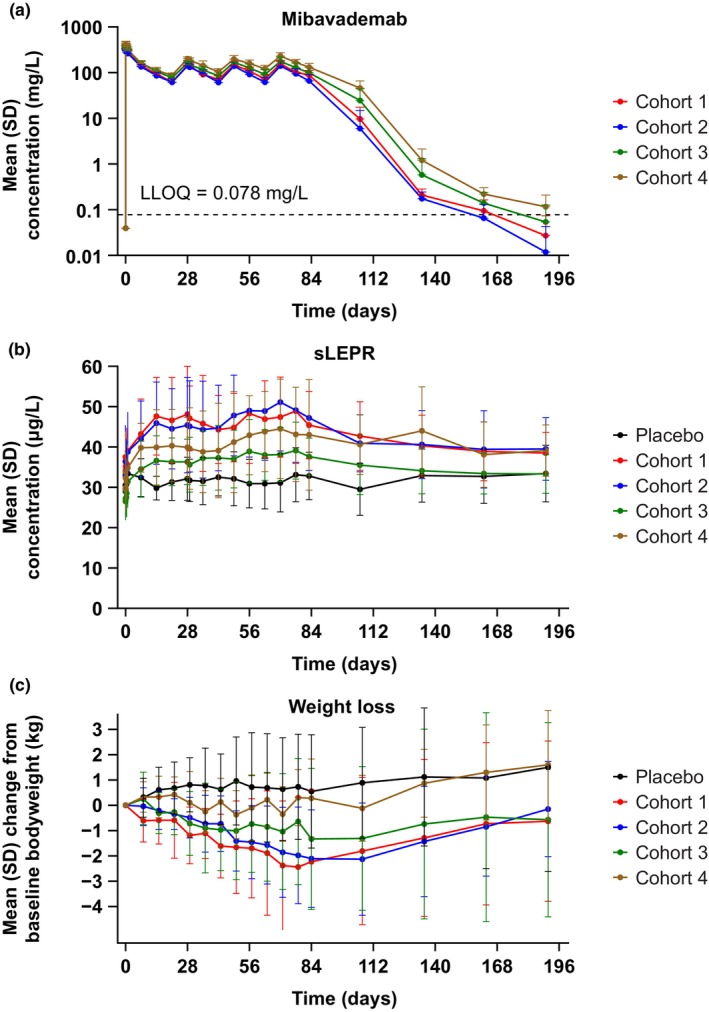
Mean (SD) concentrations of (a) total mibavademab in serum, (b) sLEPR in serum, and (c) weight loss by nominal time after multiple‐dose i.v. administration. Cohort 1: men, leptin <5 ng/mL, BMI 28–40 kg/m2; cohort 2: men, leptin <5 ng/mL, BMI 25–28 kg/m2; cohort 3: men, leptin 5–8 ng/mL, BMI 28–40 kg/m2; and cohort 4: women, leptin 5–24 ng/mL, BMI 28–40 kg/m2. Mibavademab was administered as a 15 mg/kg i.v. loading dose followed by 10 mg/kg i.v. doses at weeks 3, 6, and 9. Results are shown for n = 13, n = 7, n = 15, n = 15, and n = 6 participants in the placebo group and cohorts 1, 2, 3, and 4, respectively. Concentrations below the LLOQ were set to LLOQ/2. BMI, body mass index; i.v., intravenous; LLOQ, lower limit of quantitation; SD, standard deviation; sLEPR, total soluble leptin receptor.
TABLE 3.
C trough and C max of total mibavademab with multiple‐dose i.v. administration in overweight or obese healthy participants with various baseline leptin ranges.
| Parameters (units) | Total mibavademab in serum, mean (SD) | |||
|---|---|---|---|---|
| Cohort 1: Male, leptin < 5 ng/mL, BMI 28–40 kg/m2 (n = 7) | Cohort 2: Male, leptin < 5 ng/mL, BMI 25–28 kg/m2 (n = 15) | Cohort 3: Male, leptin 5–8 ng/mL, BMI 28–40 kg/m2 (n = 15) | Cohort 4: Female, leptin 5–24 ng/mL, BMI 28–40 kg/m2 (n = 6) | |
| C trough (mg/L) | 72.0 (17.7) | 61.4 (15.9) | 91.0 (25.2) | 121 (22.7) |
| C max (mg/L) | 355 (39.4) | 349 (69.7) | 397 (33.0) | 433 (63.6) |
Note: Mibavademab was administered as a 15 mg/kg i.v. loading dose followed by 10 mg/kg i.v. doses at weeks 3, 6, and 9. C trough values correspond to samples collected on approximately day 63 (~7 days before administration of the week 9 dose of 10 mg/kg i.v. mibavademab). C max values correspond to the highest concentration observed at any time (invariably after the 15 mg/kg i.v. loading dose).
Abbreviations: BMI, body mass index; C max, maximum concentration; C trough, trough concentration; i.v., intravenous; SD, standard deviation.
FIGURE 3.
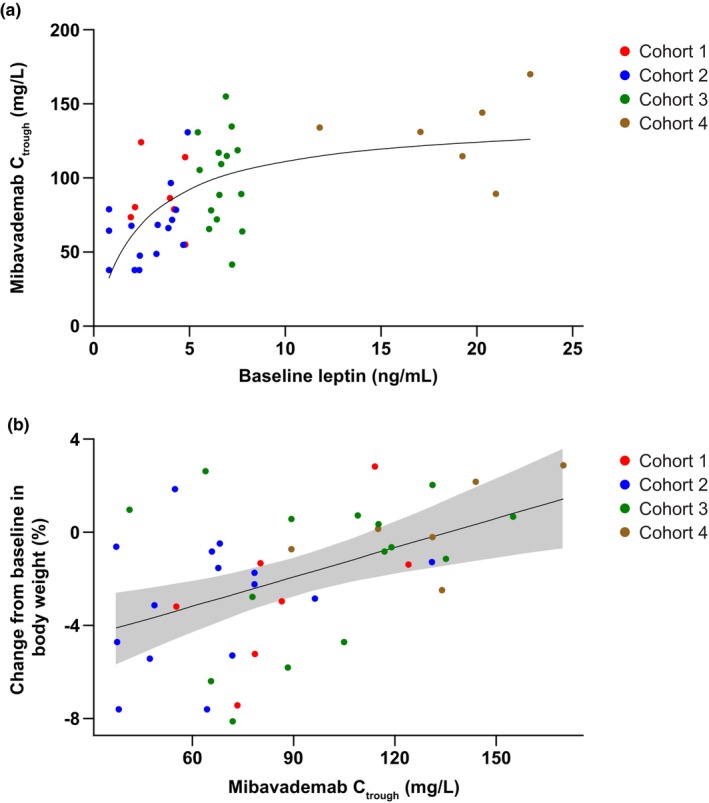
Scatter plots of data from individual participants for (a) mibavademab C trough concentrations versus baseline leptin, and (b) percentage change from baseline in body weight versus mibavademab C trough concentrations following multiple‐dose administration of mibavademab. Cohort 1: men, leptin <5 ng/mL, BMI 28–40 (n = 7); cohort 2: men, leptin <5 ng/mL, BMI 25–28 (n = 15); cohort 3: men, leptin 5–8 ng/mL, BMI 28–40 (n = 15); cohort 4: women, leptin 5–24 ng/mL, BMI 28–40 kg/m2 (n = 6). Mibavademab was administered as 15 mg/kg i.v. on day 1 and 10 mg/kg i.v. on days 29, 50, and 71. Day 63 values are reported for C trough. BMI, body mass index; C trough, trough concentration; i.v., intravenous.
Assessments of potential relationships between participant characteristics and C trough did not show an apparent exposure–response relationship between exposure and baseline body weight or age (Figure S2A,B). No effect of age on C trough was observed (Figure S2C). Higher C trough was observed in women than in men, but this relationship is likely confounded by baseline leptin (Figure 3a), which was higher in women than men (Table 1).
Concentrations of total sLEPR
There were no obvious dose‐dependent differences in mean concentrations of total sLEPR for the single‐ascending‐dose administration part of this study (Figure 1c,d). For the multiple‐dose cohorts, baseline sLEPR concentrations demonstrated a trend toward higher concentrations in those with lower leptin levels, but differences were not statistically significant due to high variability. Mean concentrations of total sLEPR remained at ~30 μg/L in the placebo group (Figure 2b).
In the mibavademab‐treated groups (cohorts 1–4), mean concentrations of total sLEPR demonstrated a modest increase from baseline over the first few weeks (gradual increases with each successive dose), consistent with binding of mibavademab to soluble target. At baseline, mean (standard deviation) concentrations of sLEPR were 37.5 (5.41), 36.4 (8.98), 29.5 (6.15), and 33.9 (9.90) μg/L in cohorts 1, 2, 3, and 4, respectively. On day 63, total sLEPR concentrations in serum increased by ~1.2‐fold relative to baseline in all cohorts (Figure 4).
FIGURE 4.
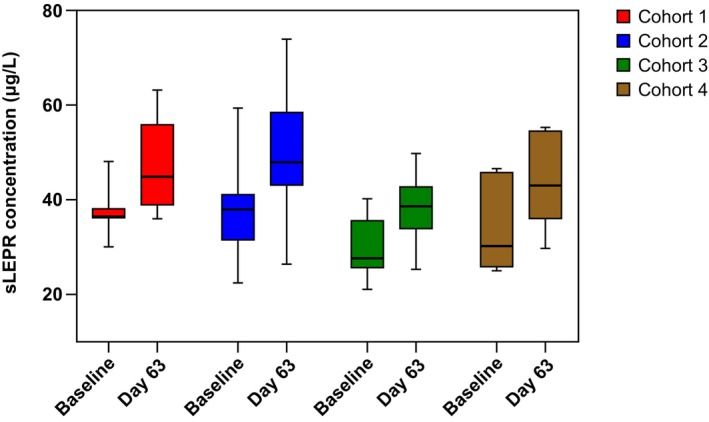
Concentrations of sLEPR in serum at baseline and on day 63 in cohorts 1–4 after multiple‐dose administration of mibavademab. Cohort 1: men, leptin <5 ng/mL, BMI 28–40 (n = 7); cohort 2: men, leptin <5 ng/mL, BMI 25–28 (n = 15); cohort 3: men, leptin 5–8 ng/mL, BMI 28–40 (n = 15); cohort 4: women, leptin 5–24 ng/mL, BMI 28–40 kg/m2 (n = 6). Mibavademab was administered intravenously as 15 mg/kg on day 1 and 10 mg/kg on days 29, 50, and 71. BMI, body mass index; sLEPR, total soluble leptin receptor.
As shown in Figure S3A, total sLEPR during treatment demonstrated a trend for an inverse relationship to baseline leptin levels and concentrations of total mibavademab. Because baseline sLEPR concentrations of mibavademab were highest in cohorts 1 and 2, the highest on‐treatment mean levels of total sLEPR were also observed in these groups (Figure S3B).
Immunogenicity assessment
Of the 42 participants in part A, one in the placebo group demonstrated a treatment‐emergent ADA response with low titer, whereas one randomized to i.v. single‐dose mibavademab 3 mg/kg had a pre‐existing ADA response. There was no indication that the low titer or pre‐existing ADAs affected the PKs or efficacy of mibavademab.
None of the participants receiving repeated doses of mibavademab tested positive for ADAs.
Pharmacodynamics (decreased body weight)
Following administration of the multiple‐dose regimen, body weight (percent change and absolute change) decreased from baseline to week 12 (day 84) in cohorts 1, 2, and 3 (but not cohort 4) relative to placebo (Table S4). The difference in the least‐squares mean (standard error) percent change was −3.1 (1.27), −3.1 (1.04), −2.0 (1.03), and −0.1 (1.34) in cohorts 1, 2, 3, and 4, respectively, with corresponding p values of 0.017, 0.004, 0.056, and 0.957. There was an apparent inverse relationship between baseline leptin and the magnitude of the weight loss effect. 11 As shown in Figure 3b, there was a relationship between C trough and percent change in body weight at week 12 relative to baseline: participants with lower C trough tended to demonstrate a greater decrease in percent body weight loss than those with higher C trough.
DISCUSSION
The PKs and pharmacodynamics of mibavademab were characterized following single i.v. or s.c. doses in healthy volunteers, and multiple i.v. doses at a single‐dose level in overweight/obese but otherwise healthy participants over a range of baseline leptin levels and BMIs. The PKs of mibavademab showed evidence of a brief absorption phase (for s.c. administration), a distribution phase (for both i.v. and s.c. administration), and an elimination phase (linear when concentrations were sufficient to saturate the target‐mediated pathway and nonlinear when concentrations of mibavademab were insufficient to saturate the target‐mediated clearance pathway). The linear elimination phase was observed briefly at the 10 mg/kg dose level, and clearly at the 30 mg/kg i.v. dose level. Greater‐than‐dose‐proportional changes in exposure were observed over the range of single i.v. doses (0.3–30 mg/kg) and single s.c. doses (300–600 mg). There was a modest 20% increase in total sLEPR from baseline with mibavademab treatment. However, variability in sLEPR was relatively high and no dose response in total sLEPR levels was apparent.
Assessment of the baseline covariates influencing the single‐dose PKs of mibavademab suggested that body weight was an important covariate, with higher body weight resulting in lower exposure. Of note, body weight is a typical covariate for the PKs of many monoclonal antibodies. A modest trend of decreasing antibody exposure with increasing age was observed following the single 30 mg/kg i.v. dose, but this relationship was likely confounded by increased baseline body weight with age. Following multiple doses of mibavademab i.v. across various ranges of leptin and body weight, baseline leptin appeared to be an important covariate affecting mibavademab PKs, where higher exposure was observed with increasing baseline leptin levels. This observation suggested that mibavademab is eliminated less rapidly in the setting of higher baseline leptin, which may be due to lower target (i.e., LEPR) levels and therefore a reduction in target‐mediated clearance.
Slightly higher baseline levels of total sLEPR were observed in the relatively low leptin (<8.0 ng/mL) cohorts 1 and 2, suggesting upregulation of membrane‐bound LEPR in the state of relative leptin deficiency. The sLEPR is formed by shedding of the ectodomain of the membrane‐bound LEPR and appears to modulate the availability of leptin. 10 , 14 Total sLEPR demonstrated a modest 20% increase from baseline following administration of repeated doses of mibavademab, indicative of the binding of drug to the soluble target. However, sLEPR concentrations also demonstrated considerable variability across participants over time.
Multiple‐dose administration of i.v. mibavademab effected a reduction in body weight from baseline to 12 weeks, most notably in the low‐leptin cohorts. In addition, lower mibavademab concentrations were observed within these low‐leptin cohorts. The apparent inverse relationship of drug concentration to weight loss suggests greater target‐mediated clearance at lower baseline leptin levels, potentially due to higher LEPR expression. 15 However, total sLEPR was only modestly higher in the low‐leptin cohorts. Overall, these data suggest that baseline levels of the endogenous LEPR ligand, leptin, are a key determinant of the pharmacological effects of mibavademab on body weight, consistent with the LEPR agonist activity of the drug. These results are also consistent with nonclinical findings where mibavademab promoted dramatic weight loss in mice with genetic leptin deficiency. 11
As reported previously, data from this phase I study showed that mibavademab was generally well tolerated in the healthy participants, with most adverse events reported as mild or moderate in severity. 11 No treatment‐emergent ADAs were reported in this study.
There were limitations to this study that raise uncertainty about the generalizability of the results of mibavademab effects on weight loss, such as the relative rarity of overweight and obese participants with low leptin levels. In addition, the study period was 12 weeks, which could be a relatively short time to assess maximal weight loss. 16 The only cohort in which mibavademab did not induce significant weight loss was cohort 4, the female cohort, with leptin levels of 5–24 ng/mL and BMI between 28 and 40 kg/m2, indicating that mibavademab may be more useful for men with low leptin levels because women usually show very high leptin levels. Despite significant weight loss induced by mibavademab in the cohorts, the reduction seemed moderate over the course of 12 weeks. Despite these limitations, the observed weight loss provides proof of concept for the ability of mibavademab to induce downstream weight loss in overweight and obese adults with low levels of circulating leptin. Further repeat‐dose studies incorporating multiple dose levels are required to fully elucidate concentration–response relationships for mibavademab.
Like leptin, mibavademab likely elicits its actions by engaging LEPR to initiate JAK‐STAT3 signaling within the hypothalamus, particularly the arcuate nucleus. 17 The arcuate nucleus lies within close proximity to the circumventricular organ, the median eminence, that lacks a blood‐brain barrier. 18 A subpopulation of neurons in the arcuate nucleus have been shown to be supplied by some blood vessels that lack blood‐brain barrier markers, including endothelial barrier antigen and the transferrin receptor. 19 , 20 , 21 Hence, it is possible that mibavademab may enter the arcuate nucleus through these fenestrated blood vessels without requiring specific transport across the blood‐brain barrier. However, the saturable leptin uptake into the brain suggests the involvement of transport mechanisms. Studies have demonstrated the role of the short isoform of LEPR in leptin transport, via receptor‐mediated transcytosis, across the blood‐brain barrier. 22 Of note, typically monoclonal antibody concentrations in the cerebrospinal fluid are detected at 0.1% of circulating serum concentrations. 23 At the doses administered, mibavademab appears to achieve sufficient concentration to activate LEPRs within the central nervous system. The short isoforms of LEPR, however, are located in the periphery where LEPR acts as a decoy receptor and where the shed LEPR circulates as sLEPR. 24 Consequently, serum mibavademab and sLEPR concentrations may not directly reflect concentrations at the target tissue, the hypothalamus.
In summary, this study characterized the PKs and pharmacodynamics of mibavademab in healthy participants and demonstrated that mibavademab is generally well tolerated at the doses tested, with no observed immunogenicity in lean, overweight, and obese individuals. The study provides proof of concept for the reduction of baseline body weight with mibavademab treatment when basal leptin levels are sufficiently low. Mibavademab holds promise in the treatment of conditions with defective leptin signaling or leptin deficiency given its low immunogenicity potential, long half‐life, and apparent pharmacological effect observed in preclinical models and low‐leptin obesity.
AUTHOR CONTRIBUTIONS
A.G., J.M., Y.W., C.H., B.A.O., S.P., W.Z., A.Z., H.P., F.V., and J.D.D. wrote the manuscript, designed the research, performed the research, and analyzed the data.
FUNDING INFORMATION
This study was funded by Regeneron Pharmaceuticals, Inc.
CONFLICT OF INTEREST STATEMENT
A.G. and C.H. were employees of Regeneron Pharmaceuticals at the time of clinical study conduct and data analysis. J.M., Y.W., B.A.O., S.P., W.Z., A.Z., H.P., and J.D.D. are employees of and shareholders in Regeneron Pharmaceuticals, Inc. F.V. declared no competing interests for this work.
Supporting information
Data S1.
ACKNOWLEDGMENTS
The authors would like to thank Hong Yan and Will He Zhongqing from Regeneron Pharmaceuticals, Inc., for their contribution to this study. Medical writing support, under the direction of the authors, was provided by Rhutika Dessai, MSc, and Rachel Dunn, PhD, of Prime, Knutsford, UK, funded by Regeneron Pharmaceuticals, Inc., according to good publication practice guidelines (link). The sponsor was involved in the study design and collection, analysis, and interpretation of data, as well as data checking of information provided in the manuscript. The authors were responsible for all content and editorial decisions, and received no honoraria related to the development of this publication.
Gewitz A, Mendell J, Wang Y, et al. Pharmacokinetics and pharmacodynamics of mibavademab (a leptin receptor agonist): Results from a first‐in‐human phase I study. Clin Transl Sci. 2024;17:e13762. doi: 10.1111/cts.13762
Andrew Gewitz and Charles Harris worked at Regeneron Pharmaceuticals, Inc., Tarrytown, NY, USA, at the time of the study.
DATA AVAILABILITY STATEMENT
Qualified researchers may request access to study documents (including the clinical study report, study protocol with any amendments, blank case report form, and statistical analysis plan) that support the methods and findings reported in this manuscript. Individual anonymized participant data will be considered for sharing once the product and indication has been approved by major health authorities (e.g., the FDA, EMA, PMDA, etc), provided there is legal authority to share the data and no reasonable likelihood of participant re‐identification. Submit requests to https://vivli.org/.
REFERENCES
- 1. Allison MB, Patterson CM, Krashes MJ, Lowell BB, Myers MG Jr, Olson DP. TRAP‐seq defines markers for novel populations of hypothalamic and brainstem LepRb neurons. Mol Metab. 2015;4:299‐309. doi: 10.1016/j.molmet.2015.01.012 [DOI] [PMC free article] [PubMed] [Google Scholar]
- 2. Al Maskari MY, Alnaqdy AA. Correlation between serum leptin levels, body mass index and obesity in Omanis. Sultan Qaboos Univ Med J. 2006;6:27‐31. [PMC free article] [PubMed] [Google Scholar]
- 3. Ruhl CE, Everhart JE. Leptin concentrations in the United States: relations with demographic and anthropometric measures. Am J Clin Nutr. 2001;74:295‐301. doi: 10.1093/ajcn/74.3.295 [DOI] [PubMed] [Google Scholar]
- 4. Lönnqvist F, Wennlund A, Arner P. Relationship between circulating leptin and peripheral fat distribution in obese subjects. Int J Obes Relat Metab Disord. 1997;21:255‐260. doi: 10.1038/sj.ijo.0800394 [DOI] [PubMed] [Google Scholar]
- 5. Considine RV, Sinha MK, Heiman ML, et al. Serum immunoreactive‐leptin concentrations in normal‐weight and obese humans. N Engl J Med. 1996;334:292‐295. doi: 10.1056/nejm199602013340503 [DOI] [PubMed] [Google Scholar]
- 6. Herrick JE, Panza GS, Gollie JM. Leptin, leptin soluble receptor, and the free leptin index following a diet and physical activity lifestyle intervention in obese males and females. J Obes. 2016;2016:8375828. doi: 10.1155/2016/8375828 [DOI] [PMC free article] [PubMed] [Google Scholar]
- 7. van Dielen FM, Van't Veer C, Buurman WA, Greve JW. Leptin and soluble leptin receptor levels in obese and weight‐losing individuals. J Clin Endocrinol Metab. 2002;87:1708‐1716. doi: 10.1210/jcem.87.4.8381 [DOI] [PubMed] [Google Scholar]
- 8. Ravussin Y, Leibel RL, Ferrante AW Jr. A missing link in body weight homeostasis: the catabolic signal of the overfed state. Cell Metab. 2014;20:565‐572. doi: 10.1016/j.cmet.2014.09.002 [DOI] [PMC free article] [PubMed] [Google Scholar]
- 9. Obradovic M, Sudar‐Milovanovic E, Soskic S, et al. Leptin and obesity: role and clinical implication. Front Endocrinol (Lausanne). 2021;12:585887. doi: 10.3389/fendo.2021.585887 [DOI] [PMC free article] [PubMed] [Google Scholar]
- 10. Wauman J, Zabeau L, Tavernier J. The leptin receptor complex: heavier than expected? Front Endocrinol (Lausanne). 2017;8:30. doi: 10.3389/fendo.2017.00030 [DOI] [PMC free article] [PubMed] [Google Scholar]
- 11. Altarejos JY, Pangilinan J, Podgrabinska S, et al. Preclinical, randomized phase 1, and compassionate use evaluation of REGN4461, a leptin receptor agonist antibody for leptin deficiency. Sci Transl Med. 2023;15:eadd4897. doi: 10.1126/scitranslmed.add4897 [DOI] [PubMed] [Google Scholar]
- 12. Buettner R, Bollheimer LC, Zietz B, et al. Definition and characterization of relative hypo‐ and hyperleptinemia in a large Caucasian population. J Endocrinol. 2002;175:745‐756. doi: 10.1677/joe.0.1750745 [DOI] [PubMed] [Google Scholar]
- 13. US Food and Drug Administration . Immunogenicity testing of therapeutic protein products ‐ developing and validating assays for anti‐drug antibody detection: guidance for industry. Accessed July 1, 2023. https://www.fda.gov/media/119788/download
- 14. Zastrow O, Seidel B, Kiess W, et al. The soluble leptin receptor is crucial for leptin action: evidence from clinical and experimental data. Int J Obes Relat Metab Disord. 2003;27:1472‐1478. doi: 10.1038/sj.ijo.0802432 [DOI] [PubMed] [Google Scholar]
- 15. Pal R, Sahu A. Leptin signaling in the hypothalamus during chronic central leptin infusion. Endocrinology. 2003;144:3789‐3798. doi: 10.1210/en.2002-0148 [DOI] [PubMed] [Google Scholar]
- 16. US Food and Drug Administration . Guidance for industry: developing products for weight management: draft guidance. Accessed July 1, 2023. https://www.fda.gov/media/71252/download
- 17. Allison MB, Myers MG Jr. 20 years of leptin: connecting leptin signaling to biological function. J Endocrinol. 2014;223:T25‐T35. doi: 10.1530/JOE-14-0404 [DOI] [PMC free article] [PubMed] [Google Scholar]
- 18. Ganong WF. Circumventricular organs: definition and role in the regulation of endocrine and autonomic function. Clin Exp Pharmacol Physiol. 2000;27:422‐427. doi: 10.1046/j.1440-1681.2000.03259.x [DOI] [PubMed] [Google Scholar]
- 19. Ciofi P, Garret M, Lapirot O, et al. Brain‐endocrine interactions: a microvascular route in the mediobasal hypothalamus. Endocrinology. 2009;150:5509‐5519. doi: 10.1210/en.2009-0584 [DOI] [PMC free article] [PubMed] [Google Scholar]
- 20. Norsted E, Gomuc B, Meister B. Protein components of the blood‐brain barrier (BBB) in the mediobasal hypothalamus. J Chem Neuroanat. 2008;36:107‐121. doi: 10.1016/j.jchemneu.2008.06.002 [DOI] [PubMed] [Google Scholar]
- 21. Faouzi M, Leshan R, Bjornholm M, et al. Differential accessibility of circulating leptin to individual hypothalamic sites. Endocrinology. 2007;148:5414‐5423. doi: 10.1210/en.2007-0655 [DOI] [PubMed] [Google Scholar]
- 22. Di Spiezio A, Sandin ES, Dore R, et al. The LepR‐mediated leptin transport across brain barriers controls food reward. Mol Metab. 2018;8:13‐22. doi: 10.1016/j.molmet.2017.12.001 [DOI] [PMC free article] [PubMed] [Google Scholar]
- 23. Yu YJ, Zhang Y, Kenrick M, et al. Boosting brain uptake of a therapeutic antibody by reducing its affinity for a transcytosis target. Sci Transl Med. 2011;3:84ra44. doi: 10.1126/scitranslmed.3002230 [DOI] [PubMed] [Google Scholar]
- 24. Tartaglia LA. The leptin receptor. J Biol Chem. 1997;272:6093‐6096. doi: 10.1074/jbc.272.10.6093 [DOI] [PubMed] [Google Scholar]
Associated Data
This section collects any data citations, data availability statements, or supplementary materials included in this article.
Supplementary Materials
Data S1.
Data Availability Statement
Qualified researchers may request access to study documents (including the clinical study report, study protocol with any amendments, blank case report form, and statistical analysis plan) that support the methods and findings reported in this manuscript. Individual anonymized participant data will be considered for sharing once the product and indication has been approved by major health authorities (e.g., the FDA, EMA, PMDA, etc), provided there is legal authority to share the data and no reasonable likelihood of participant re‐identification. Submit requests to https://vivli.org/.